From October 12 to October 18, 2026, global markets diverged sharply under the combined influence of higher energy prices, slowing consumption momentum and a reassessment of returns on AI investment. Weekly trading data available on the morning of October 19 Beijing time showed WTI crude surging 10.41%, the US 10-year Treasury yield falling 15 basis points, and the Nasdaq 100 declining 5.49%. Long-dated Treasuries led the bond rally, technology shares continued correcting, and energy and financial stocks proved relatively resilient.
Stronger US inflation data coincided with falling long-term Treasury yields, revealing a shift in the focus of market pricing. Higher energy costs raised headline prices while directly crowding out other household spending. Bond investors increasingly traded the drag of high costs and interest rates on growth, while equity and credit markets scrutinized corporate financing burdens, the delivery of profits and cash-flow quality. Performance gaps widened across industries and credit quality.
US September CPI Reaches 3.7% Year on Year as Fuel Bills Squeeze Core Retail Growth

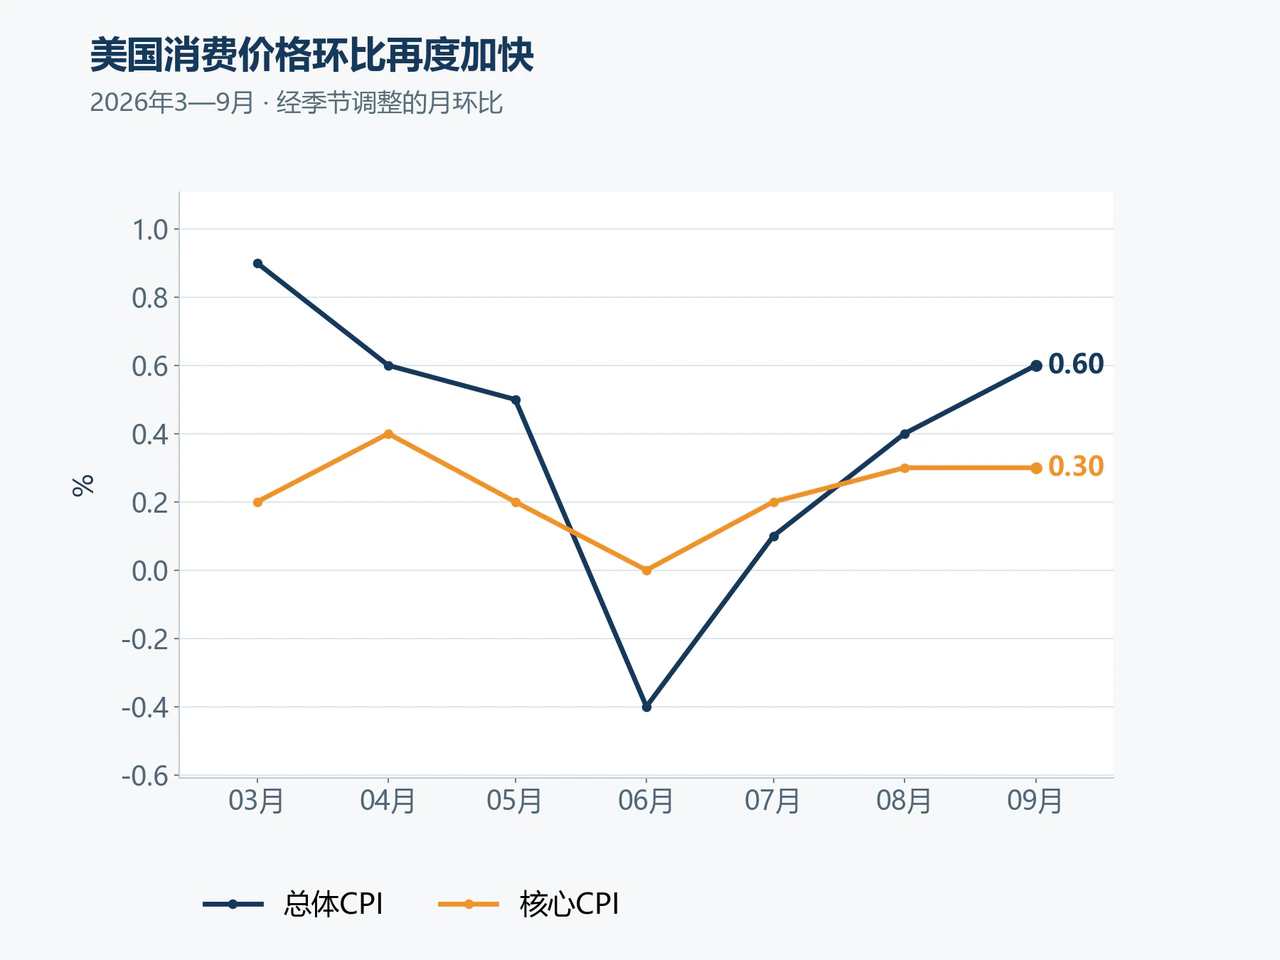
US September inflation and retail data released last week clearly showed energy costs transmitting through the economy. Seasonally adjusted CPI rose 0.6% month on month, above August's 0.4%, while annual inflation increased from 3.4% to 3.7%. Gasoline prices jumped 9.1% from the previous month and accounted for more than half the headline CPI increase. Core CPI, excluding food and energy, rose 0.3% month on month against expectations of 0.2%, while annual core inflation increased from 2.4% to 2.6%. Continued increases in shelter and some service prices showed that businesses and households faced cost increases beyond fuel alone.
Producer costs accelerated even faster. September final-demand PPI rose 1.3% month on month and 6.3% year on year. Within the breakdown, final-demand energy-goods prices jumped 10.8% from the previous month, while transportation and warehousing services rose 3.4%. Fuel procurement and logistics expenses were rising together. Whether downstream companies can pass those costs smoothly to end customers will directly shape subsequent consumer inflation and profit margins.
September retail data already showed higher energy costs eroding households' real spending capacity. US retail sales rose 0.8% month on month, apparently far above the 0.3% expected in a FactSet survey. But the figures are not adjusted for prices, and gasoline-station sales alone surged 6.4%. Excluding gas stations, sales rose only 0.2%. Control-group retail sales, which feed directly into GDP consumption estimates, edged up just 0.1%, below the expected 0.3% and sharply slower than August's 1.2%. As fuel bills absorbed more household budgets, marginal momentum in other goods spending clearly weakened.
A still-solid labor market continued cushioning household income. Initial unemployment claims were 199,000 in the week ended October 10, essentially unchanged from the previous week's revised 198,000, with layoffs remaining low. Oxford Economics economist Michael Pearce expected US consumption to grow at a 3.3% annualized rate in the third quarter, while warning that high prices would weaken spending momentum ahead of holiday shopping. Strong cumulative third-quarter growth and marginal weakness in September can coexist, making fourth-quarter earnings expectations more dependent on individual firms' pricing power and consumers' income capacity.
The 10-Year Treasury Yield Falls 15 Basis Points as Wider High-Yield Spreads Reveal Credit Differentiation
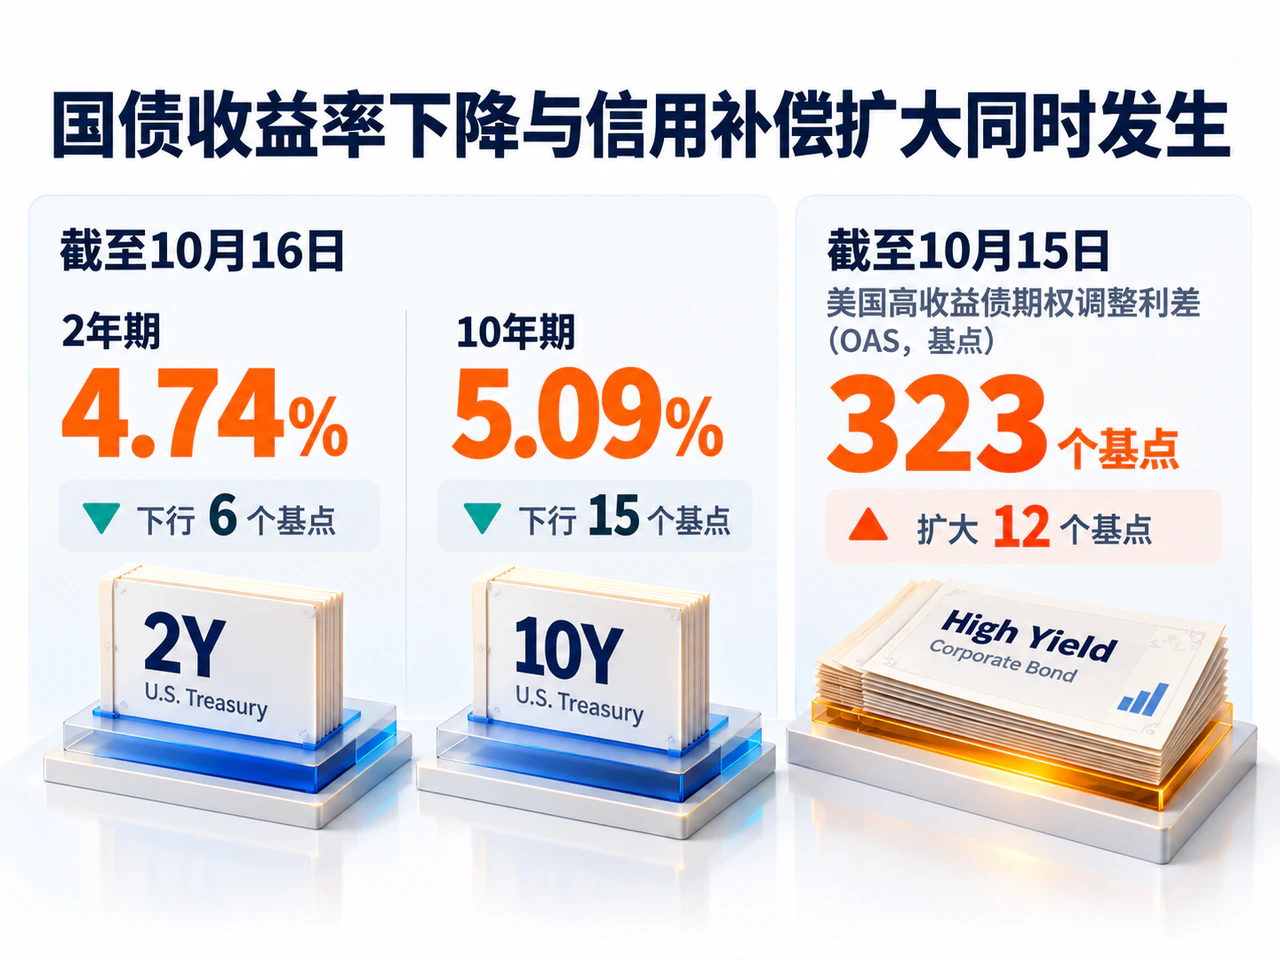
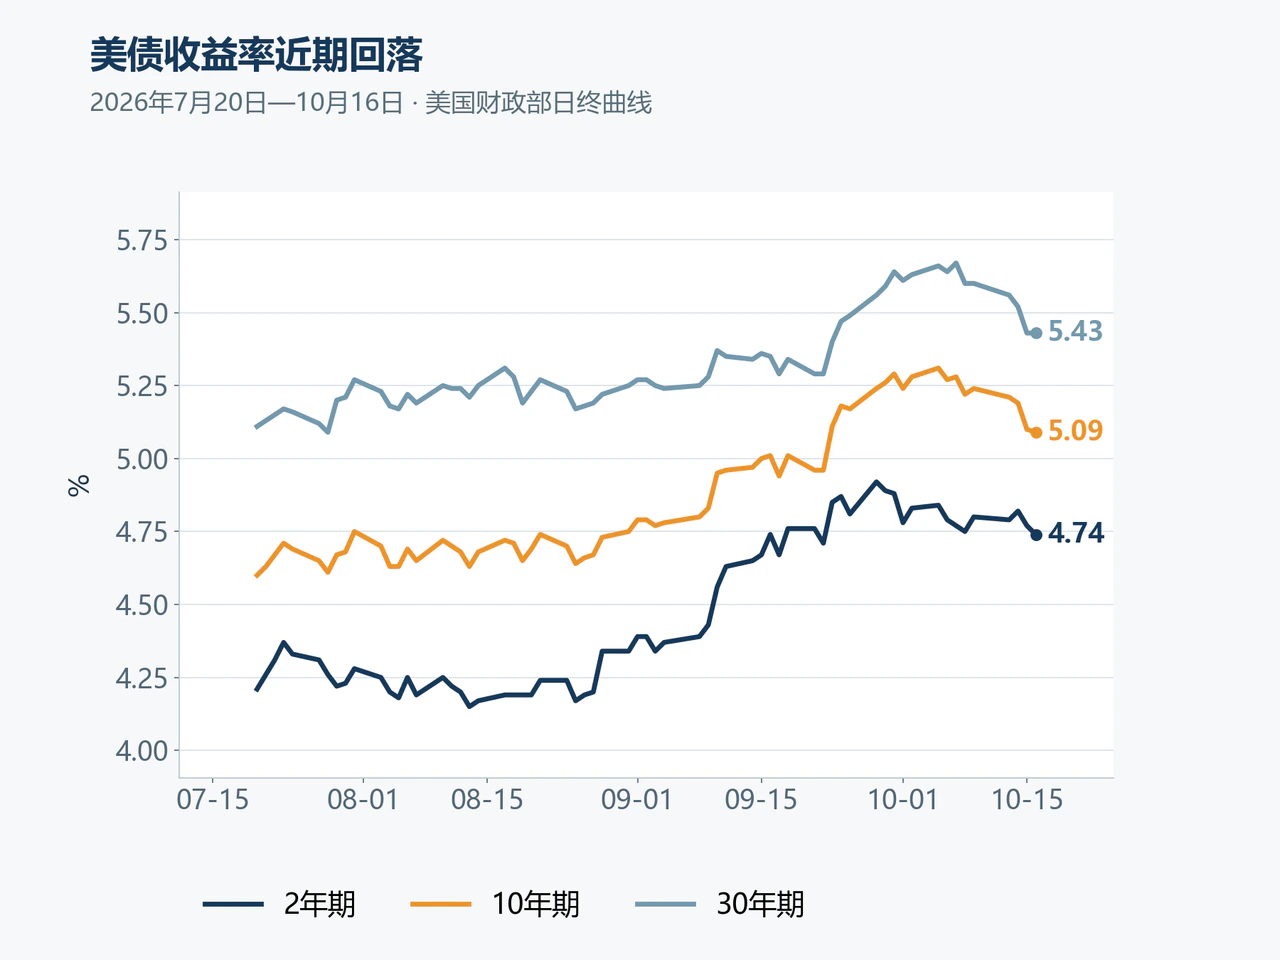
Growth concerns outweighed near-term inflation readings in rates markets, producing a bull flattening of the Treasury curve. Using the US Treasury's consistent end-of-day curve, the 2-year yield closed October 16 at 4.74%, down 6 basis points from October 9; the 5-year closed at 4.89%, down 13 basis points; the 10-year at 5.09%, down 15; and the 30-year at 5.43%, down 17. The 10-year–2-year spread narrowed from 44 to 35 basis points.
The short and long ends reacted to fundamentals at different times during the week. Inflation and policy-path expectations pushed the 2-year yield as high as 4.82% on Wednesday before it retreated. Long maturities were more sensitive to growth and financing pressure: the 10-year yield fell 9 basis points on Thursday alone, accounting for most of the week's decline.
A decomposition shows that falling real yields drove most of the long-bond rally. Federal Reserve H.15 data show the 10-year TIPS real yield declining from 2.91% on October 9 to 2.78% on October 15, down 13 basis points. The nominal 10-year yield fell from 5.24% to 5.10%, down 14 basis points, leaving the difference—an approximate measure of inflation compensation—only 1 basis point narrower. The Wall Street Journal reported on October 15 that investors were focusing increasingly on the impact of high borrowing costs on the economic outlook, with safe-haven buying lowering both US and German sovereign yields.
A temporary pause in supply also supported Treasury demand. Penn Mutual Asset Management's October 12 weekly commentary noted that there were no coupon-bearing Treasury auctions during October 12–16, while the preceding week's high 10-year and 30-year issuance yields had attracted buyers. The lighter near-term supply schedule did not alter medium-term fiscal financing pressure: the fiscal 2026 US deficit was approximately $1.99 trillion, above the previous year's roughly $1.78 trillion, leaving substantial funding needs for long-term bonds to absorb. Europe faced fiscal constraints too. Reuters reported on October 16 that France's 10-year yield was moving toward 4.9%, with its spread over comparable German bonds approaching 140 basis points. Capacity for budget consolidation was directly affecting funding costs.
In contrast to falling risk-free rates, spreads on lower-quality corporate credit widened markedly. On October 15, the ICE BofA US investment-grade corporate option-adjusted spread was 84 basis points, only 1 basis point wider than October 9. The US high-yield spread widened 12 basis points to 323. Lower benchmark yields improved long-duration bond valuations, but weaker issuers were being asked to pay more risk compensation.
Financing in Hong Kong's US-dollar bond market reinforced this differentiation. On October 13, Tencent completed US-dollar and offshore-renminbi bond financing equivalent to approximately $5.7 billion. Its $1.8 billion of 10-year and 20-year dollar bonds were priced at Treasury spreads of 90 and 115 basis points, respectively, both 25 basis points inside initial guidance. New World Development, meanwhile, used a bond exchange to extend maturities. Approximately $199.1 million of outstanding principal was tendered, to be replaced by about $189.1 million of new notes due in 2032. Stronger companies could still obtain fresh long-term financing smoothly, while other issuers needed liability management to buy time.
Nasdaq 100 Falls 5.49% for the Week as Computing Debt and Chip Competition Trigger a Technology Repricing
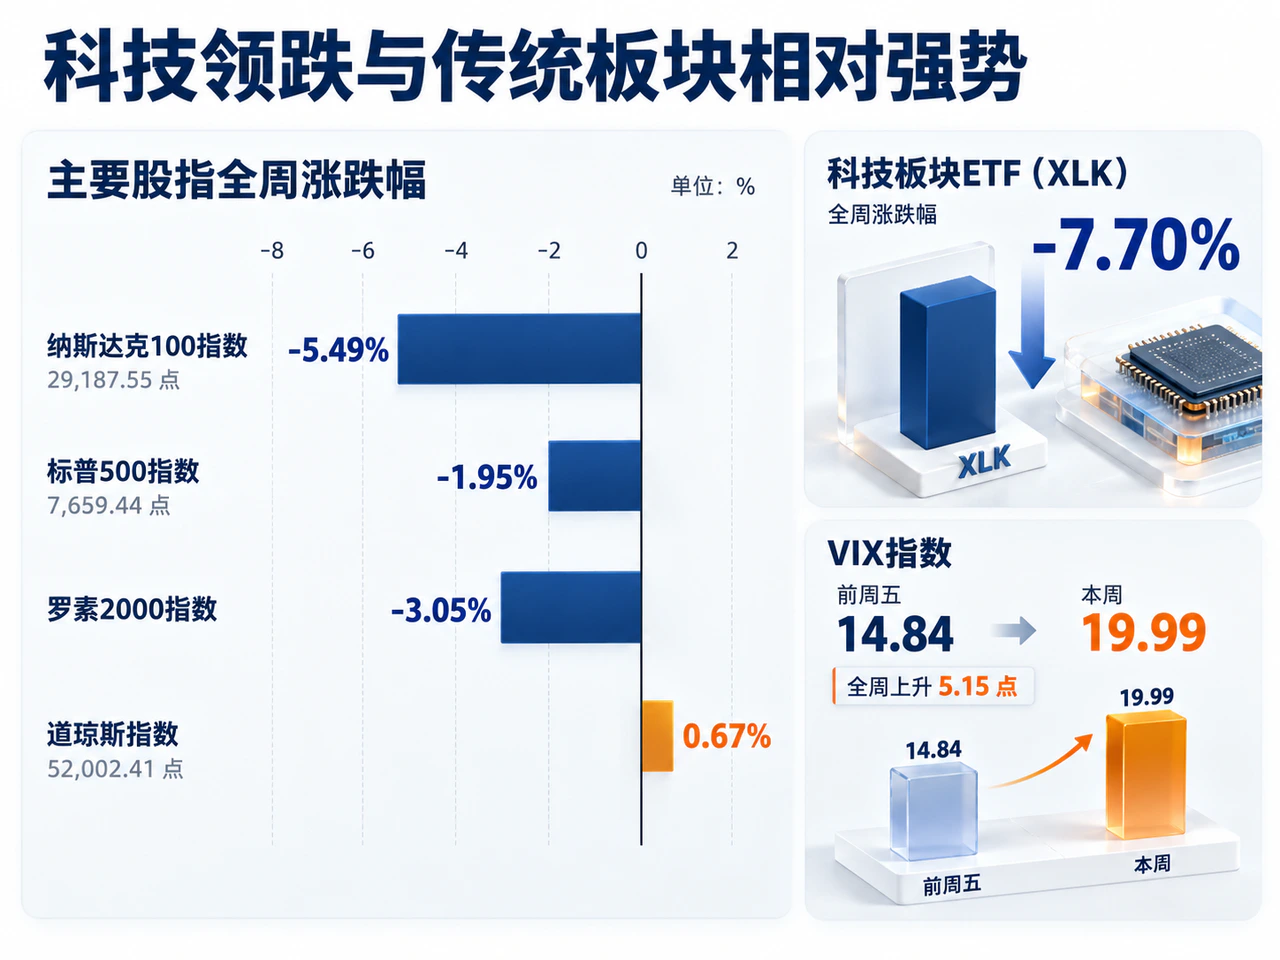
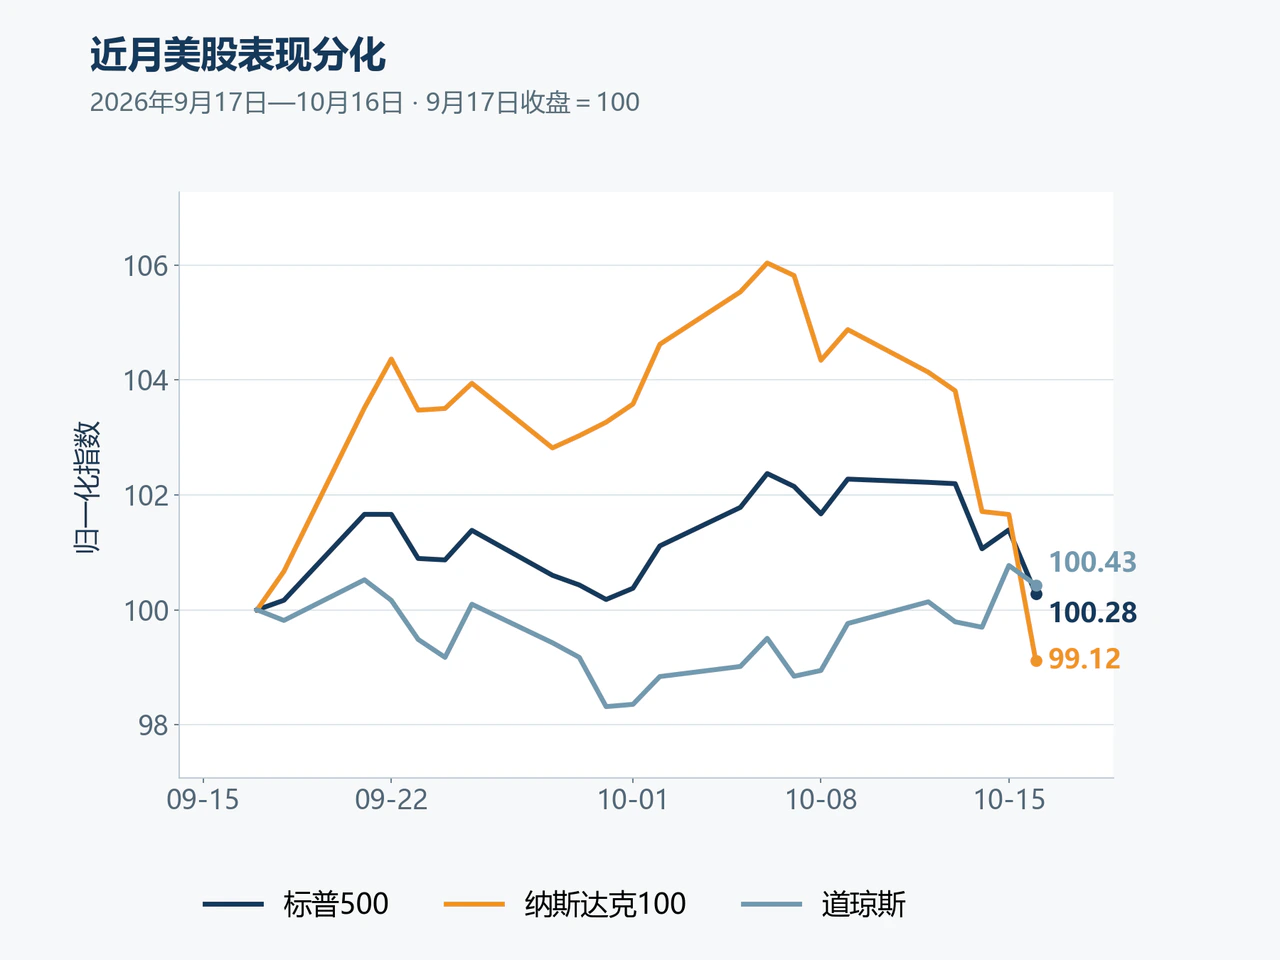
The US equity correction was heavily concentrated in technology and AI-related companies, while traditional sectors showed resilience. The Nasdaq 100 fell 5.49% to 29,187.55, the S&P 500 lost 1.95% to 7,659.44, and the Russell 2000 declined 3.05%. The Dow rose 0.67% to 52,002.41. Sector ETFs diverged sharply: technology ETF XLK fell 7.70%, while energy ETF XLE and financial ETF XLF gained 4.86% and 1.44%. VIX rose from the preceding Friday's 14.84 to 19.99, an increase of 5.15 points, as risk repricing accelerated toward the weekend.
Intensifying competition and rising financing burdens offered specific triggers for the technology adjustment. CNBC reported on October 13 that ChangXin Memory Technologies planned more powerful chips before year-end, heightening concerns over memory-industry competition. Micron fell more than 3% that day, and the SMH semiconductor ETF was down about 10% for the week by Friday. AI-infrastructure funding also came under scrutiny. CNBC reported that CoreWeave's total debt exceeded $51 billion, while its shares plunged approximately 25% for the week. The pace of computing expansion, funding costs and the timing of realized revenue were jointly constraining valuations investors were willing to pay.
The concentration of expected earnings made technology weakness more likely to transmit to the broader index. Citadel Securities research published October 14, using data through October 12, estimated expected third-quarter S&P 500 earnings-per-share growth at roughly 27% year on year. Micron and Nvidia alone accounted for 36% of the expected earnings increase, while the top ten contributors represented about two-thirds. With so much expected growth resting on a handful of companies, changes in competition or expected returns on capital spending can have an outsized effect on index valuations.
Current manufacturing results remained strong. TSMC reported on October 15 that third-quarter revenue reached $46.72 billion, up 41.2% year on year, while net profit was NT$763.06 billion, up 68.7%. It guided fourth-quarter revenue to $52.3 billion–$54.3 billion. Foundry earnings growth supplied realized evidence of AI demand, but public-market pricing also required an assessment of how long high growth could last and whether new investments would ultimately generate cash flow.
Valuation pressure in the US technology chain had spread to Asian markets. Last week, the Nikkei 225 fell 5.37%, while the Hang Seng edged down only 0.10%. The Associated Press reported that on October 15, Samsung Electronics and SK Hynix fell 9.5% and 11.1%, respectively, while Tokyo Electron and Kioxia fell 7.8% and 12.3%. Semiconductor, equipment and AI-investment companies were more sensitive to the repricing. Hong Kong's broader market remained relatively stable because of its different sector composition.
WTI Surges 10.41% Above $100 as Rate Expectations Leave Gold Modestly Lower
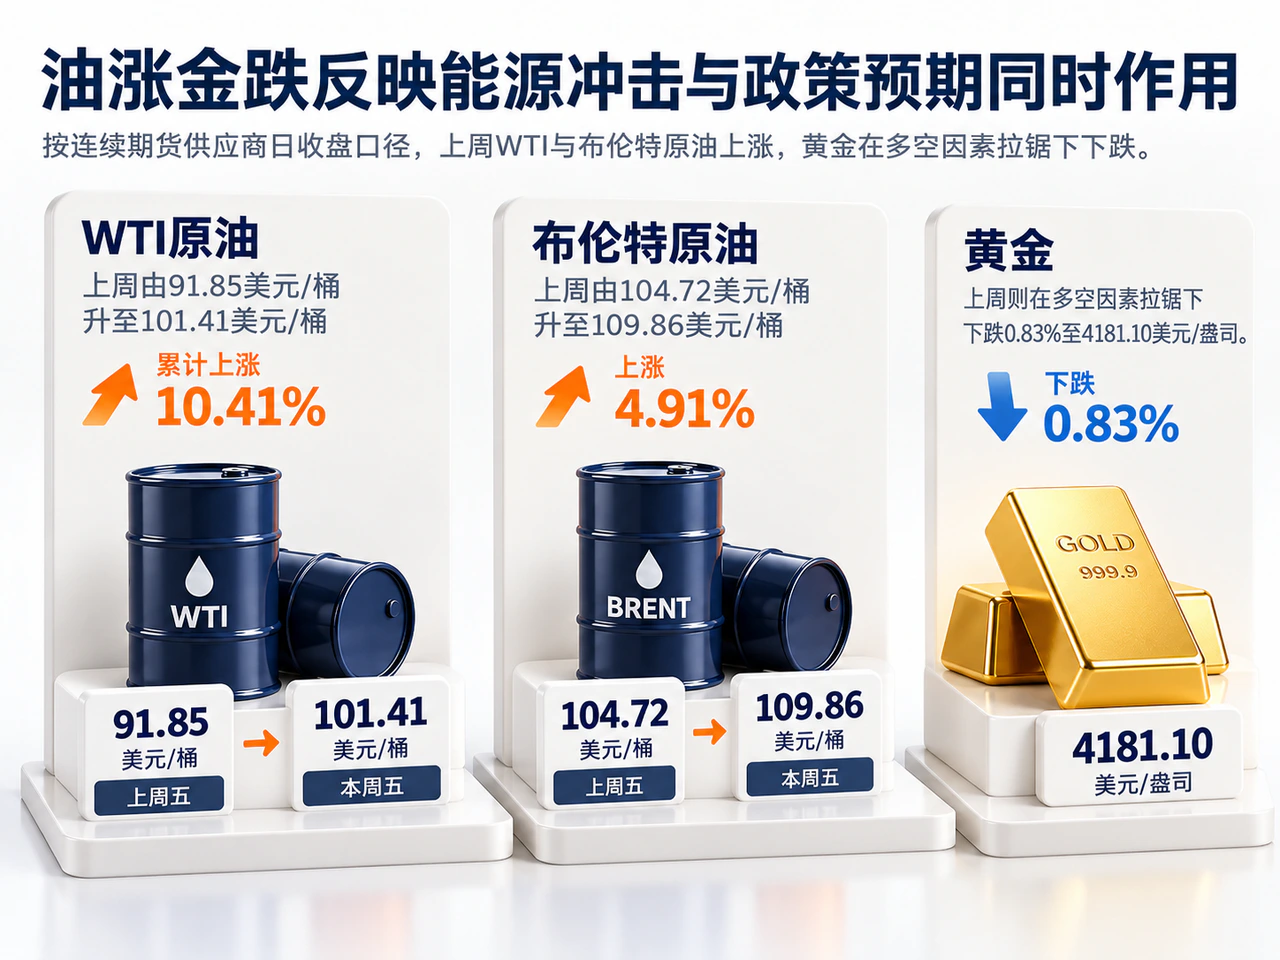
Crude rose sharply on supply disruptions and geopolitical risk. Using a continuous-futures provider's daily closes, WTI rose from $91.85 to $101.41 a barrel last week, a gain of 10.41%. Brent increased from $104.72 to $109.86, up 4.91%. US hurricane-related shutdowns and inventory drawdowns directly supported WTI, while the Iran conflict and disrupted Gulf shipping continued raising global delivery risks. Higher oil improved energy-company revenue expectations but increased input costs for transport, manufacturing and consumer industries.
Major consuming countries were accelerating inventory releases to ease tight supply. On October 15, the International Energy Agency said approximately 330 million barrels had been released under March's collective action, with around 100 million barrels still outstanding. Members agreed to accelerate the remaining releases and had arranged to supply more than 20 million barrels of diesel as soon as possible. Inventory releases increase near-term available supply, but transport and refining bottlenecks still affect how quickly it reaches end users.
Weekend policy developments showed elevated fuel costs prompting changes to sanctions arrangements. After the US cash-market close on Friday, October 16, Washington signed an executive order exempting new Russia-related sanctions, restrictions and tariffs listed in the Graham Act, while sanctions under other existing executive orders remained in force. Reuters reported on October 18 that Rubio had said on the 17th that the administration intended to take up to 60 days to assess the economic effects. Because the order came after Friday's close, the change would enter pricing in subsequent sessions. Its actual effect would depend on the additional supply delivered and implementation arrangements.
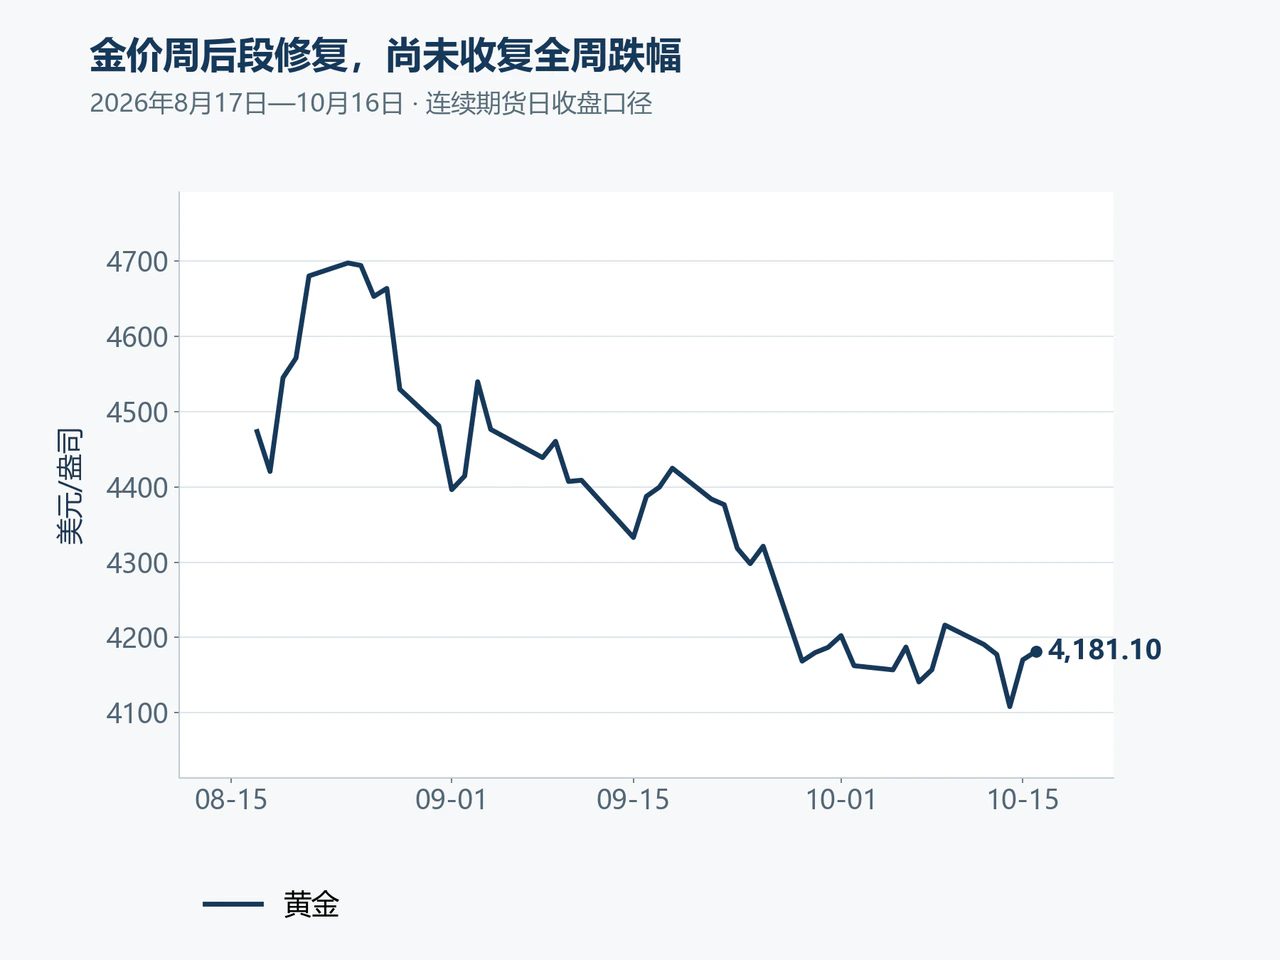
Gold fell 0.83% last week to $4,181.10 an ounce amid competing forces, while the dollar index declined 0.36% to 101.84. Gold recovered on Thursday and Friday after reaching a Wednesday low of $4,107.90. MUFG attributed the midweek decline mainly to stronger-than-expected US inflation and greater pricing of rate increases, followed by support from a weaker dollar and lower Treasury yields. The energy shock increased demand for defensive allocations but could also prolong restrictive monetary policy. These forces offset one another, leaving the late-week recovery unable to erase the full weekly loss.
China's September Exports Jump 36.3% as Upstream Costs and Weak Household Credit Constrain Domestic Transmission
China's September inflation figures released last week also showed a gap between upstream costs and end demand. CPI rose 0.9% year on year and core CPI 1.0%, while PPI rose 5.0% and industrial producer purchasing prices increased 6.9%. Producer-goods ex-factory prices rose 6.5%, but consumer-goods prices fell 0.1%. Rapid upstream inflation combined with weak pricing power at the consumer end squeezed downstream firms with limited bargaining power.
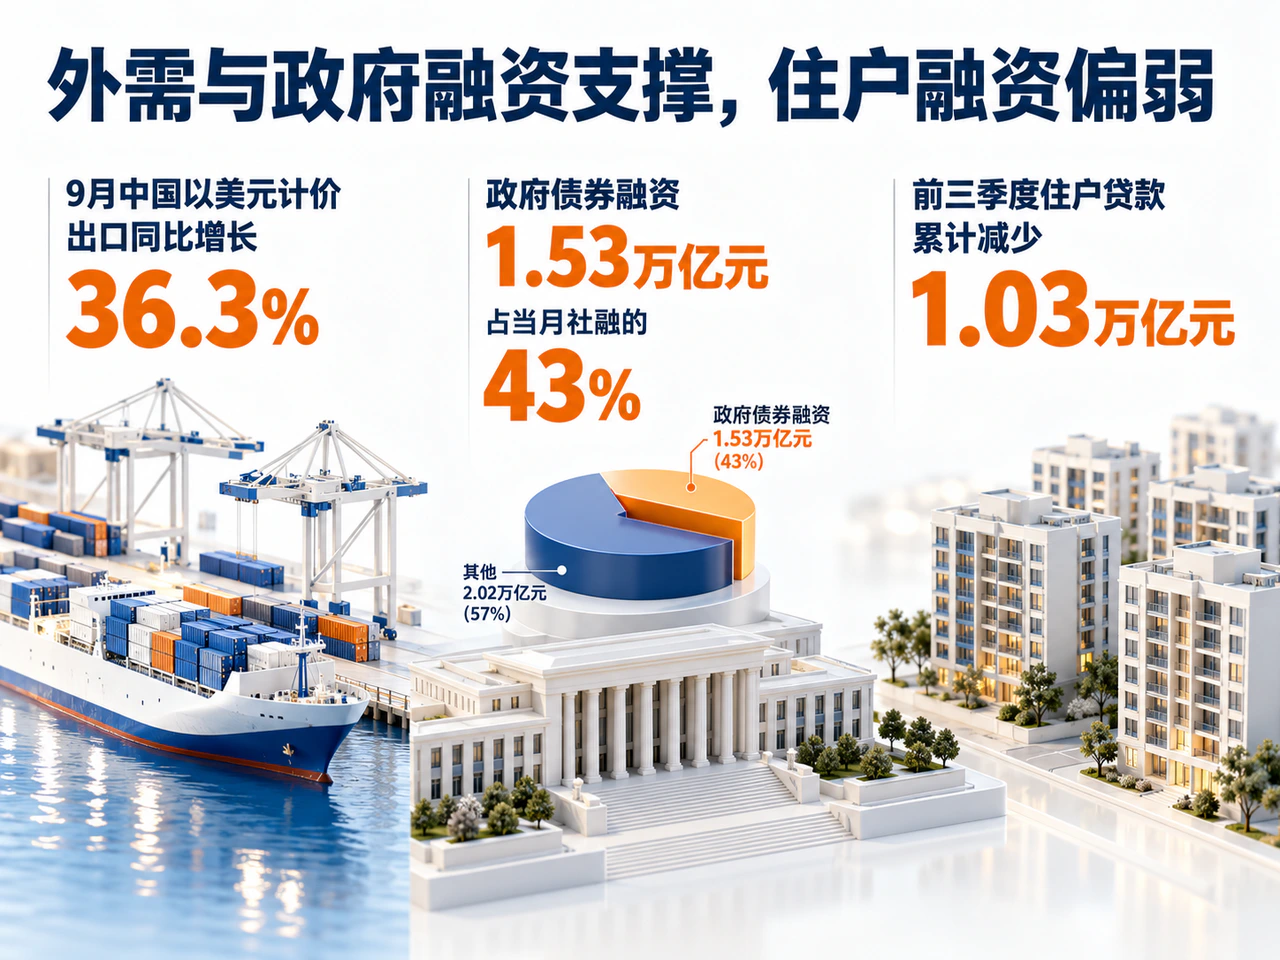
External demand continued providing strong support. The Associated Press, citing customs data, reported Chinese dollar-denominated exports up 36.3% year on year in September, imports up 31.0%, and a monthly trade surplus of approximately $133.5 billion. Over the first three quarters, export values for semiconductors, automatic data-processing equipment and components, and automobiles rose 108.1%, 54.6% and 54.3%, respectively. Growth driven by technology investment and vehicle exports also leaves these companies more sensitive to global industry cycles and overseas market-access conditions.
Changes in European vehicle-trade rules illustrated this external constraint. The Guardian reported that on October 12 the EU confirmed an annual quota of 350,000 Chinese hybrid-vehicle imports, planned to take effect in December for four years. Vehicles assembled within the EU would be exempt. Companies relying on direct exports of complete vehicles and those with local European production will consequently face different growth opportunities and adjustment costs.
Government bonds and direct financing supplied much of the increase in domestic funding. China's September aggregate financing to the real economy was RMB 3.55 trillion, of which government-bond financing accounted for RMB 1.53 trillion, or 43%. New renminbi loans totaled RMB 1.08 trillion, RMB 210 billion less than a year earlier, while household loans declined by a cumulative RMB 1.03 trillion in the first three quarters. Government funding can support project investment and corporate cash flow effectively. With household borrowing demand still weak, however, the efficiency with which fiscal support reaches consumption and private investment is particularly important.
Markets were awaiting China's third-quarter GDP and September activity data due on October 19 to assess actual improvements in consumption and investment and whether support from trade and government financing could broaden into corporate revenue. Looking back at last week's global markets, the divergence between long bonds and technology stocks points to the same core question: lower borrowing rates can ease valuation pressure, but sustainable growth pricing ultimately requires end demand, corporate profits and cash flow to deliver.


