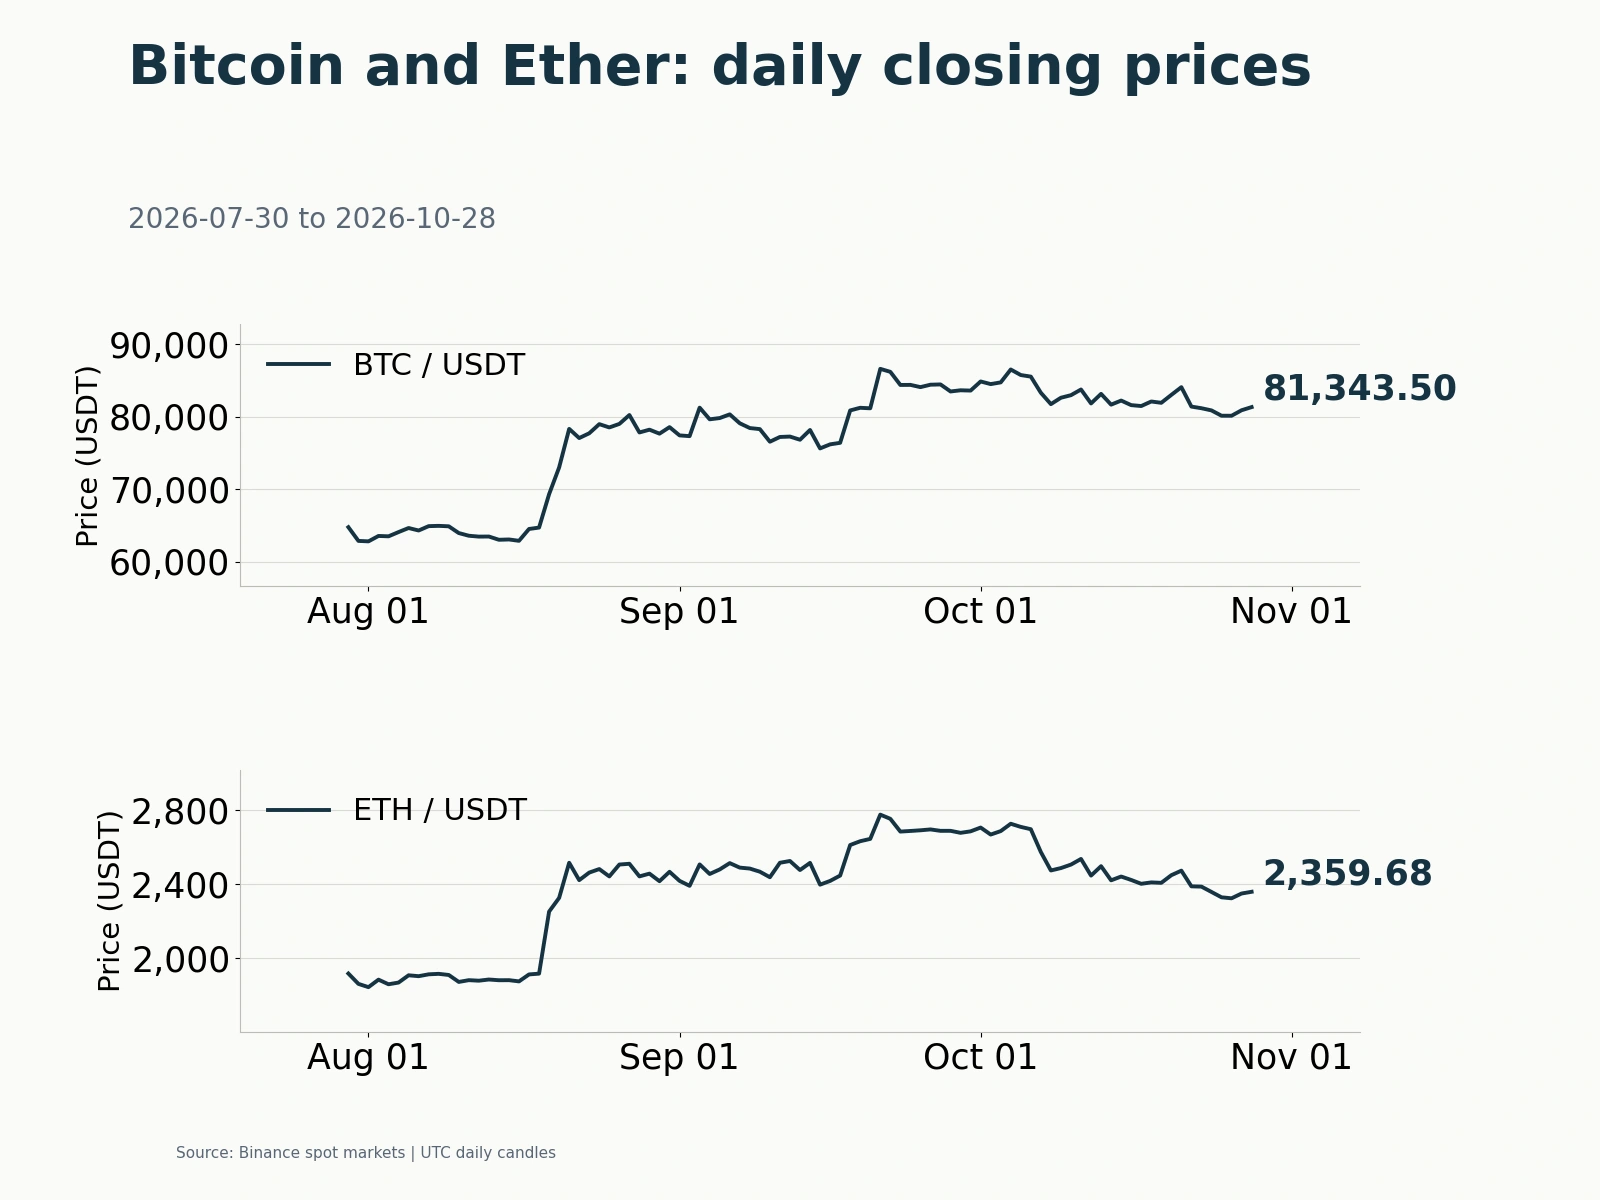
On October 19, the crypto market displayed a divergence: derivatives leverage began to rebuild while spot allocations continued to lag. On Binance's UTC daily spot candles, Bitcoin and Ethereum closed at 81,938.40 USDT and 2,408.01 USDT, respectively, at 08:00 Beijing time on October 20, each down less than 0.3% for the day. While spot prices traded in narrow ranges, perpetual open interest recovered markedly, but spot ETFs and dollar stablecoins had yet to provide corresponding new capital.
Weekly Spot ETF Outflows Narrow as Dollar Stablecoin Supply Falls $1.7 Billion

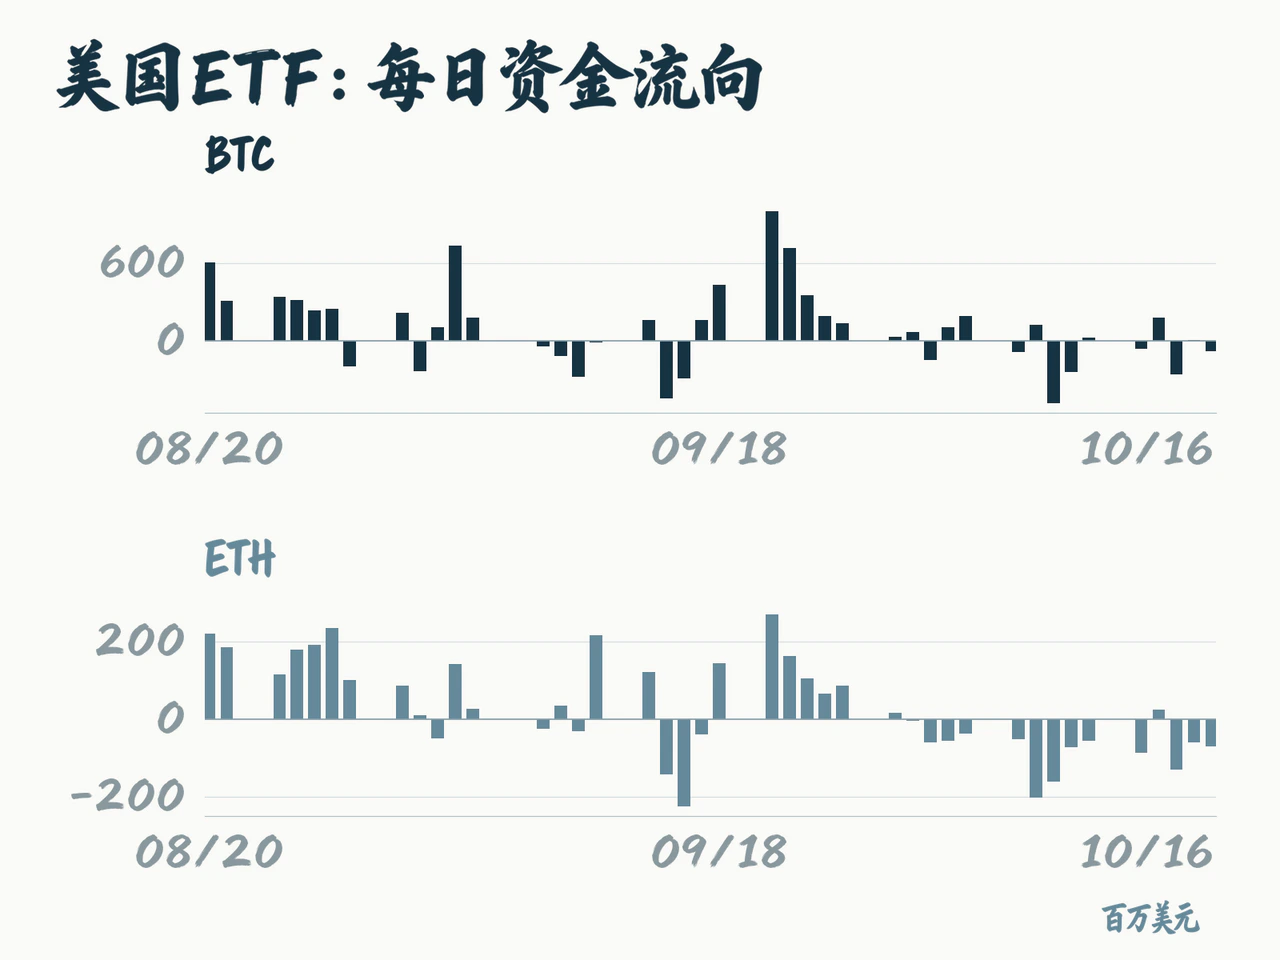
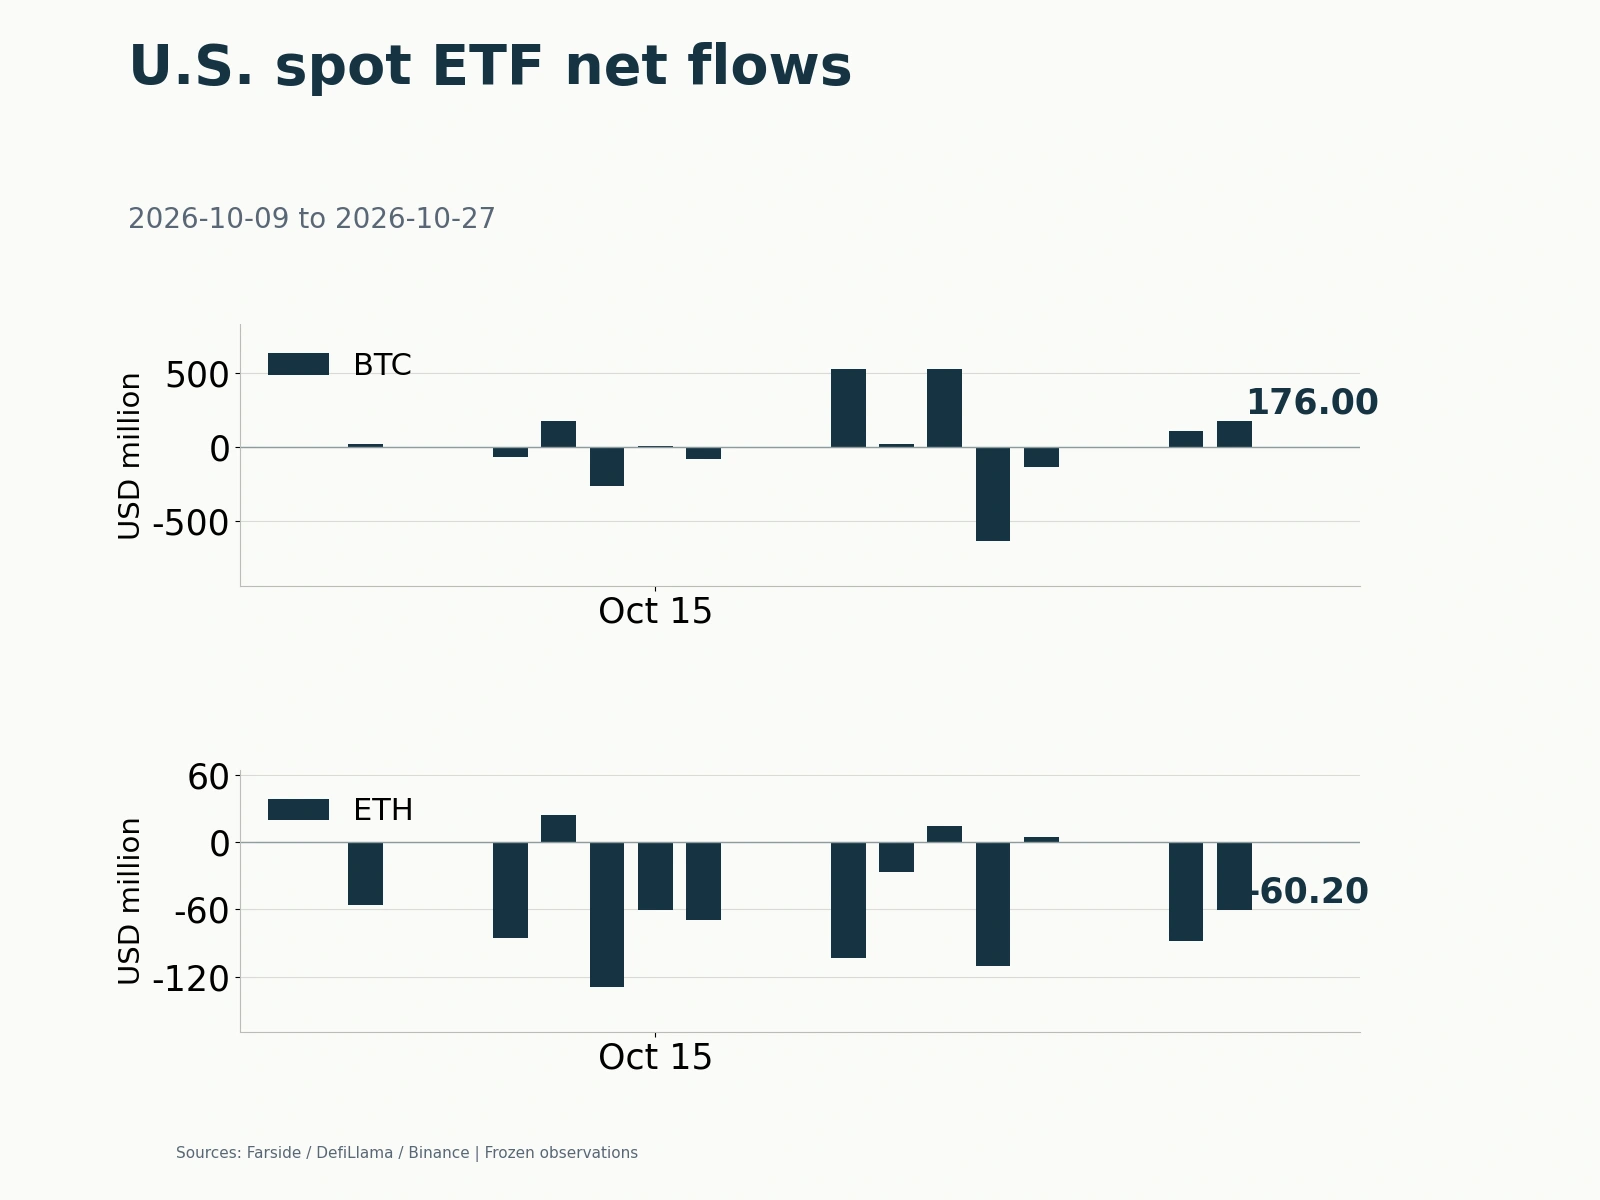
Investors allocating through traditional securities accounts remained cautious. According to Farside, in the latest full US equity trading week, October 12–16, spot Bitcoin ETFs recorded aggregate net outflows of $228.4 million and Ethereum-related ETFs $320.1 million. Although withdrawals narrowed substantially from the previous week's $678.9 million and $542.2 million, respectively, neither core asset's ETFs returned to weekly net subscriptions.
Among leading products, IBIT lost a net $165.4 million last week and ETHA $299.0 million; ETHA accounted for almost all of the Ethereum ETF category's redemptions. A few sessions saw net inflows, but these were insufficient to reverse the week's overall net redemptions. Genuine stabilization in allocations depends on leading products returning to sustained net subscriptions, rather than a temporary reduction in one day's outflows.
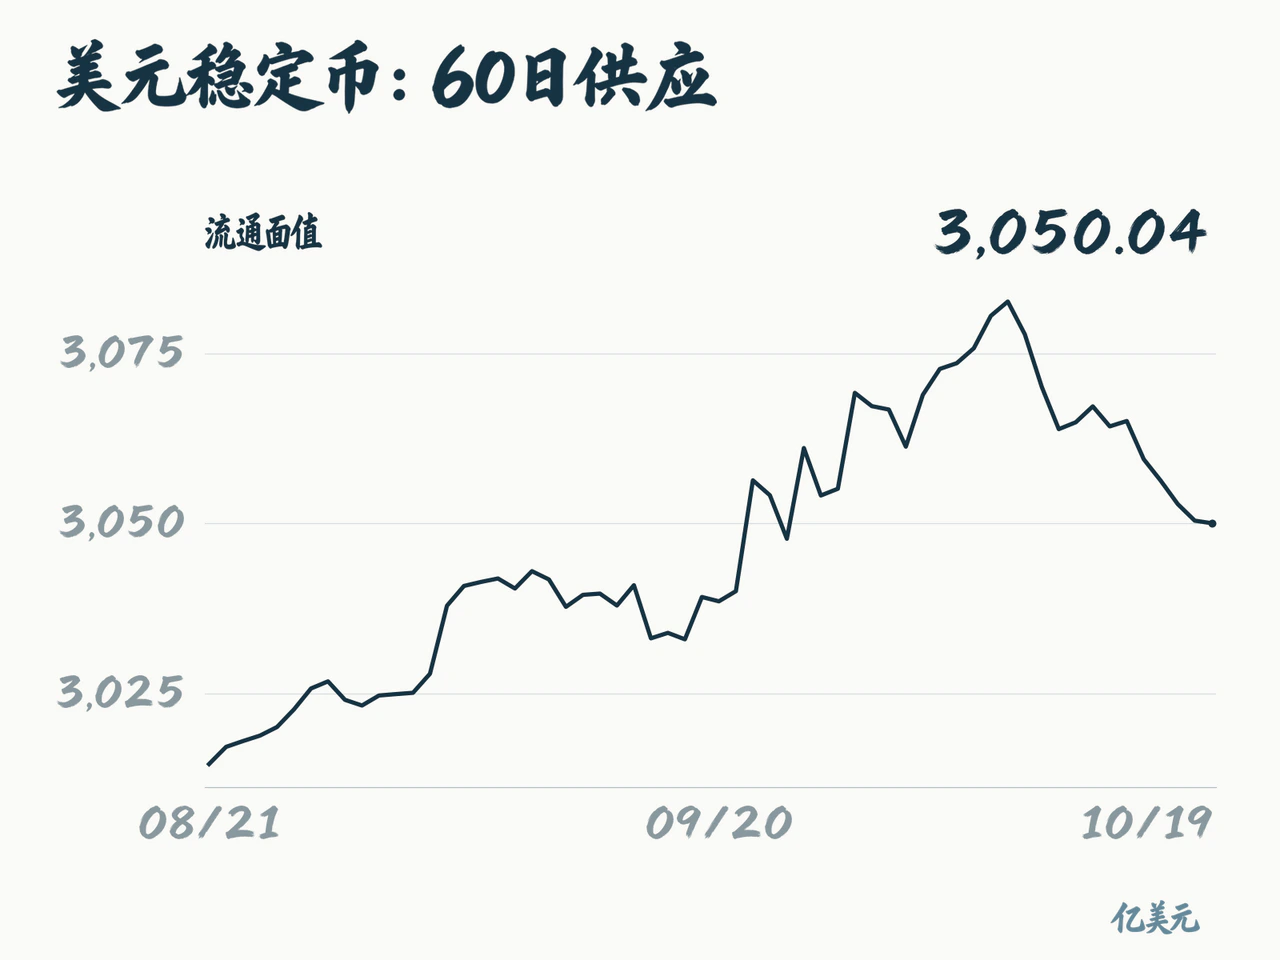
The on-chain dollar pool also showed no expansion. DefiLlama data put the circulating supply of dollar stablecoins at approximately $305.004 billion as of October 19, measured at circulating face value and including only dollar-pegged tokens already in circulation, excluding converted values of other fiat-pegged tokens and uncirculated inventory. Supply was down about $37.60 million from October 18 and $1.716 billion from October 12, a weekly decline of approximately 0.56%.
The slight contraction in circulation suggests that no reserve of incremental on-chain buying power has formed. Beyond trading settlement, stablecoins are widely used for payments, remittances and on-chain collateral, and the amount of capital retained is directly constrained by the traditional dollar interest-rate environment. A Bank for International Settlements (BIS) working paper released on October 13 and attracting market attention on October 19, using a sample from early 2019 to June 2025, found that stablecoin growth generally slowed after commercial banks raised deposit rates, with USDC substantially more sensitive to rate changes than USDT. This mechanism indicates that competition from yields on traditional dollar cash instruments continues to divert funds away from on-chain markets.
Taken together, ETF and stablecoin data suggest that the spot market remains a contest over existing capital, with institutional redemptions slowing and on-chain dollars shrinking slightly. Without accompanying expansion in spot allocations and on-chain funds, a recovery in contract trading alone is unlikely to build a firm foundation of buying demand.
Binance BTC Perpetual Open Interest Rises 2.05% in a Day as Options Demand for Downside Protection Persists
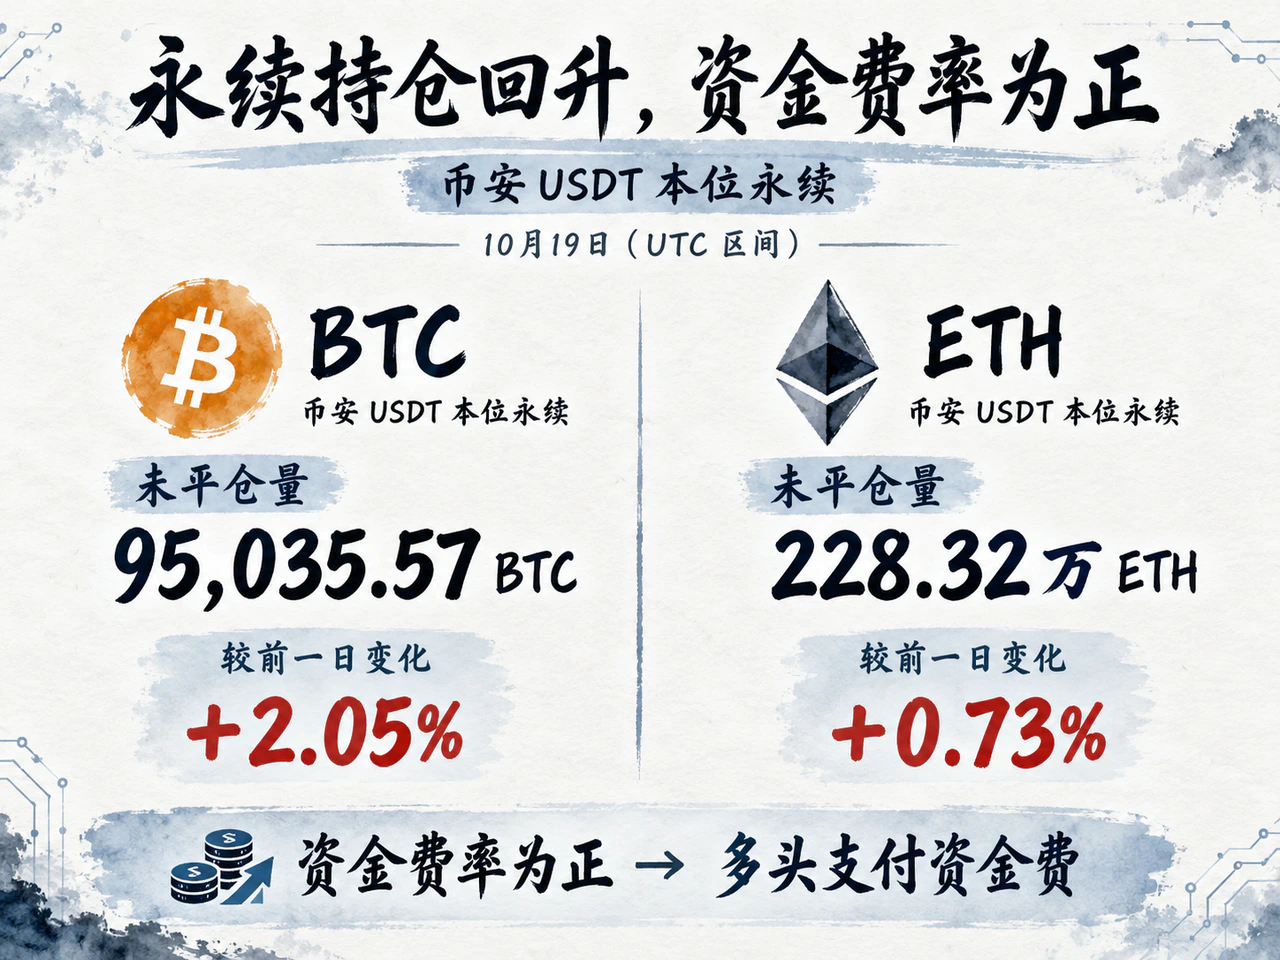
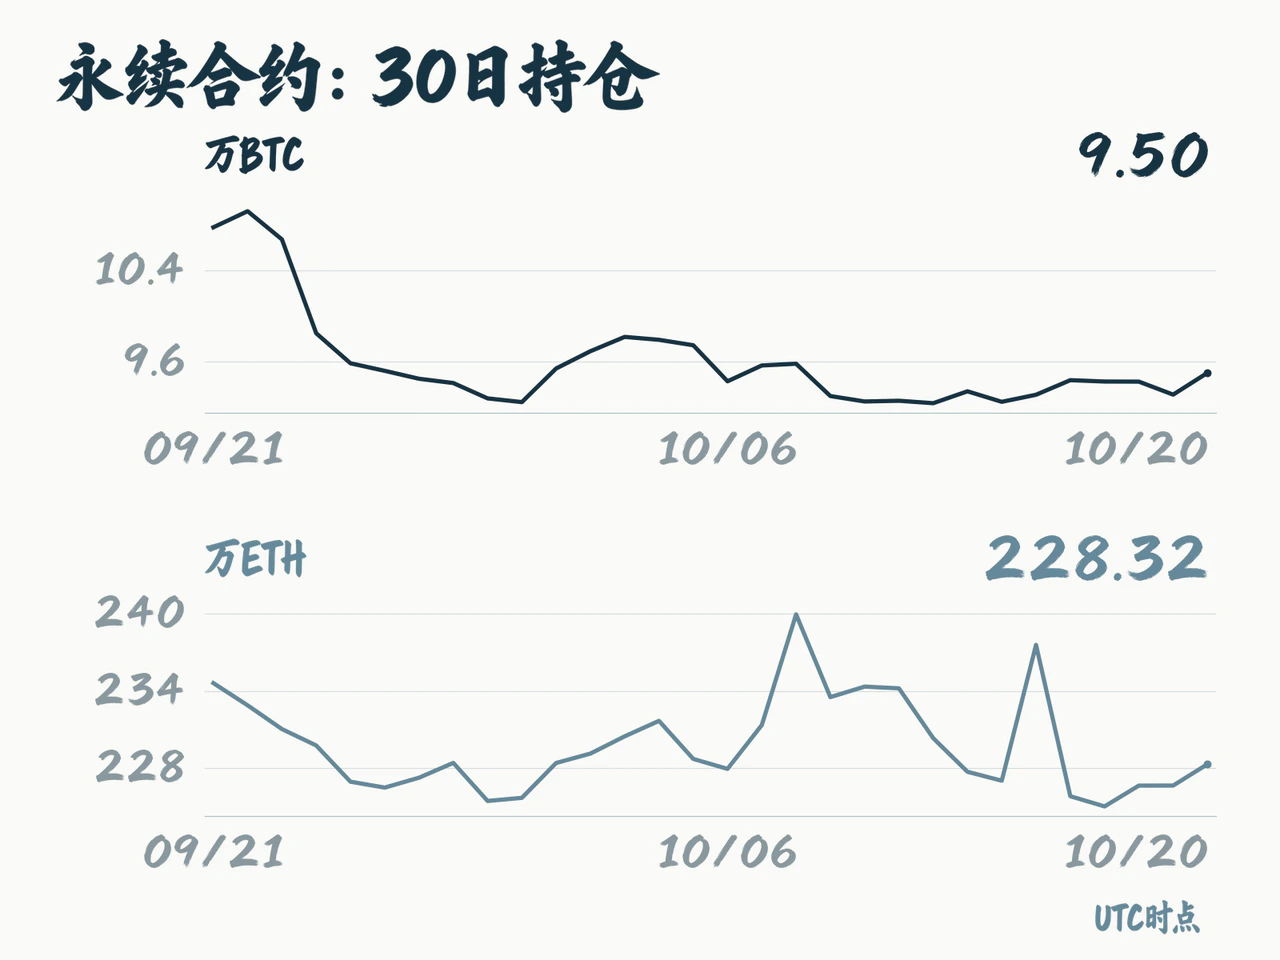
Derivatives were more active than the subdued spot market. From 00:00 UTC on October 19 to 00:00 UTC on October 20, open interest in Binance's USDT-margined BTC perpetuals rose from 93,130.50 BTC to 95,035.57 BTC, an increase of 2.05%, while the corresponding notional value climbed from 7.645 billion to 7.784 billion USDT. ETH perpetual open interest rose 0.73% to 2.2832 million ETH, with a notional value of approximately 5.496 billion USDT. With spot prices edging down, the increase in coin-denominated positions confirms an actual inflow of capital opening new positions, rather than a change in notional market value caused by price movements.
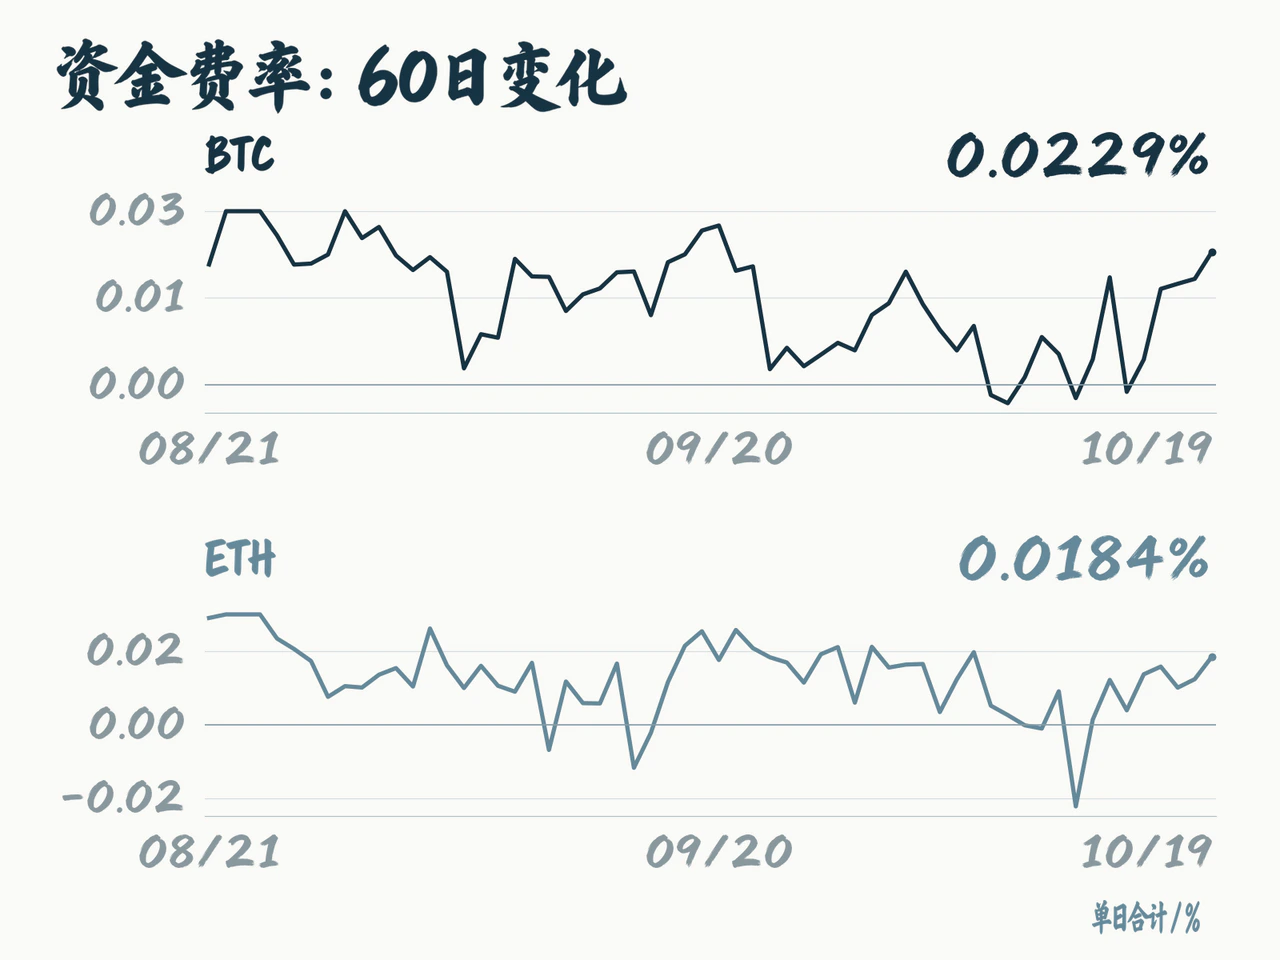
The recovery in open interest coincided with continued positive funding rates. At the day's three eight-hour settlement times, Binance BTC perpetual funding rates were 0.004958%, 0.010000% and 0.007964%, totaling 0.022922% for the day; ETH's cumulative daily rate was 0.018447%. Rising open interest and positive funding while spot prices trade sideways indicate that both longs and shorts are opening positions, with longs bearing the funding cost. If spot prices fail to break higher for an extended period, however, the staying power of these new positions will be tested.
Dated futures did not show aggressive premiums from investors chasing the rally. In the latest available snapshot, at 00:00 UTC on October 19, the annualized basis on Binance's current-quarter BTC contract was 5.42%, slightly wider than 5.18% on October 18. A moderate positive basis offers a spread for cash-and-carry trades that buy spot and sell futures, although actual returns remain constrained by financing, margin and trading costs. With spot ETF demand weak, some new derivatives positions are more likely to come from arbitrage and hedging capital locking in spreads, and do not yet provide sufficient evidence of a return in directional long allocations.
Liquidations and options pricing also retained defensive features. Citing CoinGlass figures at the time, Bitcoin.com reported on the afternoon of October 19 US Eastern time that market-wide liquidations totaled about $334 million, including approximately $173 million in long liquidations. BTC long and short liquidations were nearly balanced, while ETH short liquidations exceeded those on longs. Localized intraday rebounds therefore squeezed some shorts but did not develop into a market-wide, one-directional short squeeze. The report also relayed Glassnode's observation that options traders were still buying downside protection and that implied volatility remained above realized volatility.
Overall, leveraged capital has begun to re-enter tentatively, but demand to hedge downside tail risk has not faded. With this funding structure, whether prices can stabilize and rise depends on spot buying arriving in time to take over. If contract positions keep accumulating while ETF subscriptions and stablecoin supply remain weak, renewed price pressure could turn the additional leverage into selling pressure from long deleveraging.
Click Read Original for full details.