Partial U.S. relief from sanctions on Russia led the market to price in the possibility of more fuel supply, nudging deferred crude contracts lower on October 19. The nearly expiring prompt WTI contract rose against that trend, however, as disrupted Gulf shipping and low inventories continued to support immediate-delivery prices. Expectations of additional supply from the policy adjustment had reached deferred prices first; the extent of any further decline depends on the recovery of physical supply and delivery.
December contracts edge lower; November WTI commands a $5.12 premium to December
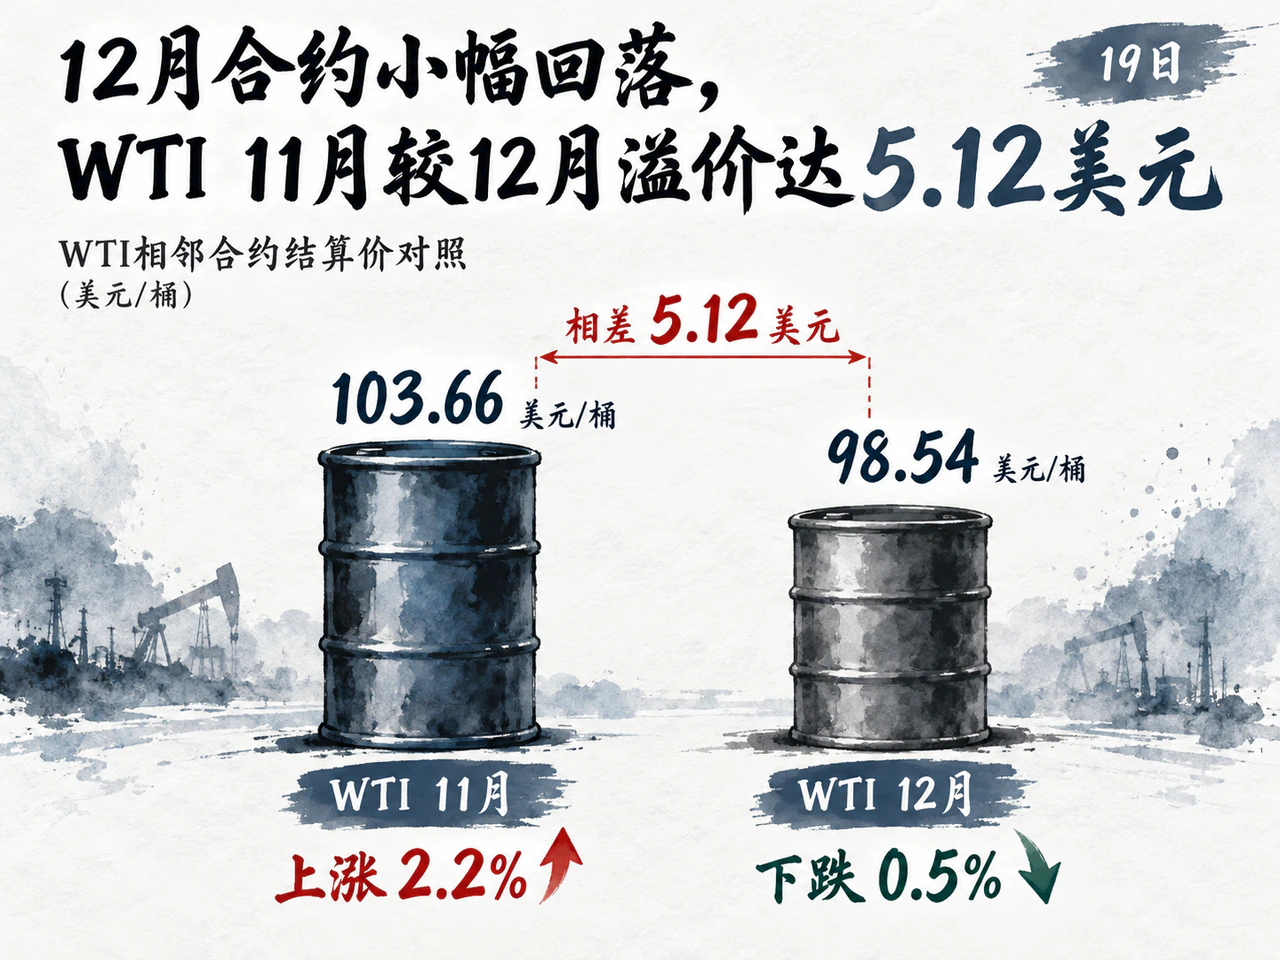
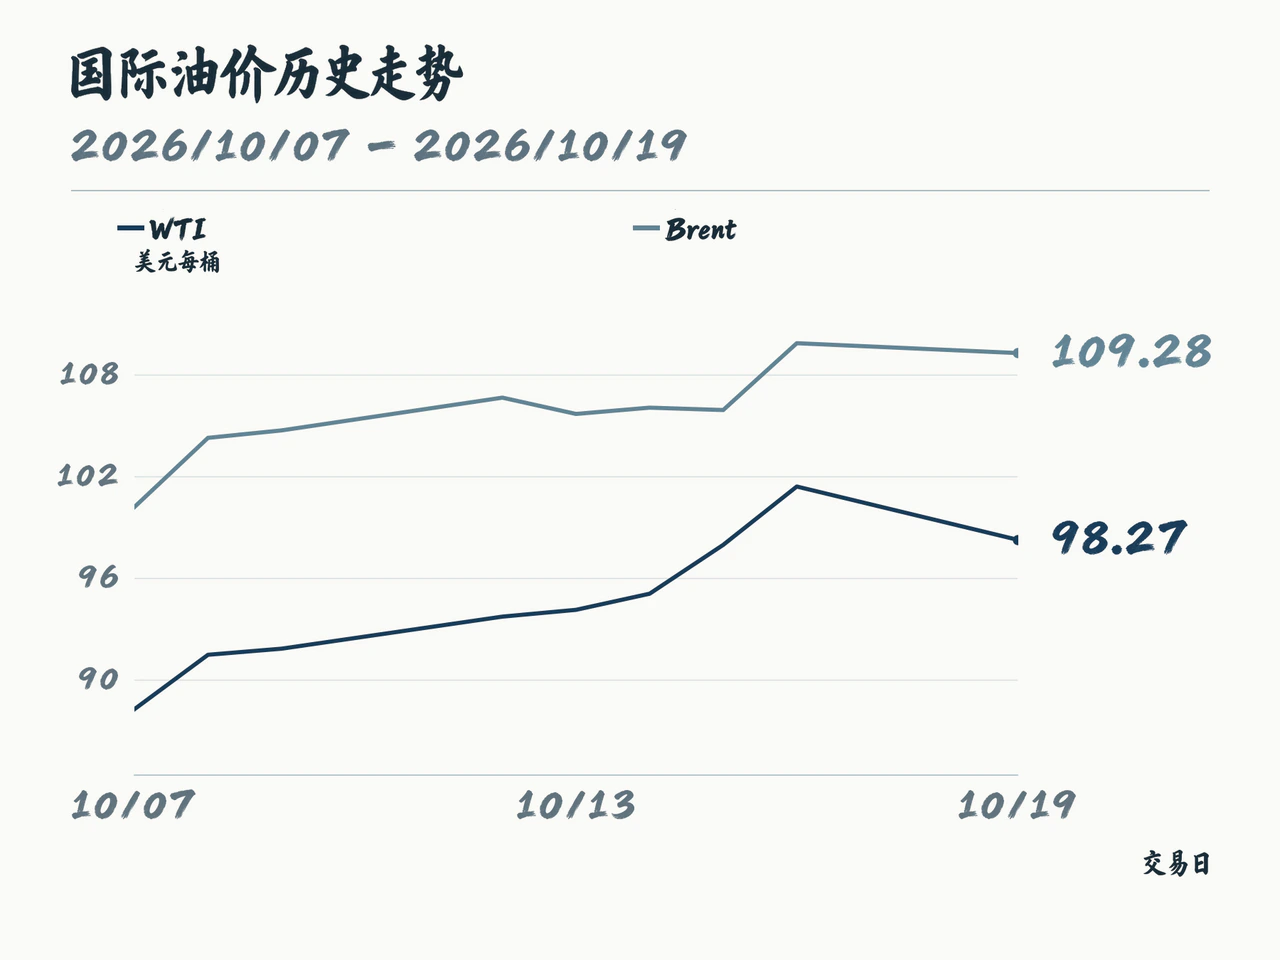
According to The Wall Street Journal's reporting available by the morning of October 20 Beijing time, December Brent settled on October 19 at $109.55 a barrel, down 0.3%, and December WTI settled at $98.54, down 0.5%. November WTI, due to expire on October 20, instead rose 2.2% in thin trading to settle at $103.66.
The divergence between adjacent contracts left November WTI at a settlement premium of $5.12 a barrel to December, a backwardated structure in which prompt oil costs more than deferred supply. While approaching expiry can amplify front-month volatility, the divergence shows different pricing for immediate delivery and future supply: expectations of replenishment lowered deferred prices, while prompt supply retained a large risk premium.
The continuous-contract roll further exaggerated the apparent decline. Vendor data showed October 19 WTI continuous futures closing at $98.27 a barrel, down 3.10% from October 16, while Brent continuous futures closed at $109.28, down 0.53%. Because continuous quotes are affected by the switch between delivery months, these declines do not represent settlement changes in the same contract month or imply an equivalent amount of actual WTI selling.
Russian sanctions waivers face refining constraints; weekly Hormuz flows remain 41% below prewar levels

The Wall Street Journal reported that Trump signed an executive order on October 16 waiving some sanctions and tariffs on Russia under a new law, without lifting all existing sanctions. The market consequently expected looser restrictions on Russian energy trade and more fuel entering international markets. ANZ attributed part of October 19's price decline to a technical correction after earlier gains, while judging that geopolitical risks would continue to limit the downside.
Although waivers improve trading conditions, actual supply responsiveness still depends on refining and shipping capacity. The International Energy Agency's October report said the practical constraint on Russian diesel exports was insufficient operable refining capacity, so relaxing export restrictions might do little to improve the global diesel balance. Tight diesel supply directly affects refining margins, which in turn influence how much refiners will bid for available crude.
Gulf shipping's recovery remained uneven. The Wall Street Journal cited Kpler data showing confirmed oil flows through the Strait of Hormuz averaging 10.17 million barrels a day in the seven days through October 17, about 41% below prewar levels. Including Gulf of Oman terminals and Red Sea exports, related flows totaled 19.04 million barrels a day, still about 19% below prewar levels. The report also cited UK Maritime Trade Operations information that a tugboat near the UAE was attacked on October 18, following attacks on two tankers near Saudi Arabia on October 16. Attack risks, freight rates and insurance costs together raised delivery costs, so a recovery in upstream production might not translate simultaneously into buyers' usable inventories.
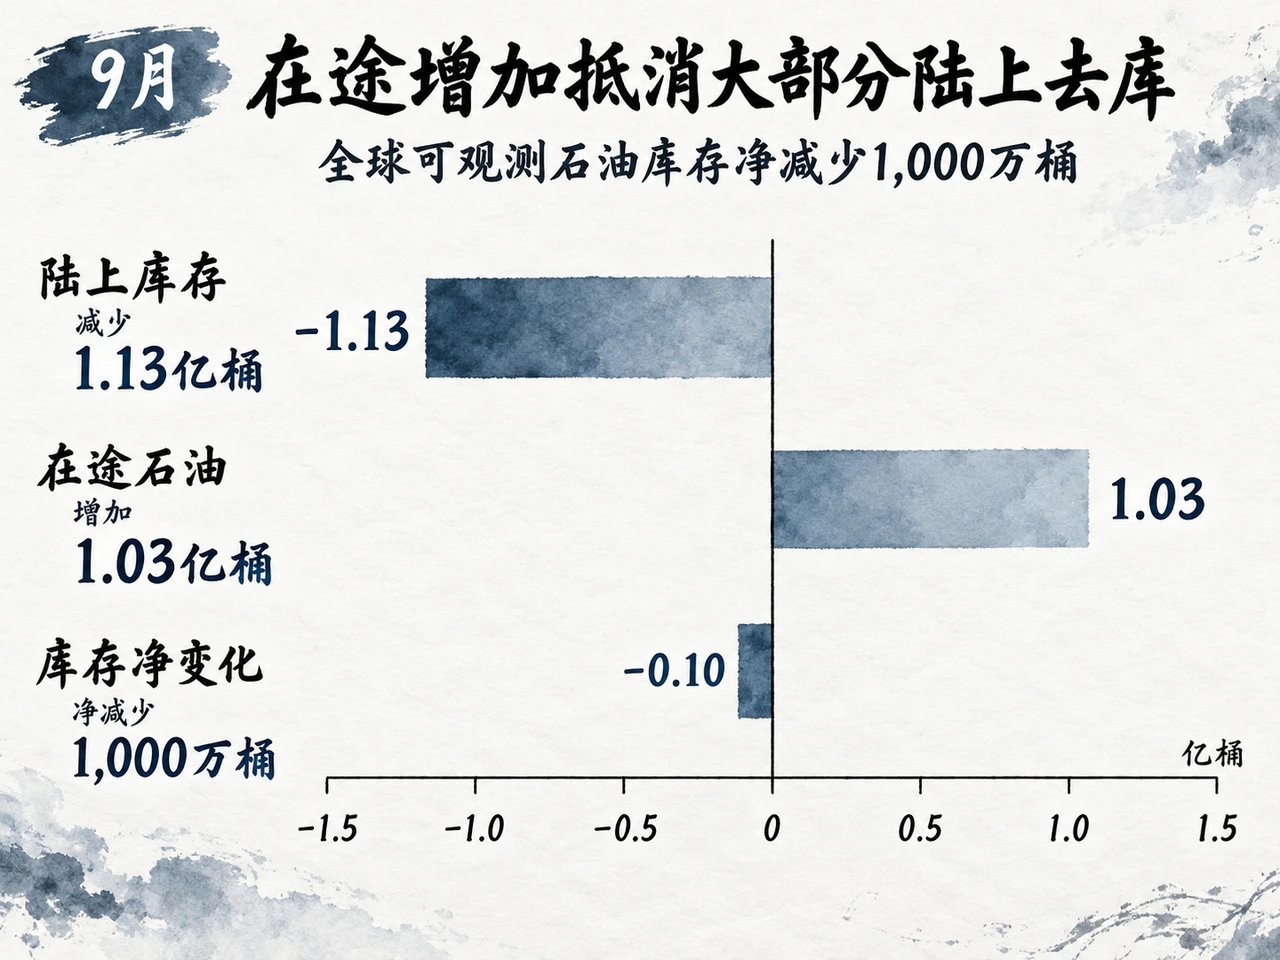
September onshore stocks fall 113 million barrels; high prices expected to cut annual demand by 2.6 million barrels a day
Aggregate supply showed material upstream recovery. The IEA's report published October 14 showed global oil supply rising by 2.5 million barrels a day in September to 102.3 million barrels a day. Crude exports from Gulf producers recovered to 13.9 million barrels a day.
The composition of inventories, however, showed a significant lag before supply reached consumers. Global observed oil stocks fell by a net 10 million barrels in September: onshore inventories dropped by 113 million barrels while oil in transit rose by 103 million barrels, offsetting most of the land-based draw. More crude loaded onto ships does not mean it has reached refineries and consumer markets. The concentration of inventories at sea instead makes spot prices more sensitive to transport interruptions.
Meanwhile, high oil prices were suppressing demand. The IEA projected that global oil demand would fall by 2.6 million barrels a day year on year in 2026, with a fourth-quarter decline of 2.5 million barrels a day, but judged that the supply deficit would persist through year-end. Weaker demand weighs on deferred prices, while thin onshore stocks and disrupted delivery support prompt prices, explaining the current strength at the front of the oil curve relative to later maturities.
A firmer basis for lower oil prices depends on four changes: whether actual Russian diesel exports and refinery operations recover to fulfill the supply expectations created by sanctions waivers; whether Hormuz and alternative-route shipments and freight rates improve durably, reducing delivery risk; whether onshore crude and distillate inventories stop falling, materially easing physical tightness; and whether WTI's calendar spread narrows after the roll, revealing how much of the current prompt premium comes from expiry effects. Further declines will have a solid foundation only if higher shipment volumes, lower freight rates and inventory rebuilding materialize together.


