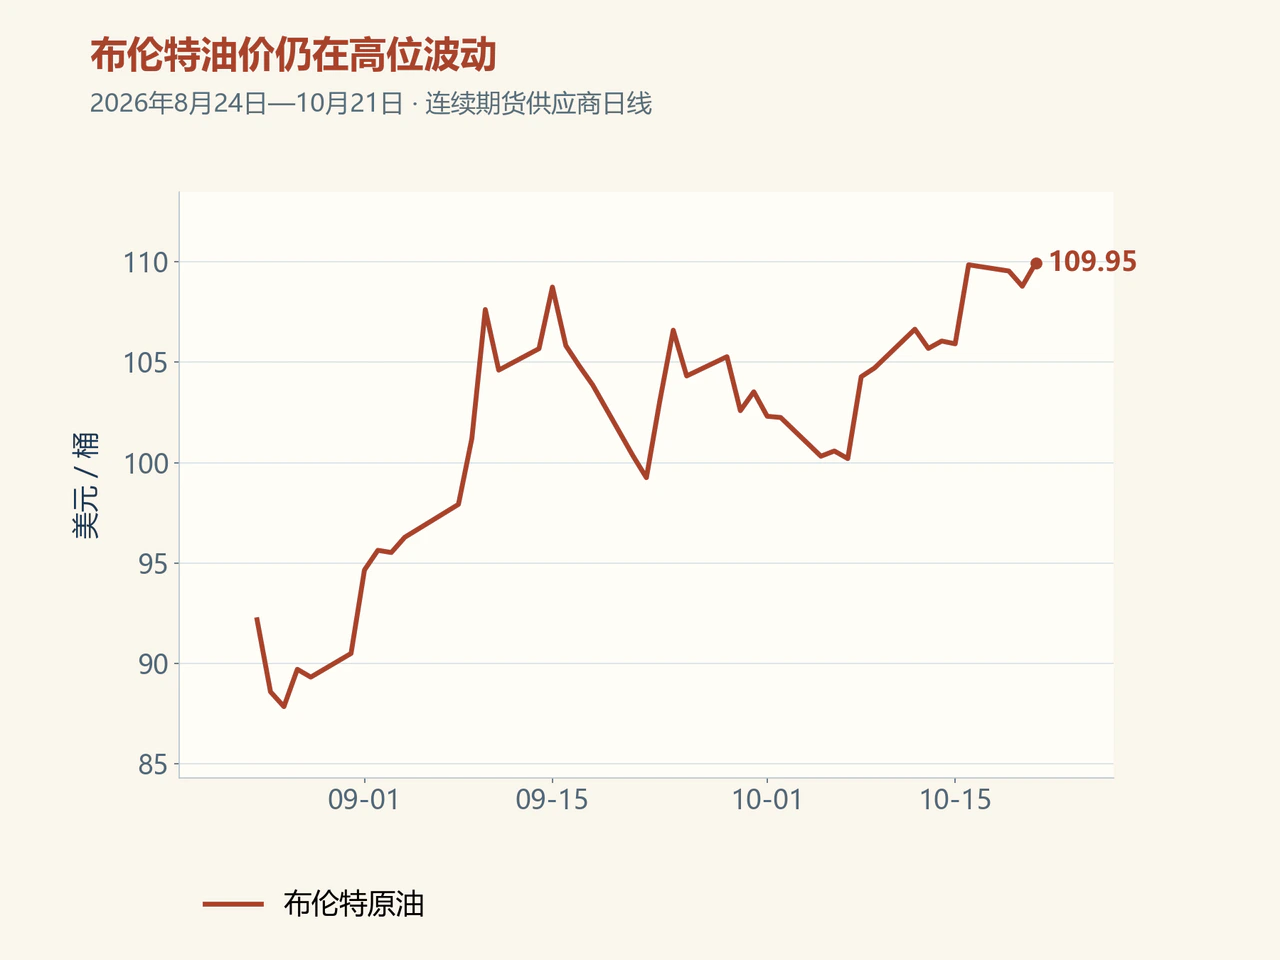
Oil rose and then retreated on October 21. Falling US inventories and increased Middle Eastern shipping risks drove early gains before hopes of diplomatic progress and resilient regional exports capped the advance. Reuters reported Brent futures settling at $108.82 a barrel, up just $0.03 on the day. December WTI settled at $97.15, down $0.67, or approximately 0.7%.
Yahoo's daily quotations use a different basis: continuous Brent stood at $109.95, up 1.07%, and December WTI at $97.92, up 0.10%; these should be considered separately from the settlements above. By the morning of October 22, Beijing time, the oil-market tug-of-war still centered on physical supply. Transport risks remained elevated, but alternative routes and ship-to-ship transfers continued bringing crude to market, preventing disruption fears from translating into sustained price gains.
US crude stocks fall 14.803 million barrels in three weeks; gasoline and distillates diverge

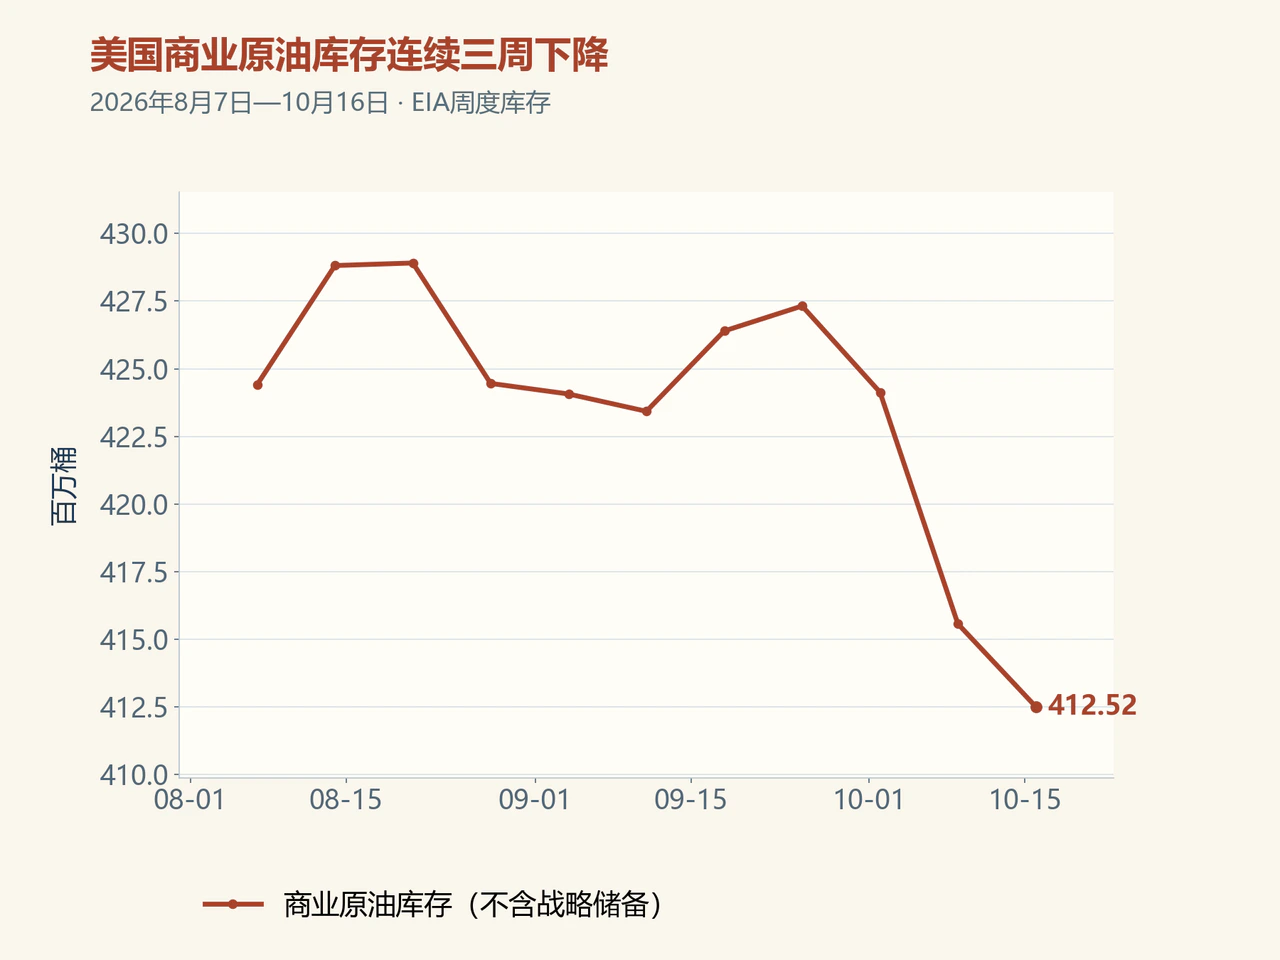
The US Energy Information Administration (EIA) reported on October 21 that commercial crude stocks fell 3.06 million barrels in the week ended October 16 to 412.517 million barrels. Draws of 3.186 million and 8.557 million barrels in the preceding two weeks brought the three-week decline to 14.803 million barrels. Persistent draws reduce the inventory cushion against further supply shocks and support oil prices.
During the same week, gasoline stocks fell 2.95 million barrels to 205.3 million, while distillate stocks rose 1.68 million to 104.3 million and Cushing crude stocks increased 987,000 barrels. Crude runs rose 34,000 barrels per day and refinery utilization reached 93.4%. Commercial crude inventories continued falling despite an 837,000-barrel-per-day increase in net crude imports, indicating that that week's supply had not reversed the drawdown.
Product-market changes were less balanced. According to the EIA report summary, four-week gasoline product supplied rose 1.5% year on year, while distillates fell 2.4%. Gasoline draws and rising diesel-type stocks reflect differences in production and end demand. Continued distillate builds and increased refinery supply would weaken the support that product tightness gives crude. Continued simultaneous draws in crude and gasoline would preserve fundamental support for nearby prices.
Vessel-attack risks spread to the Gulf of Oman; alternative routes still support exports

Reuters, citing LSEG analysis, reported that vessel-attack risks had spread to the Gulf of Oman, affecting loading and ship-to-ship transfers outside the Strait of Hormuz. Transfers had been an important way of maintaining Middle Eastern exports; the outward spread of risk also tests the stability of those arrangements.
Regional exports nevertheless remained resilient. On October 21, The National cited preliminary Kpler data showing Middle Eastern oil flows excluding Iran above 24.5 million barrels per day in the week ended October 18, slightly higher than 24.4 million in the week of February 22. This measure combines Hormuz transit, net ship-to-ship exports in the Gulf of Oman, loadings at Fujairah and Omani ports, and Red Sea exports. Multiple alternative routes jointly supported regional supply.
Whether that weekly rebound persists still depends on transport stability. Bloomberg reported the same day that concentrated convoy movements caused substantial weekly shipment volatility, while the October-to-date average remained below prewar levels. Another shipping-data provider, Vortexa, did not show a comparable one-week jump. Consecutive weeks of deliveries therefore reveal supply recovery better than a single concentrated release. Resilient exports ease immediate shortage expectations, while uncertain shipping safety keeps the risk premium from fading.
Inventories and deliveries determine nearby support; diplomatic hopes discourage chasing gains
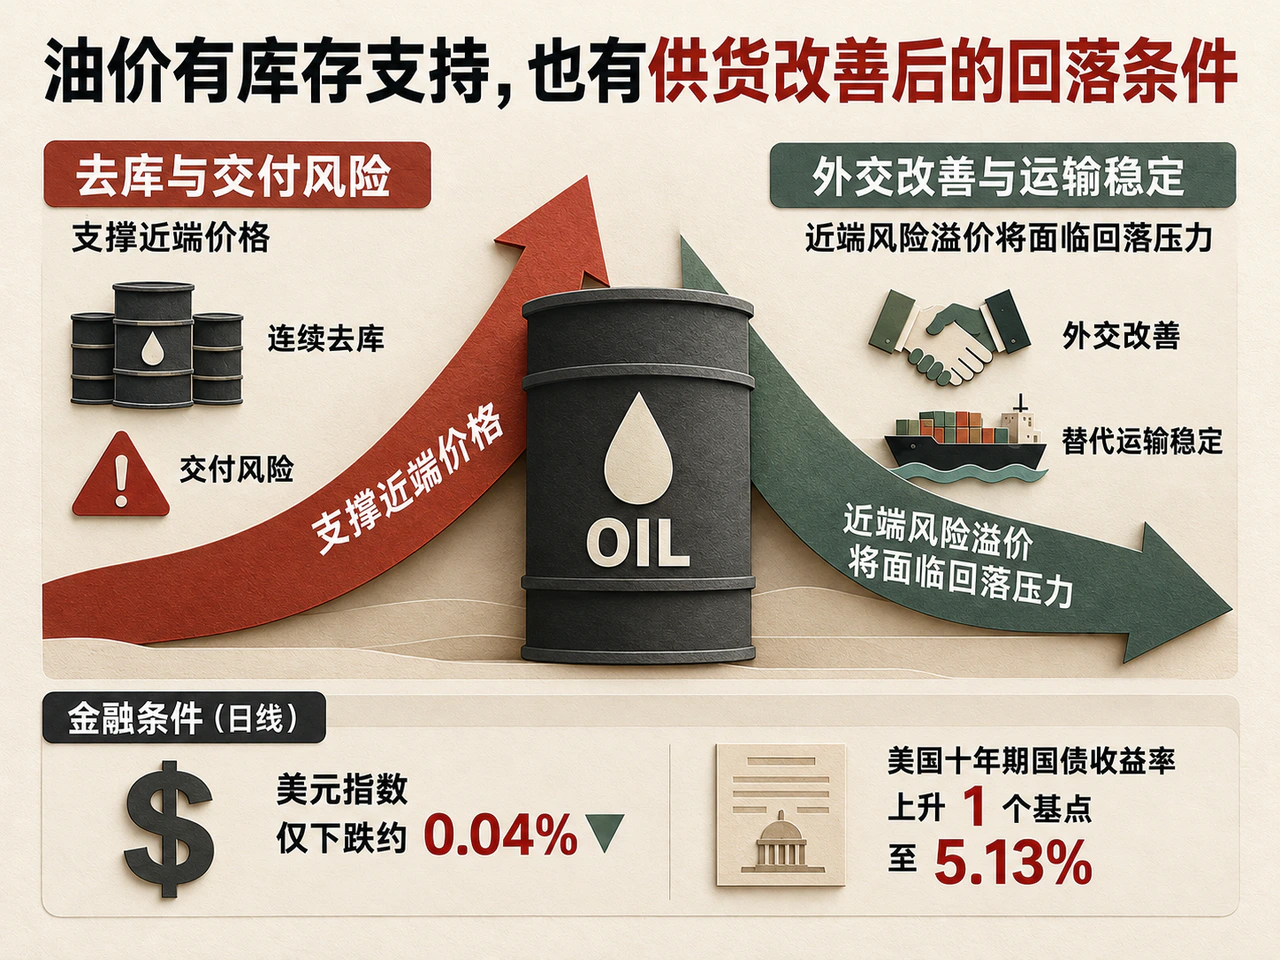
On October 4, seven OPEC+ countries decided to maintain September's required production levels through November; their next meeting is scheduled for November 1. Near-term supply changes depend more directly on whether existing capacity can be loaded successfully and transport routes remain open. Reuters linked oil's retreat on October 21 to hopes of progress in Russia-Ukraine talks: markets adjusted expectations of future relief from supply restrictions as diplomatic news changed.
Financial conditions changed only modestly. The daily dollar index fell approximately 0.04%, while the US 10-year Treasury yield rose 1 basis point to 5.13%. Monetary conditions supplied no strong easing impulse; inventories and transport news drove most of the day's oil-price moves.
The premium of nearby over deferred contracts is an important window on immediate supply pressure. Repeated draws and delivery risks support nearby prices, while diplomatic improvements and stable alternative transport can lower that premium. Whether crude and gasoline keep drawing, Cushing and distillates keep building, and regional exports recover steadily on a multiweek average will jointly determine changes in supply-demand pressure. Calendar spreads show how the market prices actual deliveries. Continued inventory declines and uneven export recovery would strengthen support at elevated prices; simultaneous transport recovery and inventory rebuilding would put downward pressure on the nearby risk premium.


