On October 22, 2026, global markets underwent another adjustment centered on financing costs and investment returns. U.S. technology heavyweights fell sharply, sending the Nasdaq 100 down 2.90%, while the 10-year Treasury yield retreated to 4.96%. Oil prices rose, but gold continued to weaken. Safe-haven flows into government bonds failed to dispel investors' concerns about technology companies' capital requirements and energy costs.
By the morning of October 23, Beijing time, U.S. economic data remained resilient, while earnings in some traditional industries also supported share prices. The market adjustment was concentrated in companies requiring enormous investment with returns far in the future, and in countries facing tighter fiscal constraints. Continued access to funding and the timing of cash returns became important explanations for diverging asset performance.
Nasdaq falls 2.90% as financing pressures on AI investment return to focus
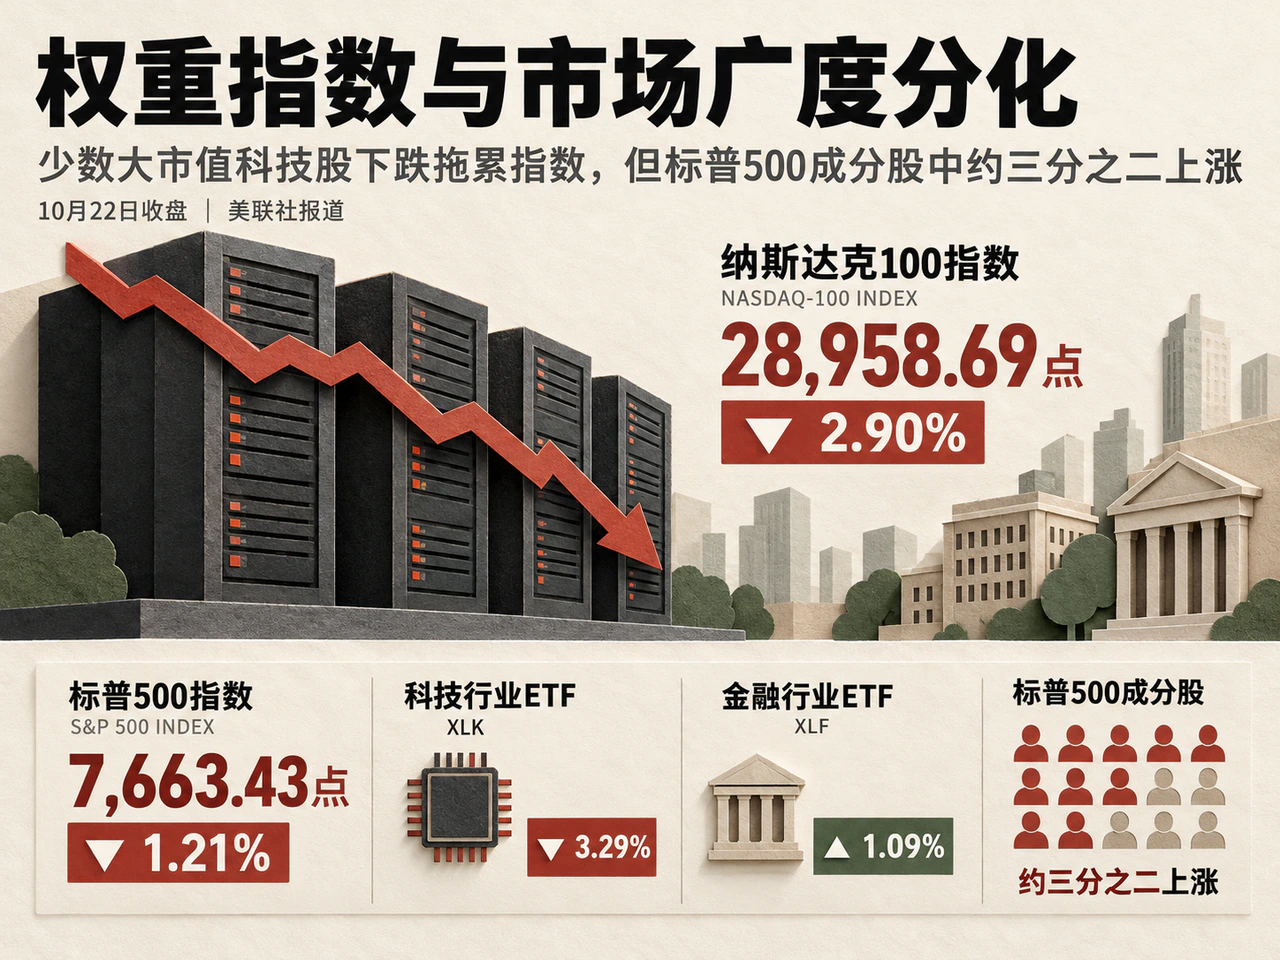
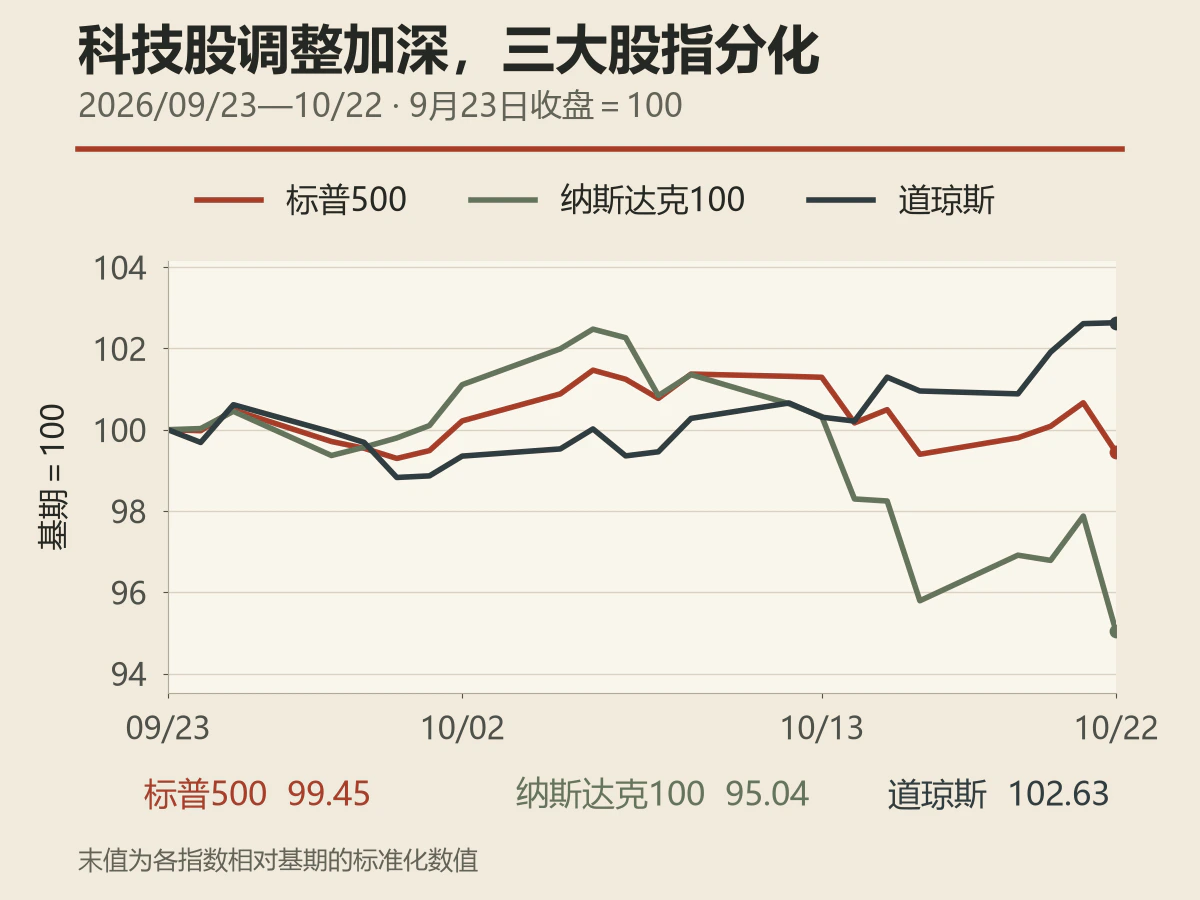
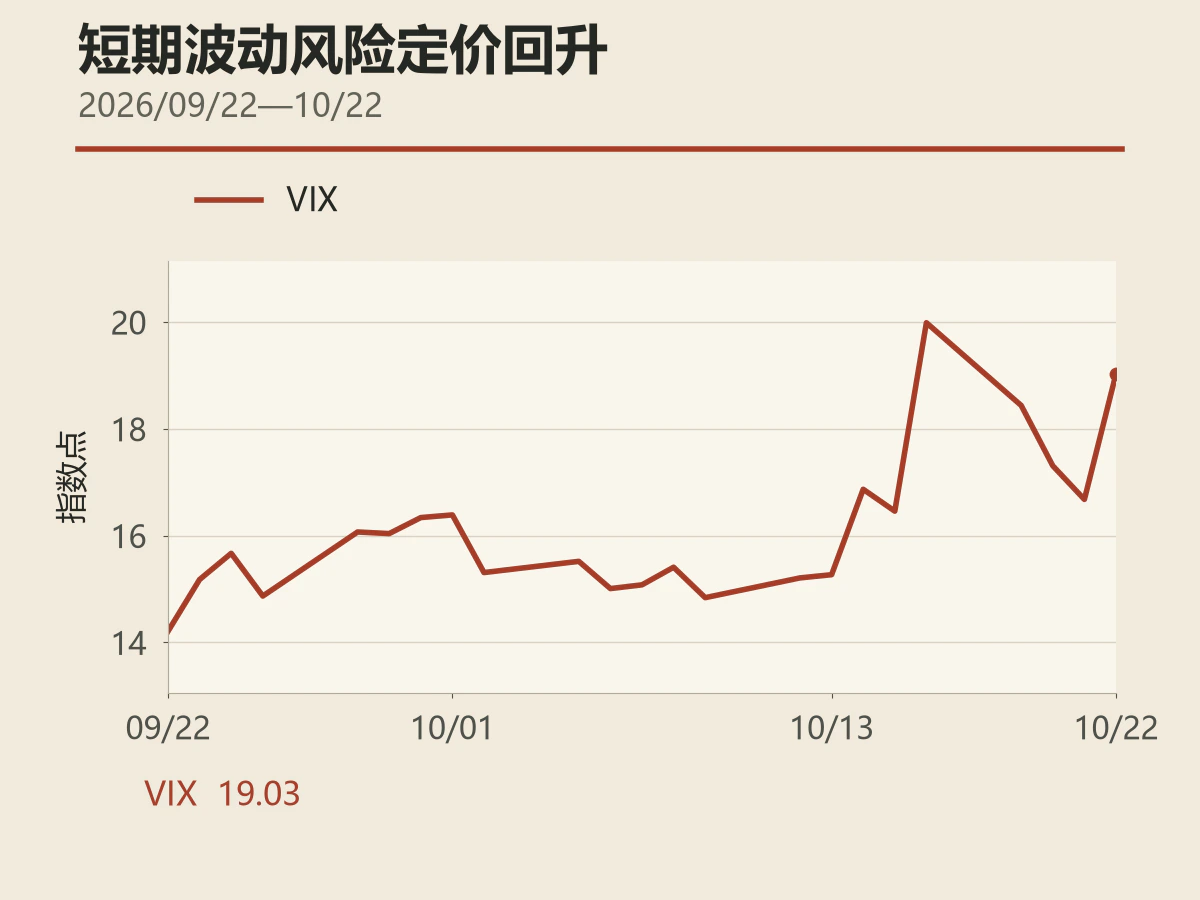
On October 22, the S&P 500 closed at 7,663.43, down 1.21%; the Nasdaq 100 finished at 28,958.69, down 2.90%; and the Dow Jones Industrial Average edged up 0.02% to 52,867.98. Technology-sector ETF XLK fell 3.29%, while financial-sector ETF XLF gained 1.09%. The VIX rose 2.35 points, from 16.68 to 19.03, signaling growing concern about near-term volatility.
The index decline obscured gains in most stocks. According to the Associated Press's closing report, about two-thirds of S&P 500 constituents advanced, but losses in a handful of large technology companies weighed on the index. Nvidia fell 4.4%, CoreWeave 10.1%, Lam Research 11.8%, and Meta 6.98%. The selloff also spread to AI power infrastructure, with GE Vernova, Bloom Energy and Vistra each dropping more than 10%.
Meta's quarterly revenue grew and exceeded expectations, but investors were more concerned about how much funding its future AI investment would require. The Associated Press reported that the company planned to create a new class of shares to finance AI investment and other spending. CNBC cited Wells Fargo traders as saying that Meta's description of its enormous funding needs, together with Nvidia CEO Jensen Huang's comments about capital scarcity among emerging cloud-computing companies, had revived concerns about whether credit markets could absorb the associated risks.
CoreWeave, which relies on borrowing to buy GPUs and then rents computing capacity to customers, occupies a crucial position in this financing chain. CNBC reported that its bond yields and credit default swaps remained elevated. Computing projects require large upfront capital outlays, while revenue and cash returns materialize gradually thereafter. If financing tightens, procurement, construction and profitability timetables may all be affected. Strong demand for computing capacity still requires sufficient funding to translate into actual investment.
Earnings season also prompted investors to examine the quality of growth. IBM beat quarterly expectations and raised its full-year free-cash-flow forecast, but maintained its outlook for 2026 revenue growth of 4%-5%. According to Yahoo Finance's coverage of the earnings call, IBM's software revenue grew 9%, with roughly one-quarter of that increase coming from previously delayed deals completed during the quarter. Management also said large companies were scrutinizing the actual returns on AI spending more closely. Tesla reported third-quarter adjusted earnings of $0.48 per share and lowered its 2026 capital spending, but expected spending on several new projects to rise in 2027-2028. Its shares closed down 3.08%.
Nontechnology companies performed relatively well. Procter & Gamble's quarterly earnings beat expectations, lifting its shares 5.6%. Blackstone's third-quarter distributable earnings fell 9% year on year, but management expected investment exits to improve in the fourth quarter and reiterated that base management fees could achieve double-digit growth in 2027. Its shares rose 8.38%. Realized earnings, cash recoveries and the outlook for fee income continued to support share prices.
The 10-year Treasury yield falls to 4.96%, but credit costs remain elevated

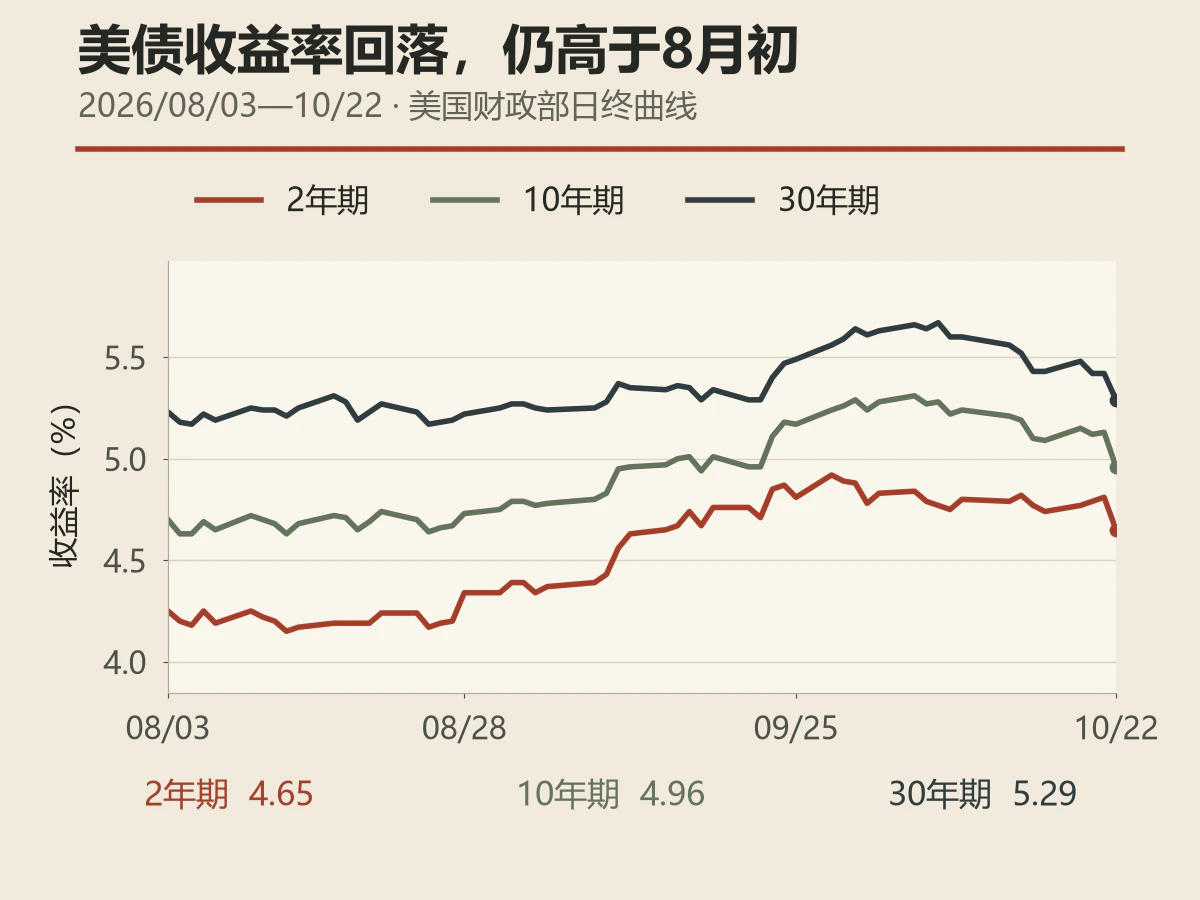
The U.S. Treasury's consistently measured end-of-day curve put the 2-year yield at 4.65%, down 16 basis points from the previous trading day; the 5-year at 4.78%, down 17 basis points; the 10-year at 4.96%, down 17 basis points; and the 30-year at 5.29%, down 13 basis points. The 10-year/2-year spread narrowed from 32 to 31 basis points, with intermediate yields falling slightly more than those at the ultra-long end.
Reuters' premarket commentary said rising oil prices, a widening French bond risk premium and worries about returns on technology investment were encouraging investors to reduce risk exposure: equity futures fell as Treasury yields retreated. Convera's research that day likewise argued that defensive allocation driven by the technology selloff offset the impact of earlier strong inflation and activity data. The decline in short-term yields reflected safe-haven allocation and a reassessment of the near-term policy path, while intermediate and long maturities also benefited from demand for safe assets.
The rally reversed some of Treasuries' earlier losses. The 10-year yield had risen from 4.70% on August 3 to 5.29% on September 30 and was still 5.13% on October 21. Although it moved back below 5% on October 22, it remained 26 basis points above early August. The 2-year yield was also 40 basis points above its August 3 level, leaving benchmark dollar financing costs relatively high.
That same day, the U.S. Treasury auctioned $26 billion of 5-year Treasury inflation-protected securities at a real yield of 2.367%, with a 2.25% coupon and a bid-to-cover ratio of 2.41. Investors continued to demand returns significantly above inflation. With the energy shock persisting, safe-haven purchases of nominal Treasuries coexisted with demand for inflation protection.
Corporate borrowers must also pay a credit premium. Reviewing the preceding trading session in its October 22 Asian morning update, Saxo Bank said yields on BB-rated dollar high-yield bonds had reached 7.14%, with spreads near six-month highs and CCC-rated debt under even greater pressure. Lower benchmark yields help reduce the risk-free component of financing costs, but issuers with weak cash flows and a reliance on external funding may still face high credit costs. The Treasury rally alongside further technology-share declines showed that worries about access to financing and investment returns outweighed the support from the day's lower discount rates.
Initial jobless claims fall to 194,000, while hiring remains weak

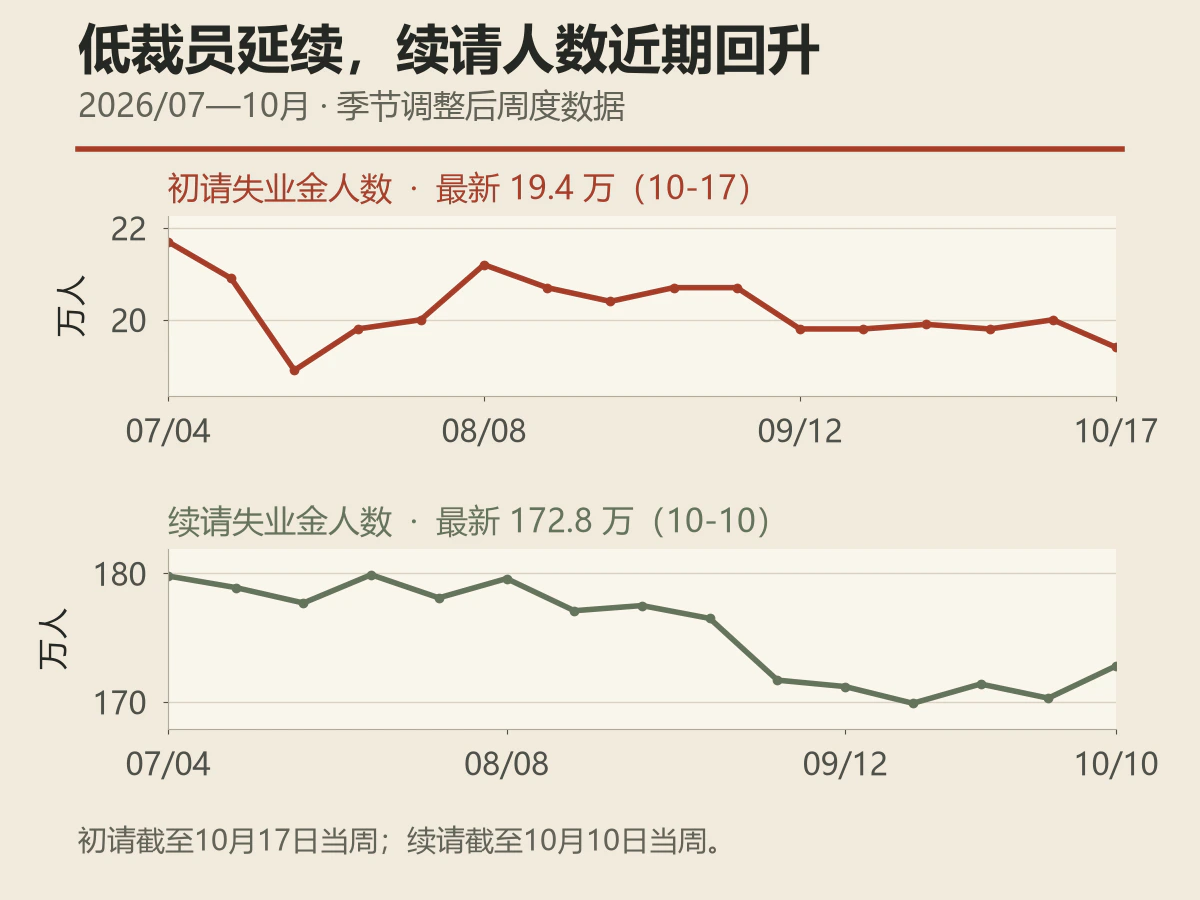
U.S. data released on October 22 continued to support the growth outlook. Labor Department figures showed seasonally adjusted initial jobless claims of 194,000 in the week ended October 17, down 6,000 from the revised prior week and below the 200,000 expected in a Reuters survey. The four-week moving average fell to 197,750. Initial claims had stayed at or below 200,000 for six consecutive weeks, with limited layoffs helping stabilize household wage income.
Insufficient hiring remained the labor market's weak point. Seasonally adjusted continuing claims rose by 25,000 to 1.728 million in the week ended October 10. Reuters quoted Citi economist Veronica Clark as saying the recent pattern in continuing claims could still be consistent with modest employment growth in October. Pantheon economist Oliver Allen emphasized that weak hiring would continue to affect the long-term unemployed and new labor-market entrants. Existing workers were less likely to lose their jobs, but jobseekers still had difficulty finding new positions.
The Conference Board reported that same day that the U.S. Leading Economic Index, or LEI, was unchanged month on month in September at 99.6, with 2016 equal to 100, better than the expected 0.2% decline. The index rose a cumulative 0.6% from March through September, after falling 1.1% over the preceding six months. The yield spread and average weekly manufacturing hours provided support, while a sharp decline in consumer expectations weighed on the index. The Coincident Economic Index, or CEI, which tracks current activity, rose 0.3% in September, compared with 0.1% in August.
Continued economic expansion preserved room for policy to respond to energy-cost pressures; weak hiring and falling consumer expectations constrained future demand. The preliminary U.S. manufacturing and services PMIs due on the evening of October 23, Beijing time, would provide more evidence on changes in orders, employment and price pressures.
Brent rises nearly 4% as rate-hike expectations weigh on gold
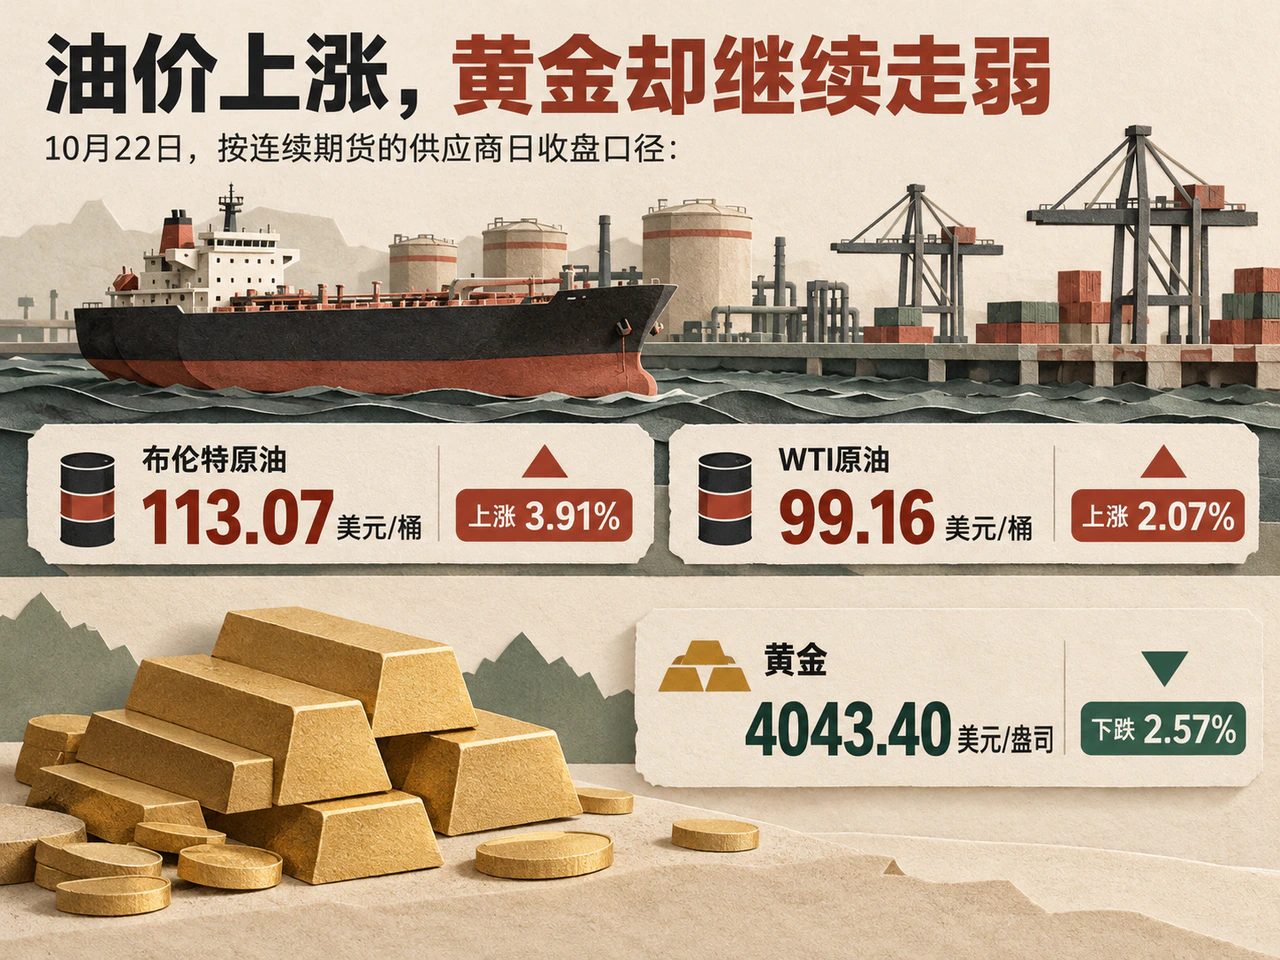
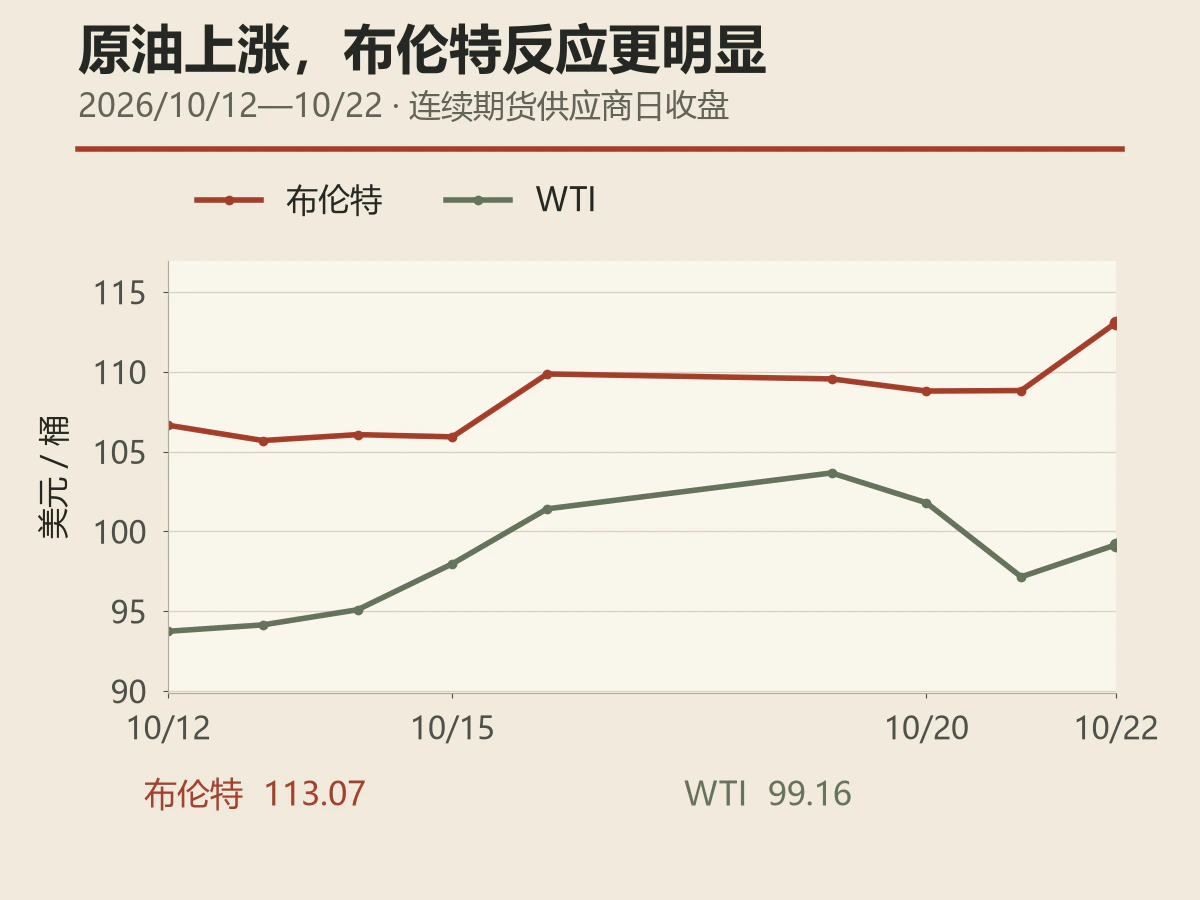
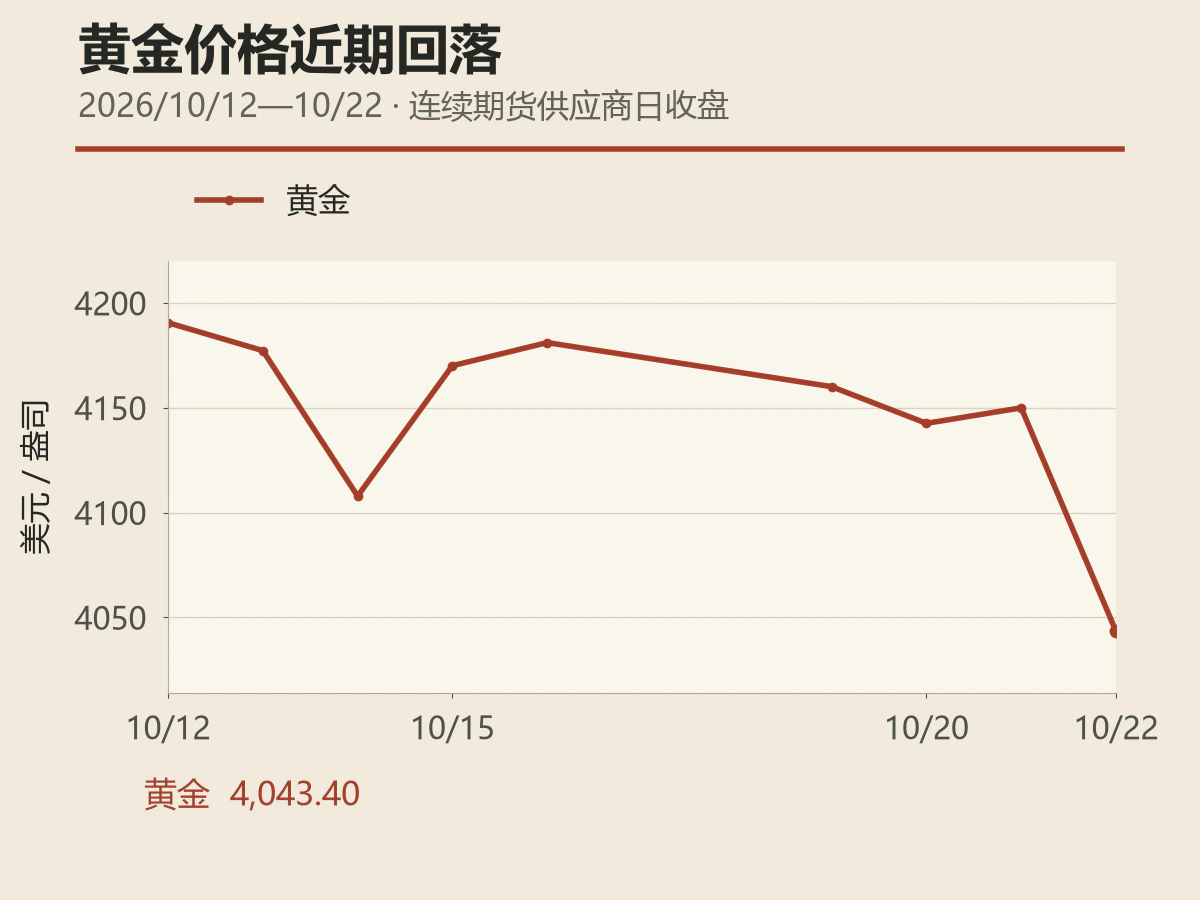
On the data provider's daily closing basis for continuous futures, Brent crude was $113.07 a barrel on October 22, up 3.91%; WTI was $99.16 a barrel, up 2.07%; and gold was $4,043.40 an ounce, down 2.57%. Brent's larger gain was consistent with supply risks concentrated in the Middle East and international maritime transport.
Reuters linked the oil-price rise to Gulf security risks, with concerns about attacks on energy facilities and vessels continuing to raise the supply-risk premium. Morgan Stanley estimated Middle Eastern crude exports at roughly 17 million barrels a day the previous week, compared with Kpler's prewar 12-month average of about 18 million barrels a day. Exports had recovered to a substantial level, but supply security remained a market concern. The head of Libya's National Oil Corporation said that same day that pipeline valves connecting the Hamada and Tahara fields to Zawiya port had been shut, reducing output at both fields.
Energy trade also faced policy changes. The Kyiv Independent reported on October 22 that a draft EU sanctions package it had seen proposed 117 new listings, including 31 related to Russia's oil processing, refining and export capacity, as well as 52 banks and financial institutions. The draft still required approval from member states. If adopted, the transaction and settlement restrictions could raise the cost of moving energy through the trading system.
Gold did not receive the same safe-haven support. Reuters quoted High Ridge Futures' David Meger as saying that fears of inflation and further interest-rate increases caused by rising energy prices were depressing gold. Intesa Sanpaolo economists expected contracting global jewelry demand could keep gold fluctuating around $4,200 an ounce over the next several quarters. The dollar index edged down 0.07% to 101.617 that day and nominal Treasury yields also fell significantly, yet gold weakened, drawing attention to pressure from policy expectations and physical demand.
Higher oil prices will increase energy-import bills and affect corporate profit margins through fuel costs. For gold, the duration of the energy shock and the monetary-policy response will continue to influence the opportunity cost of holding an asset that pays no interest.
The French-German spread reaches a nearly 15-year high, testing fiscal execution
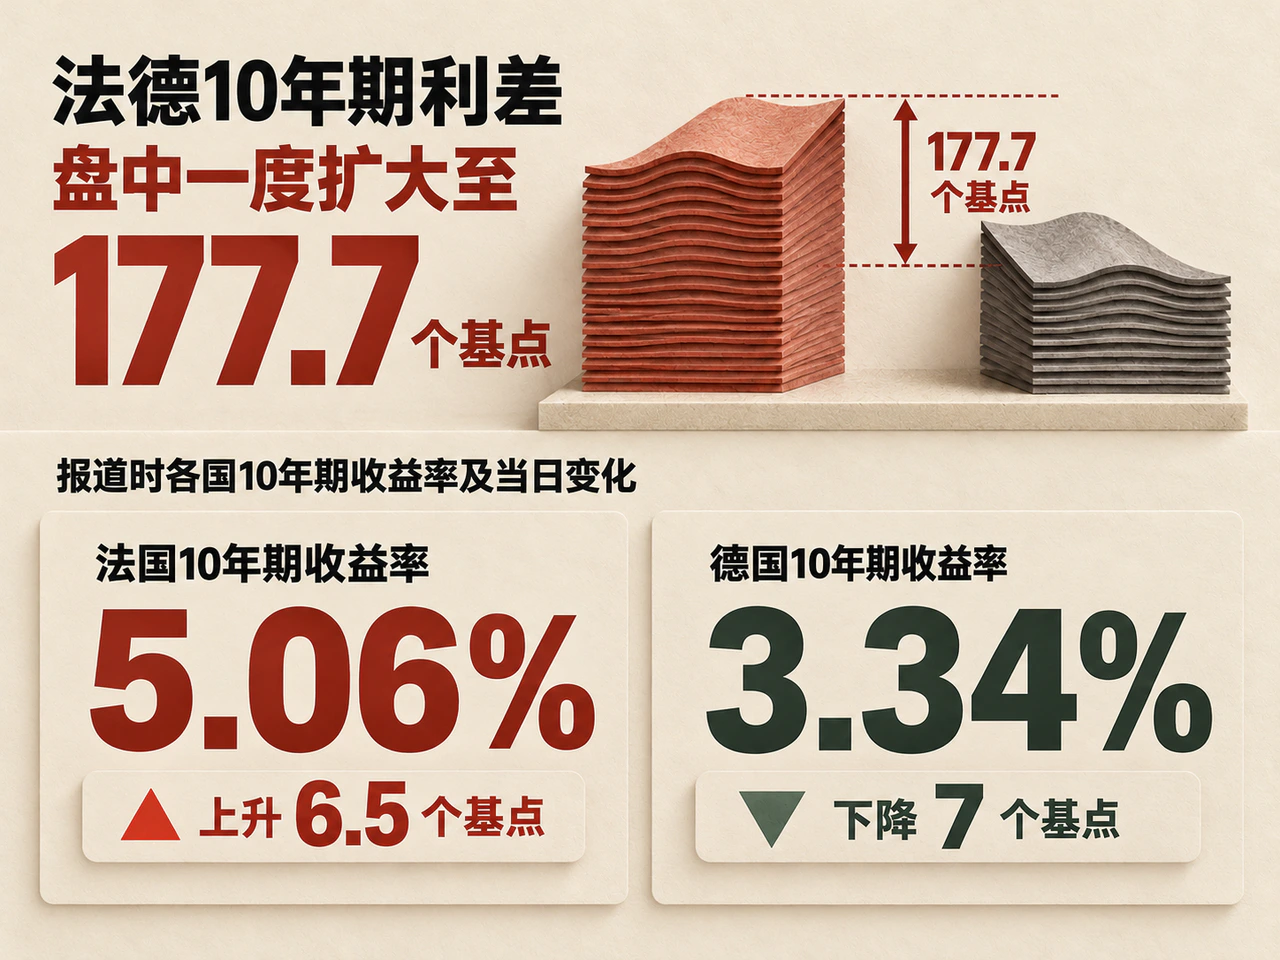
Divergence was even more pronounced in European bond markets. Reuters reported on October 22 that France's 10-year yield briefly reached 5.1415% intraday, while its spread over comparable German debt widened to as much as 177.7 basis points, the highest since November 2011. At the time of the report, the French 10-year yield was 5.06%, up 6.5 basis points on the day, while Germany's was down 7 basis points at 3.34%. Difficulties passing France's budget and political uncertainty put the implementation of fiscal consolidation in focus.
Pressure also spread to other European bond markets. At the same reporting point, the spreads of Belgium, Italy, Spain and Greece over Germany had all widened. Nomura European economist Andrzej Szczepaniak saw a high threshold for European Central Bank intervention, requiring further contagion and disorderly market moves that impeded monetary-policy transmission. Citi economist Giada Giani emphasized that Europe's institutions and crisis-response capacity were stronger than 15 years earlier, but that Euroscepticism would constrain coordination. If sovereign spreads keep widening, pressure will pass through bond valuations, collateral values and financing prices to banks and companies.
An upward revision to Germany's tax forecasts did not release an equivalent amount of fiscal room. The tax-estimation committee expected cumulative revenue for all levels of government in 2026-2030 to be EUR 43.4 billion above its May forecast, with only EUR 3.3 billion of that accruing to the federal government. The federal revenue forecast for 2027 increased by EUR 4.1 billion, but tax-cut arrangements and the cyclical adjustment under the debt brake largely absorbed the improvement. Economic recovery helps raise revenue, while spending remains constrained by institutions and budgets.
Trade-policy uncertainty continued to influence corporate investment. A White House policy document on wind-power equipment released on October 22 under Section 232 directed the commerce secretary and U.S. trade representative to conduct or continue negotiations and report progress at least once within 180 days, while reserving the possibility of other measures. The document imposed no new tariff on imported wind turbines, and existing related metal tariffs remained applicable. Wind projects and equipment suppliers still needed to account for future policy changes in procurement costs and delivery arrangements.
Asian technology stocks come under pressure as China's liquidity operations shift to shorter maturities
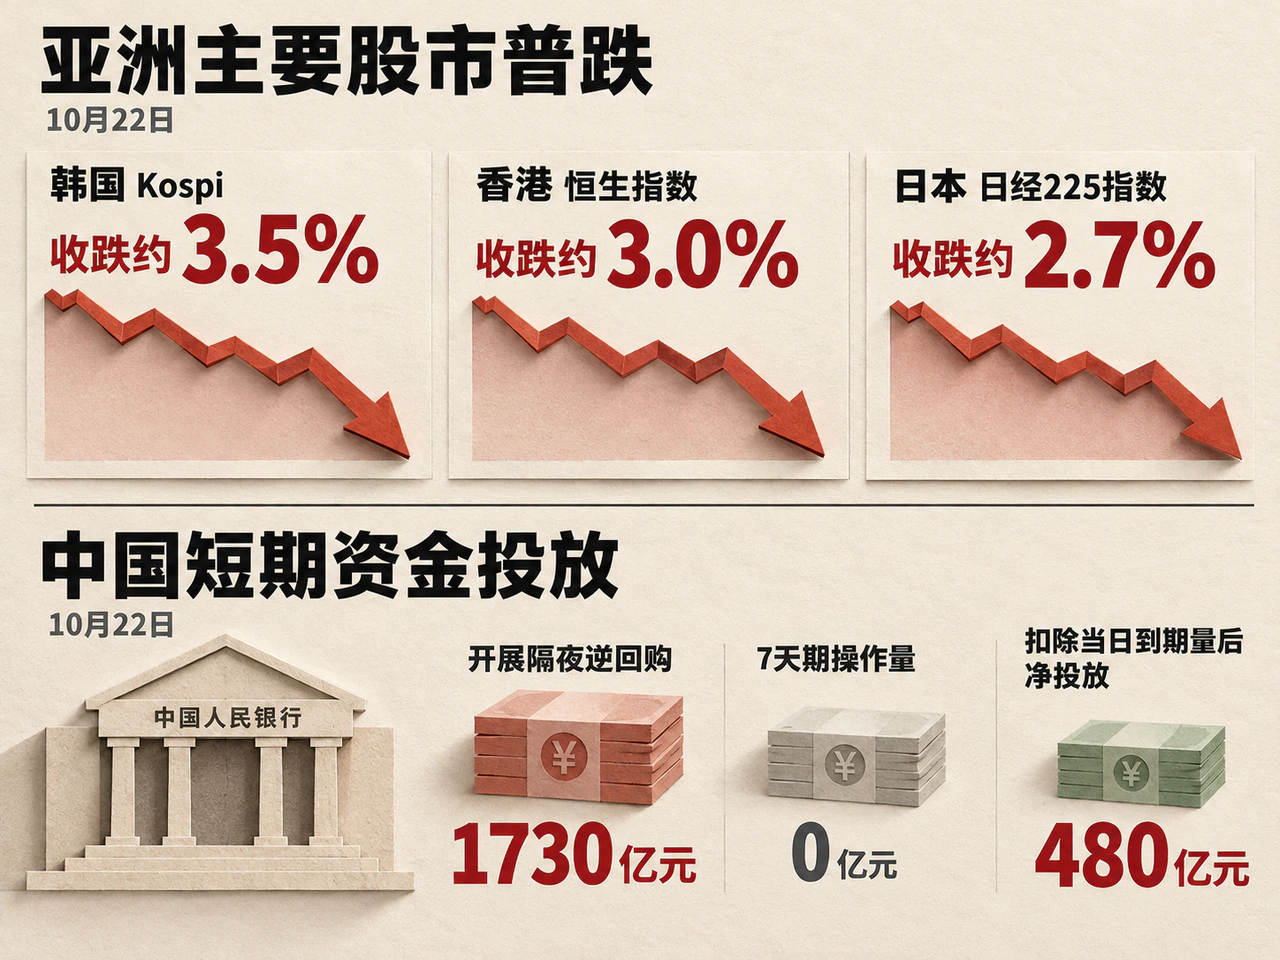
Technology shares had already fallen during the Asian trading session on October 22. The Associated Press reported that South Korea's Kospi closed down roughly 3.5%, Hong Kong's Hang Seng about 3.0%, and Japan's Nikkei 225 around 2.7%. Asian markets closed before Thursday's U.S. cash session ended, showing that this reassessment of risk was unfolding across markets in succession.
Japanese and South Korean semiconductor and equipment supply chains are sensitive to U.S. AI customers' capital budgets and purchasing plans. If customers delay investment, the impact will feed through orders; if demand holds up but financing structures change, the impact may appear more in valuations. Hong Kong technology stocks are also influenced by risk appetite for growth assets and external financing conditions, making local earnings and funding conditions more important.
According to Xinhua Finance, the People's Bank of China conducted RMB 173 billion of overnight reverse repos on October 22 and no 7-day operations, delivering a net injection of RMB 48 billion after that day's maturities. It was the second consecutive day of overnight reverse repos and the third consecutive day with no 7-day volume. Shorter-maturity instruments make it easier to inject and withdraw liquidity according to daily funding gaps, improving precision around tax-payment dates and similar junctures. The shift in the main operating instrument to overnight maturities proposed on October 19 remained at the stage of studying an appropriate opportunity. Subsequent formal operations and interest-rate arrangements would determine its policy significance.
Foreign-investment inflows showed structural changes. The Ministry of Commerce reported on October 22 that actually utilized foreign investment nationwide totaled RMB 548.81 billion in January-September, down 4.3% year on year, while September alone rose 2.5%. High-tech industries utilized RMB 228.53 billion, up 33.8%, accounting for 41.6% of the total, an increase of 11.9 percentage points from a year earlier. Overall foreign investment remained below the prior-year level, but inflows into high-tech industries grew substantially, supporting investment in those industries.
Cash returns on offshore distressed debt depend more heavily on progress in asset recovery. Nikkei Asia reported on October 22 that Evergrande's liquidators planned the first distribution to creditors in the first half of 2027. Liquidation expenses, recoverable assets and the timing of distributions determine cash flows on such claims. For normally operating dollar-bond issuers, lower Treasury benchmarks help financing prices; for distressed debt, actual recoveries remain the key to realizing value.


