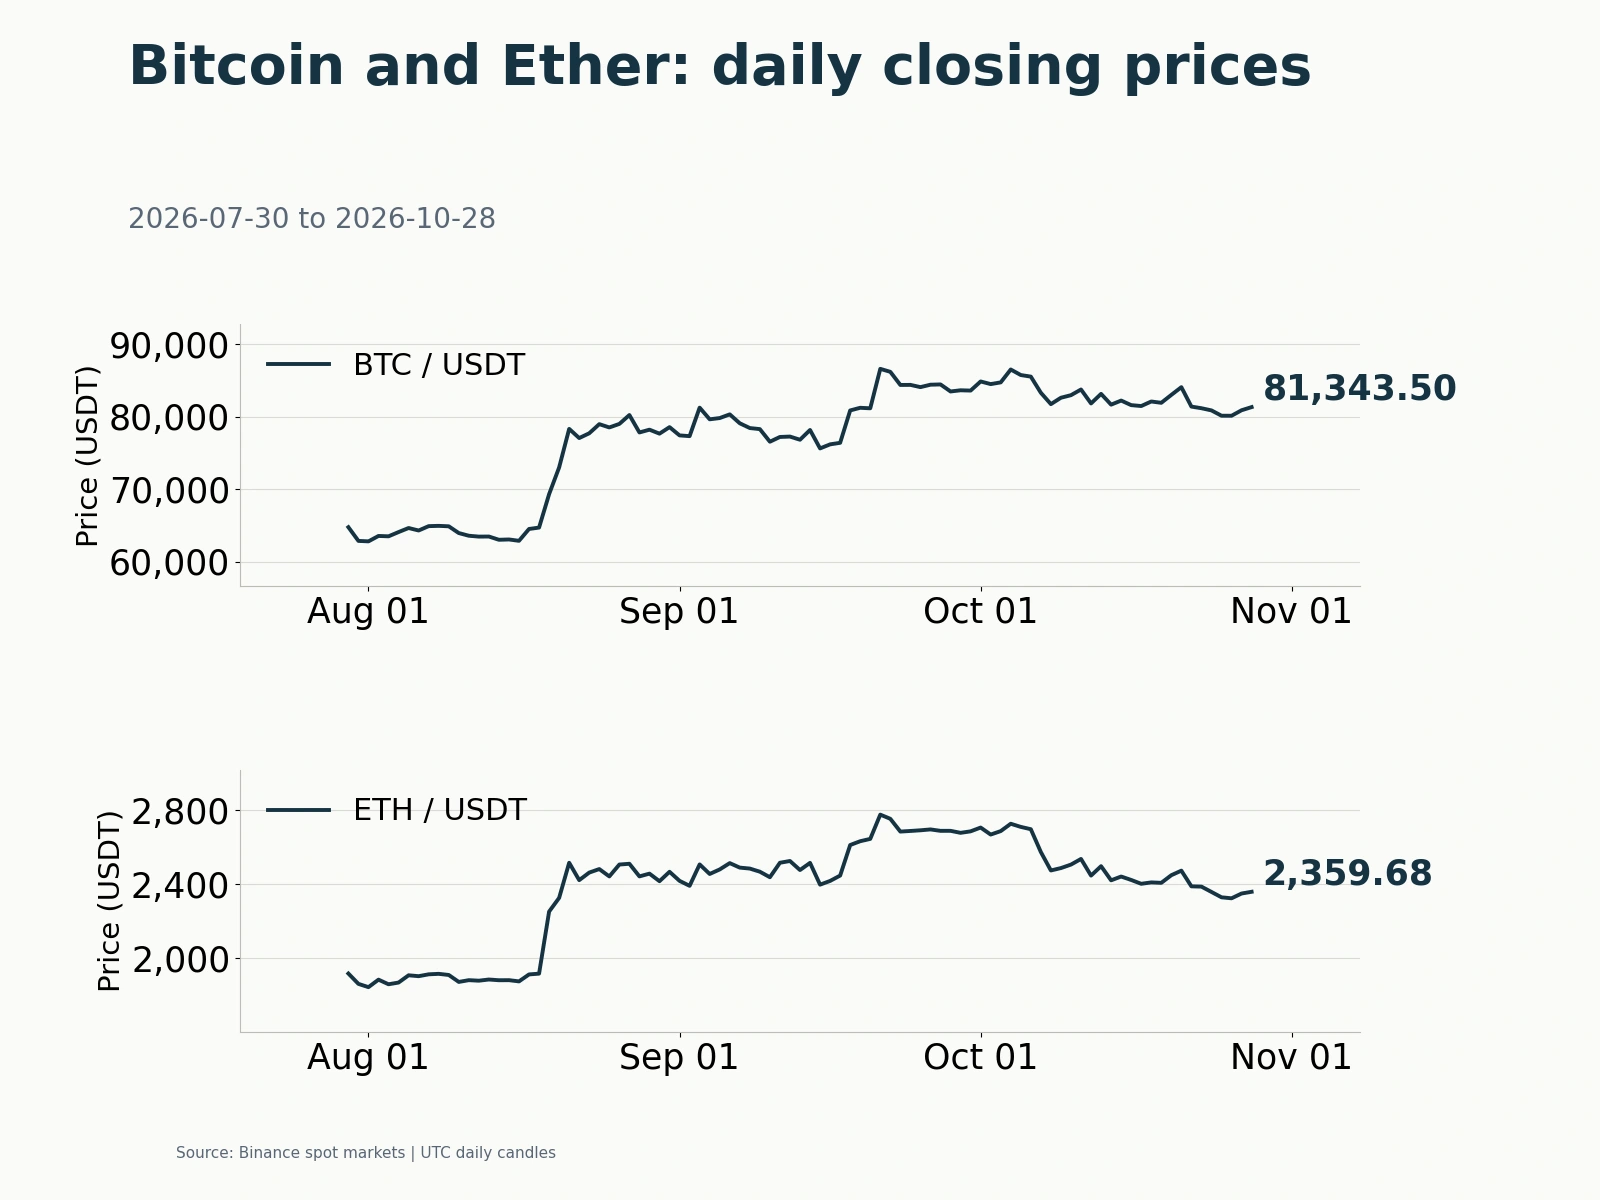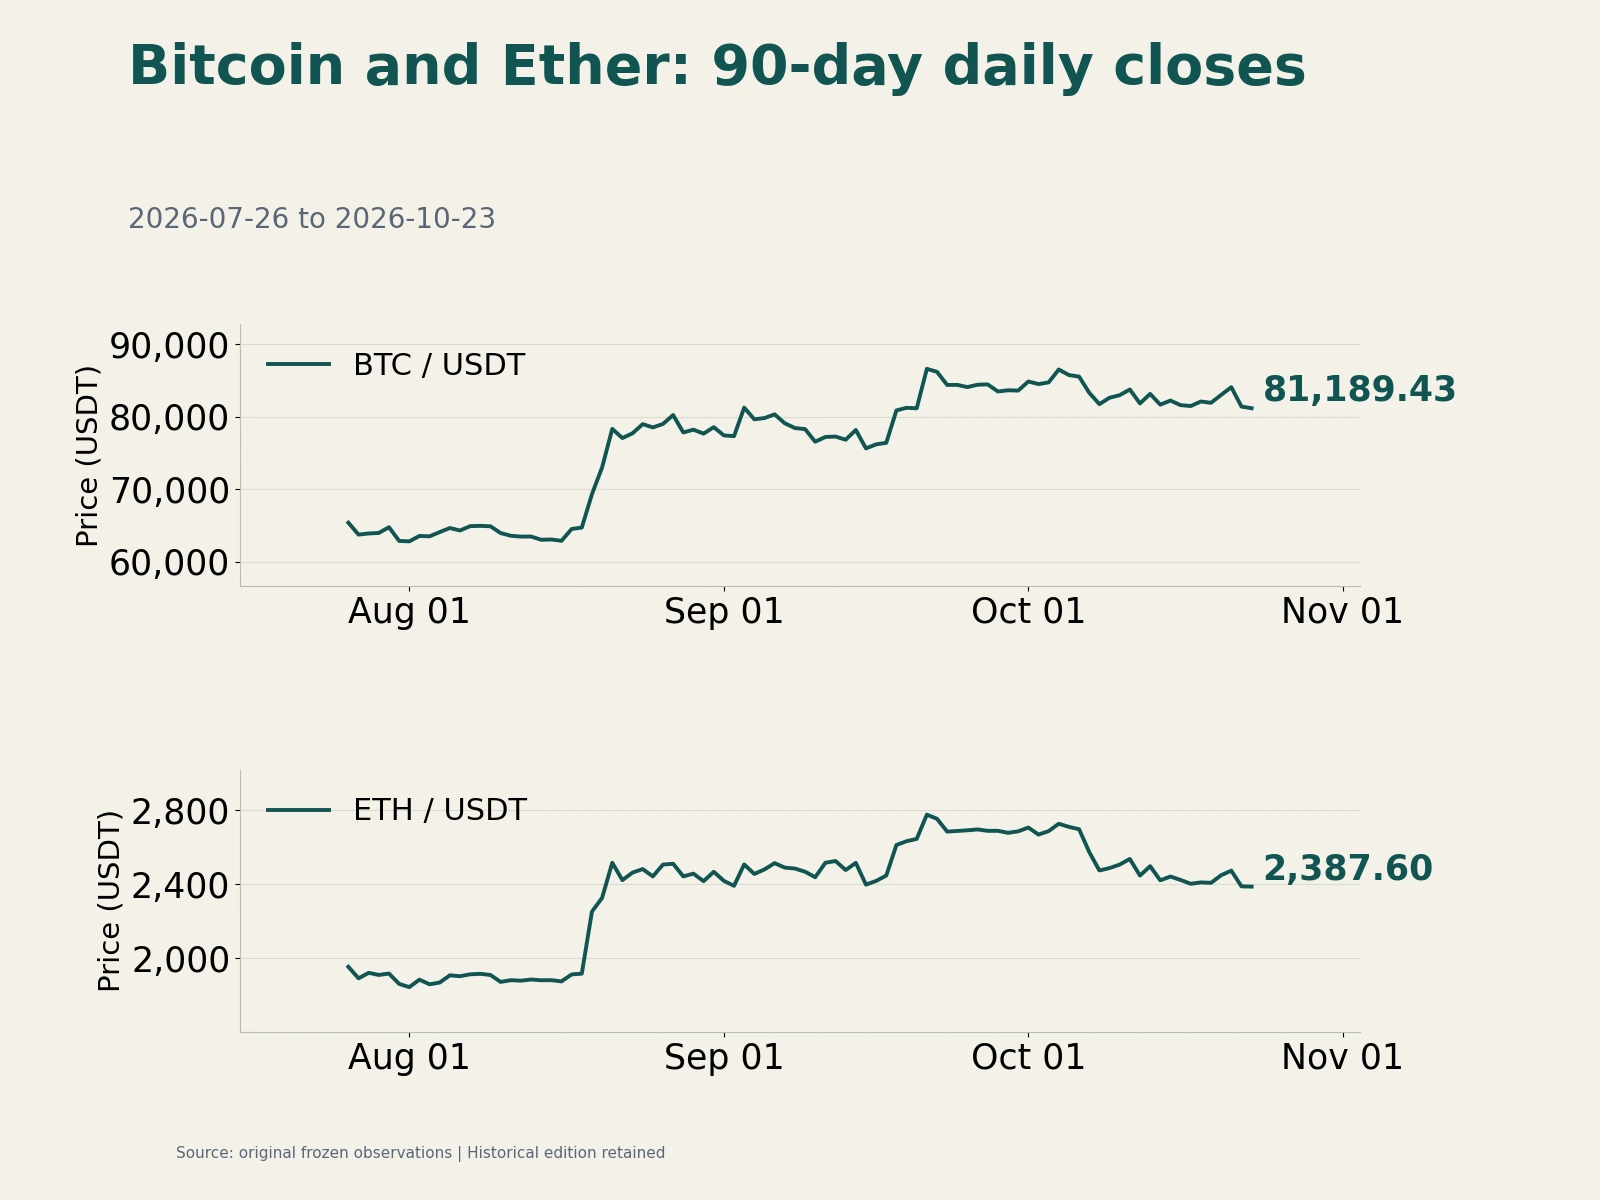
After the previous day’s sharp selloff, crypto rose and then retreated during the October 23 session. Prices throughout this article use Binance spot USDT UTC daily candles, closing at 08:00 Beijing time on October 24. Bitcoin ended at 81,189.43 USDT, down 0.28%, and Ether at 2,387.60 USDT, down 0.06%. Only BNB and TRX rose in the fixed ten-token major-asset sample. The U.S. technology stock correction and unstable institutional flows continued to constrain buying.
Bitcoin and Ether turnover falls more than 30%; only BNB and TRX rise in the major-token sample

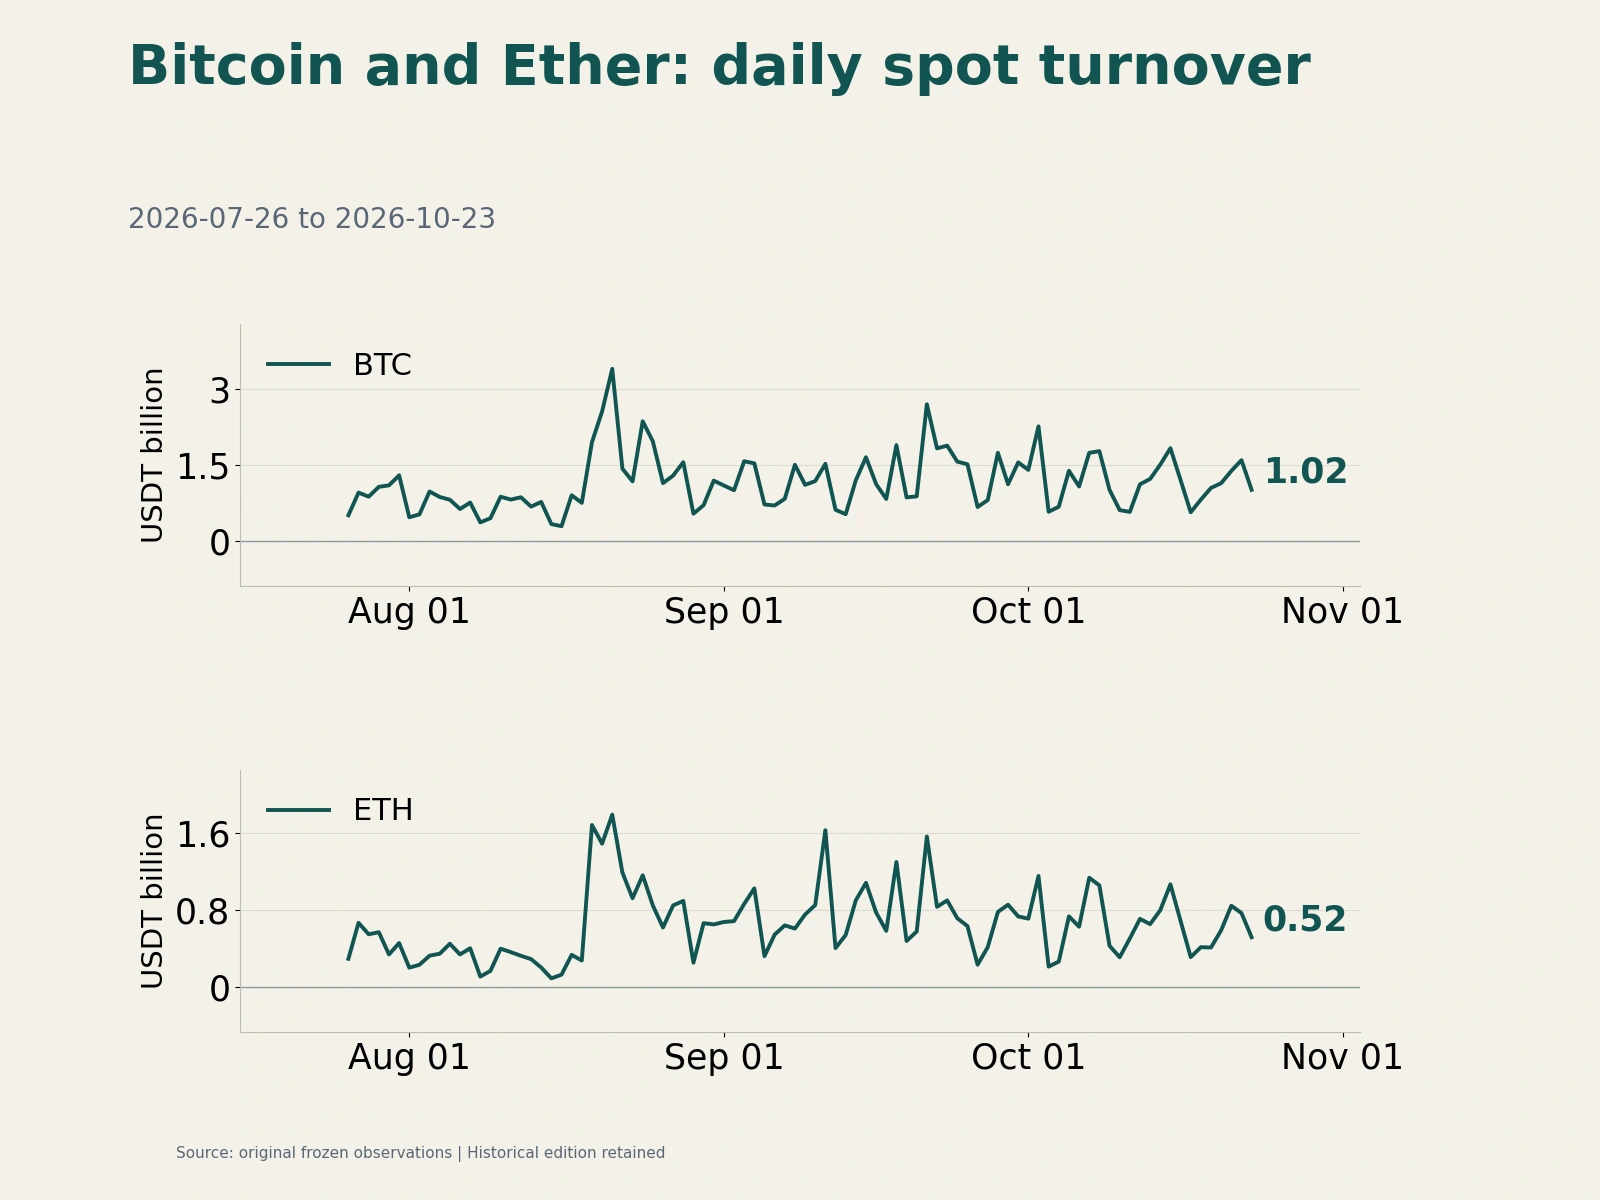
Bitcoin traded between 80,513 and 82,060.88 USDT on October 23. Lower levels attracted buyers, but selling pressure persisted above. Trading activity cooled markedly after the previous day’s volatility: BTC/USDT spot turnover fell 36.50% to 1.017 billion USDT, while ETH/USDT turnover declined 32.67% to 517 million. Both prices edged lower on lighter volume as buyers and sellers sought a new balance within the lower trading range.
Some assets briefly rebounded strongly. CoinDesk reported during Friday’s European session that Bitcoin had risen approximately 0.5% since UTC midnight. Buyers of the selloff initially favored higher-beta assets, with PEPE leading memecoins and DeFi tokens recovering from the preceding day. Buying failed to spread to the heavyweight assets. At the full daily close, the ten-token sample excluding stablecoins and wrapped assets—BTC, ETH, BNB, TRX, SOL, XRP, LINK, ADA, AVAX and DOGE—showed eight declines and two gains. BNB rose 1.14% and TRX 0.46%, while SOL fell 0.77%, XRP 1.10%, LINK 1.09%, and ADA, AVAX and DOGE also ended lower. Turnover confirmed the concentration: BNB volume rose 43.60%, while BTC, ETH and most other sampled assets traded substantially less.
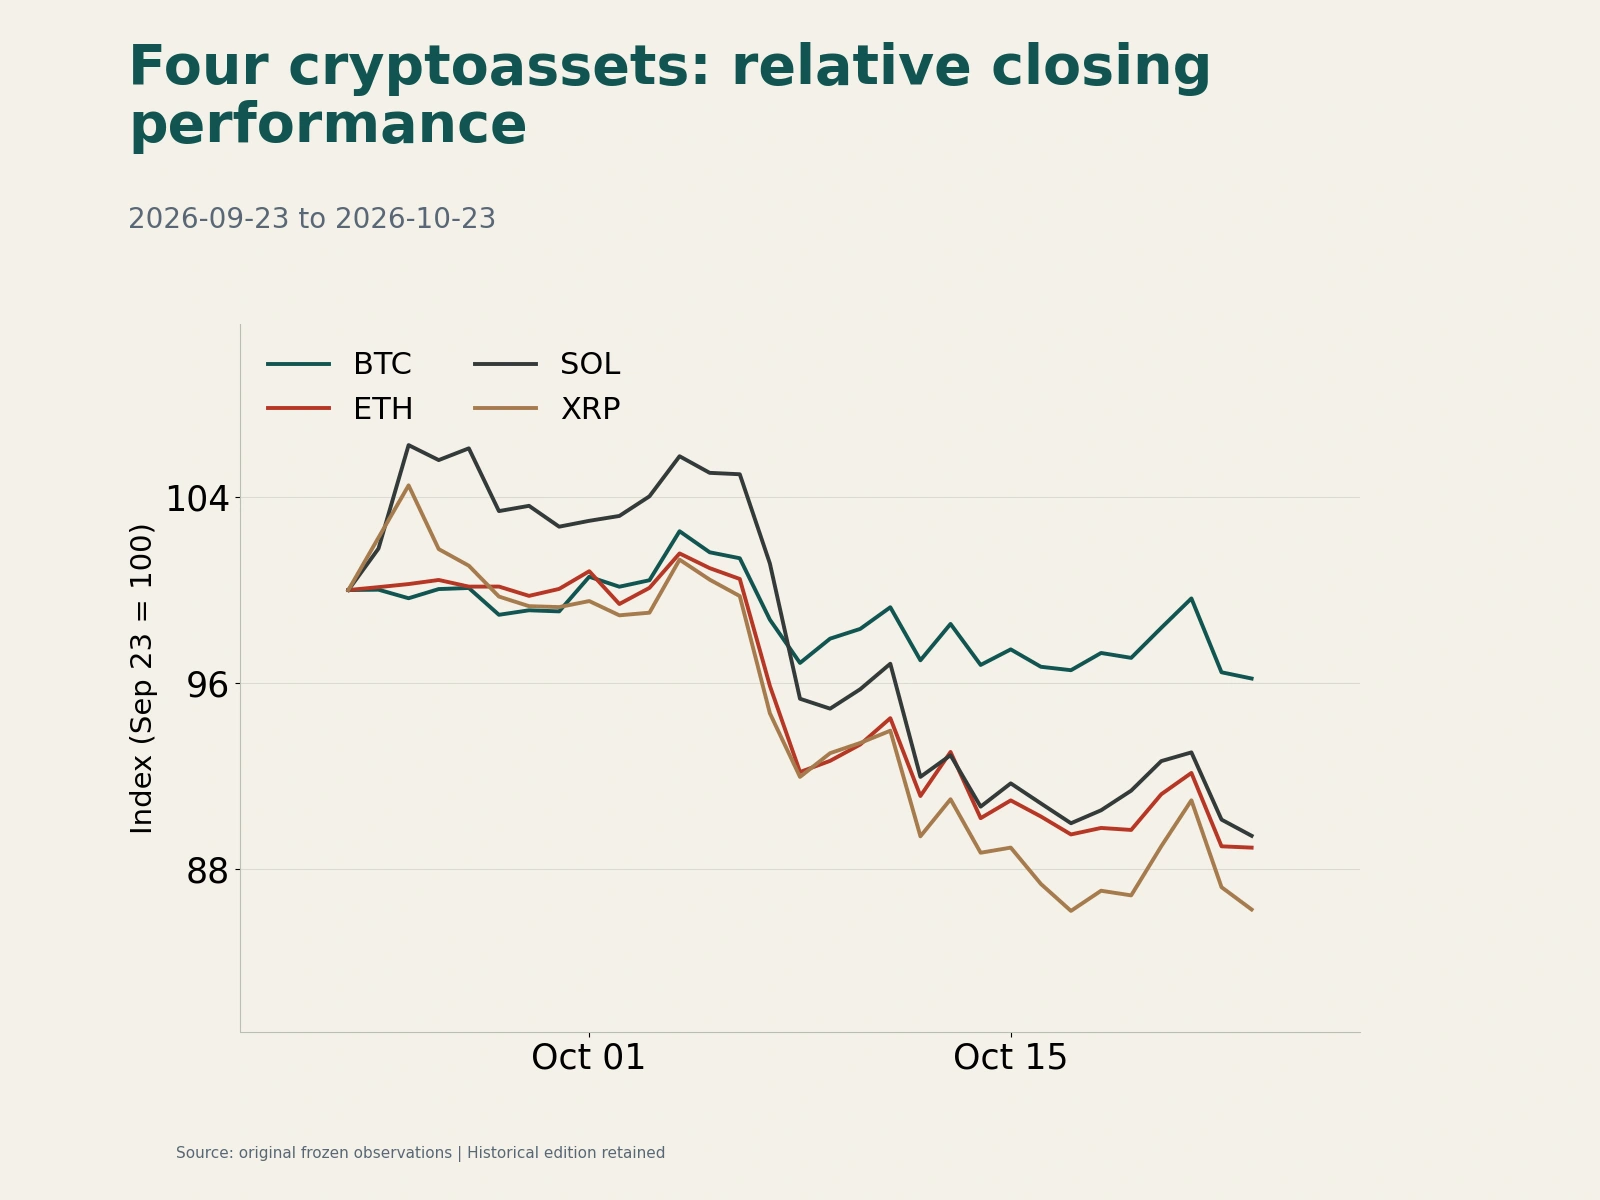
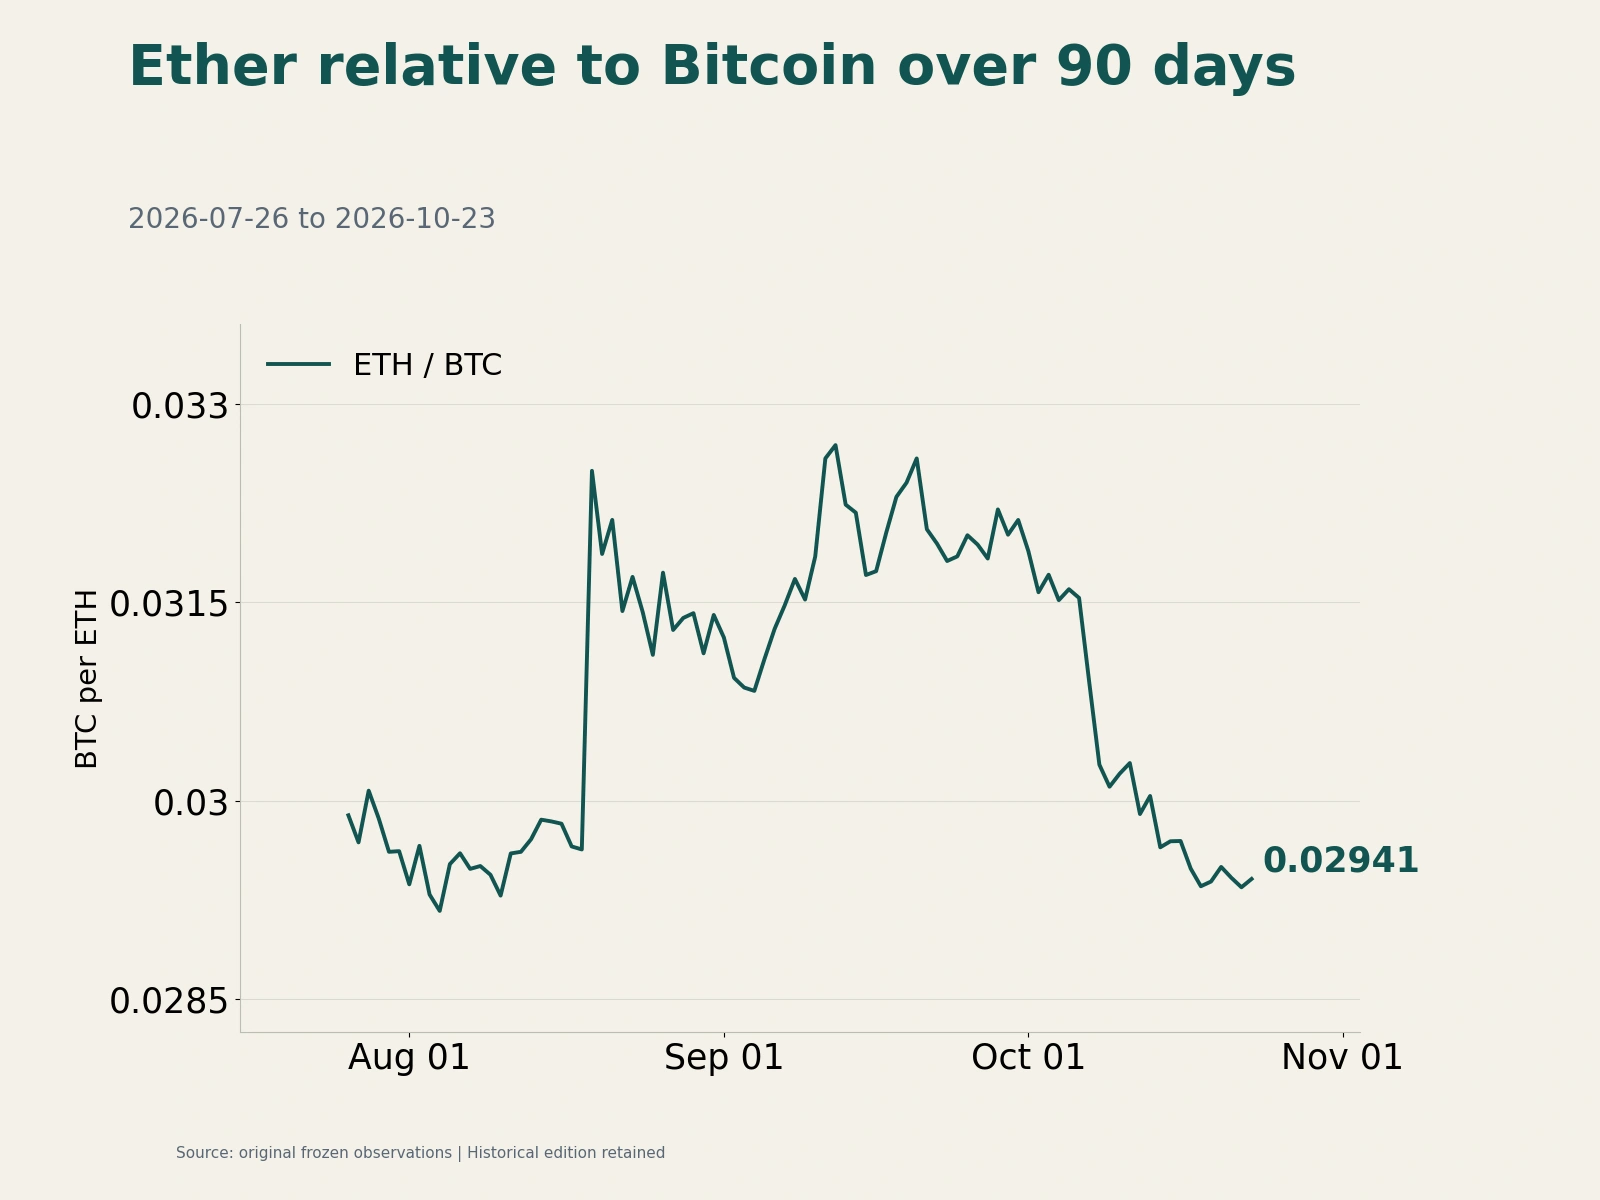
Over the preceding 30 complete UTC trading days, relative performance diverged more sharply. Bitcoin lost 3.80%, Ether 11.07%, SOL 10.56% and XRP 13.72%. Ether’s slightly smaller daily decline lifted ETH/BTC approximately 0.21% to about 0.02941, but the ratio was still down roughly 7.55% over 30 days. One day of stabilization had not reversed the preceding month’s weakness.
A Nasdaq correction and US$635.6 million Bitcoin ETF outflow leave institutional buying unsettled
External macro pressure came mainly from weaker financing expectations in U.S. technology. The Nasdaq Composite fell 2.6% on Thursday as the scale and funding of AI capital expenditure became a market focus. Nexo’s research team attributed pressure to changing capital supply and financing conditions, saying risk assets were reassessing the sustainability of large construction programs. STS Digital’s Jeff Anderson also told The Block that Bitcoin remained closely linked to technology shares and that concerns over AI valuations and debt were affecting trading. When investors marked down high-growth assets and reduced portfolio risk, Bitcoin also faced selling. Steadier technology trading on Friday offered temporary relief. However, further oil gains increased inflation pressure ahead of the following week’s Fed meeting. Tighter technology financing weighed on growth expectations while energy costs disturbed inflation, keeping risk assets sensitive to policy signals.
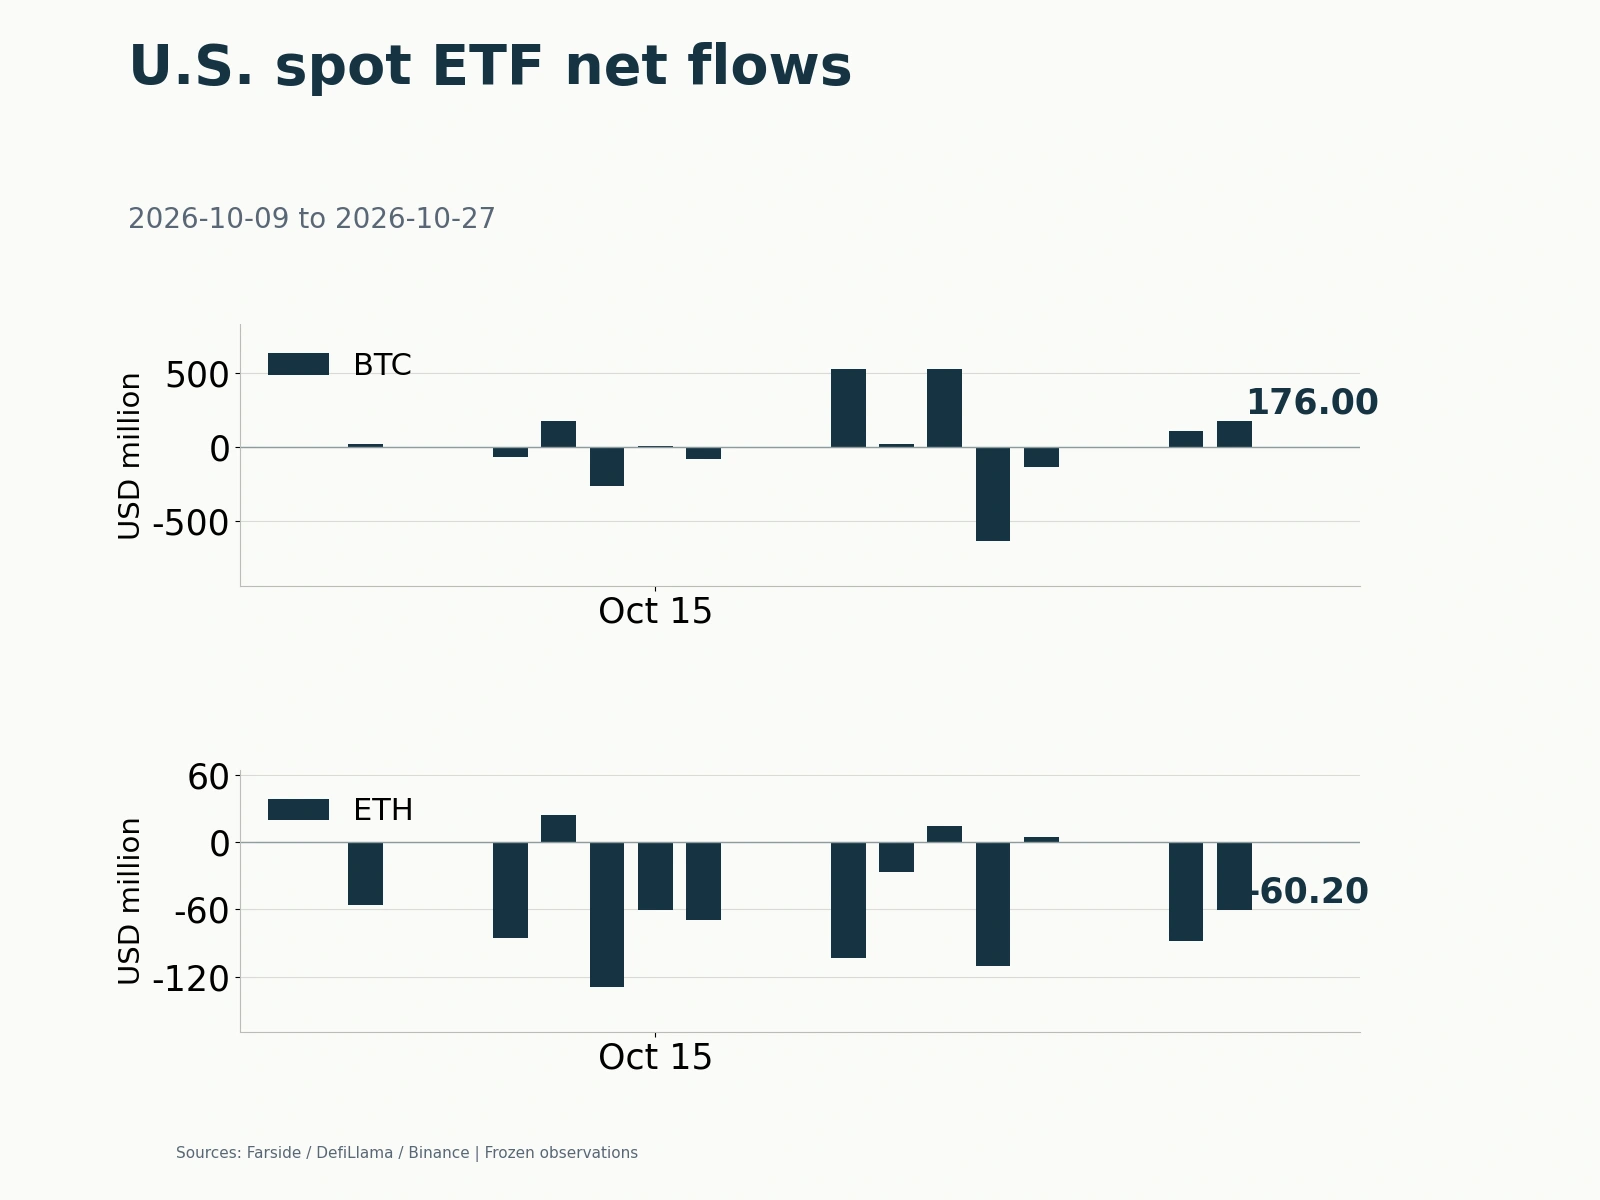
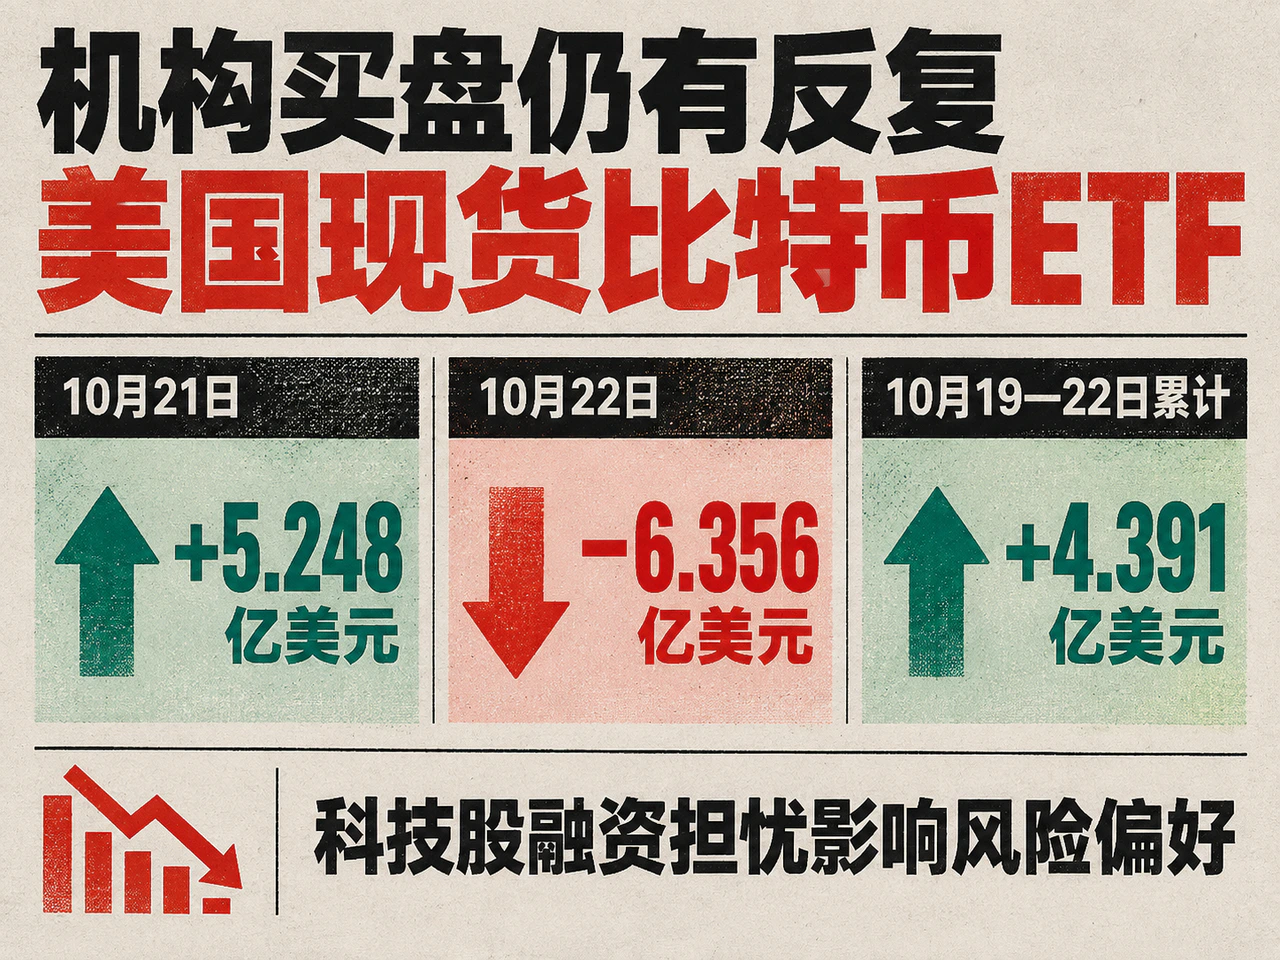
Institutional allocation flows were similarly contested. Complete Farside data showed US$635.6 million leaving U.S. spot Bitcoin ETFs on October 22, more than the US$524.8 million entering on October 21. October 19–22 nevertheless retained US$439.1 million of cumulative net inflows. Three consecutive early-week inflows coexisted with large Thursday redemptions: institutional capital had not withdrawn entirely, but buying support remained unstable.
Despite cautious spot trading, derivatives retained expectations of year-end gains. Anderson identified US$80,000–86,000 as Bitcoin’s near-term range to watch. Derive founder Nick Forster said the platform’s option pricing implied that the probability of Bitcoin exceeding US$100,000 before Christmas had risen from 9.7% to 12% over the week, while the probability of falling below US$70,000 declined from 15.6% to 11%. Some traders retained bullish year-end exposure and reduced downside-tail protection despite weak spot markets.
Ethereum ecosystem developments also showed a gap between longer-term expectations and implementation timing. Developers were discussing a consensus proposal for faster finality to improve capital-settlement efficiency, but it remained a draft. Meanwhile, the Glamsterdam Hoodi test planned for the following week was postponed while teams further examined compatibility between new gas rules and existing contracts.
Buying near 80,000 USDT provided Bitcoin with a buffer, but Ether and most major tokens had substantially underperformed over the month, showing that risk capital remained selective. Turning a rebound into sustained recovery would depend mainly on renewed continuity in spot Bitcoin ETF inflows and higher-volume gains spreading beyond individual tokens into the broader major-asset spot market.
Read the original article for full details.