During October 19–25, 2026, a reassessment of the cost of growth ran through global equity and bond trading. Treasury yields fell over the week, yet technology heavyweights surrendered early gains and corporate credit spreads widened. Oil rose while gold retreated. How much funding AI investment required, when it would produce cash returns, and how energy costs would affect profits and inflation became the main threads in asset pricing.
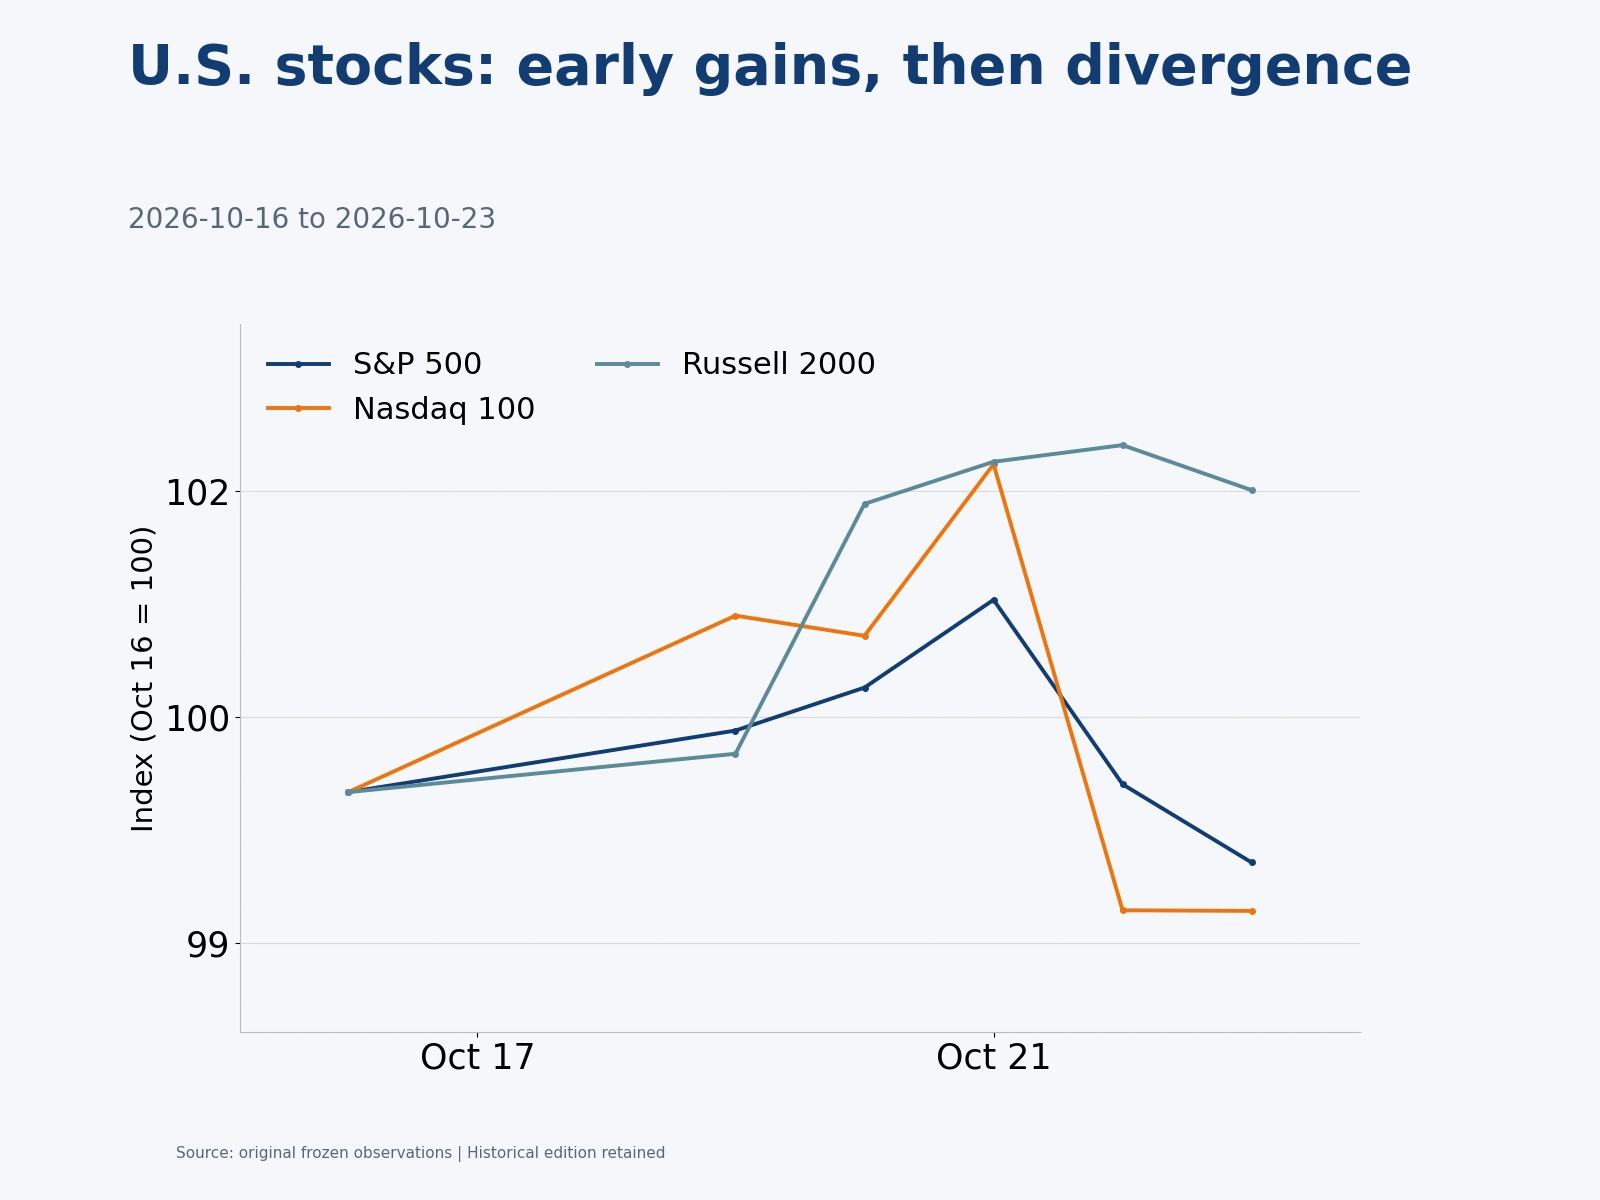
As observed on the morning of October 26 Beijing time, the previous week’s final complete trading session was October 23. The S&P 500 lost 0.47% over the week and the Nasdaq 100 fell 0.79%, while the Dow gained 0.41% and the Russell 2000 rose 2.00%. U.S. growth remained resilient; the market’s divergence centered more on company earnings, funding requirements and the capacity to absorb costs.
AI financing needs intensify pressure on technology shares and corporate credit

U.S. equities continued to recover in the first half of the week. By Wednesday the S&P 500 had reached 7,757.17 and the Nasdaq 100 stood at 29,822.52. Early in the week, JPMorgan upgraded Intel, while Goldman Sachs raised CoreWeave from Neutral to Buy but cut its price target. Institutions still saw operating potential in AI-related businesses, while concerns about financing costs and returns on capital persisted.
Thursday’s earnings reactions brought these competing expectations into focus. Media reported that Lam Research’s profit and revenue slightly exceeded expectations, yet its shares fell 11.8%. Meta beat revenue expectations but missed on profit and announced plans to raise funds through a new share class to support AI investment and other spending; its shares fell 7%. Nvidia and CoreWeave lost 4.4% and 10.1%, respectively. Investors were placing greater weight on the funding required for expansion and the time needed to turn investment into cash returns.
About two-thirds of S&P 500 constituents rose that same day. Procter & Gamble gained 5.6% after beating earnings expectations and retaining its full-year growth forecast. Over the week, energy ETF XLE gained 1.60% and financial ETF XLF rose 0.68%, while technology ETF XLK fell 0.13%. The VIX declined from 19.99 at the previous week-end to 16.68 on Wednesday, then recovered to 19.45 on Friday. Volatility intensified late in the week but still ended 0.54 point lower overall.
Tesla’s results combined lower earnings with improved cash flow. Third-quarter revenue was US$28.046 billion, compared with US$28.095 billion a year earlier; operating profit fell from US$1.624 billion to US$718 million. Free cash flow improved from negative US$1.092 billion in the second quarter to positive US$1.531 billion, mainly because operating cash flow increased and capital expenditure declined. The quarterly cash-flow improvement provided a buffer, while the year-on-year profit decline kept investment returns in focus.
Funding pressure also reached credit markets. Bloomberg reported that the global corporate-bond yield premium rose to 129 basis points on Thursday, its highest since May 2025. The cost of default protection on U.S. blue-chip corporate debt reached its highest since March on Friday. PGIM Credit said the potential scale of AI infrastructure financing had increased investment-grade bond investors’ concerns about future supply. Meta’s suggestion that it could raise hundreds of billions of dollars over the next few years made funding sources and the timing of project returns a shared concern for equity and bond investors.
Asian dollar bonds came under pressure as well. Bloomberg reported that spreads on high-grade Asian corporate dollar debt widened on Friday to their highest since July 2025. Traders’ indicative early-session quotes showed Chinese technology bond spreads widening by 3–5 basis points and Chinese investment-grade spreads by as much as five. Some increases in credit-protection costs later moderated, but the Export–Import Bank of Korea still delayed a yen bond issue because of market volatility. For offshore U.S. dollar bond allocations in Hong Kong, rising credit premiums could offset the support from lower Treasury yields, making issuers’ cash flow and the market’s capacity to absorb supply more important.
Longer Treasuries lead the rally as growth and prices limit the scope for lower yields
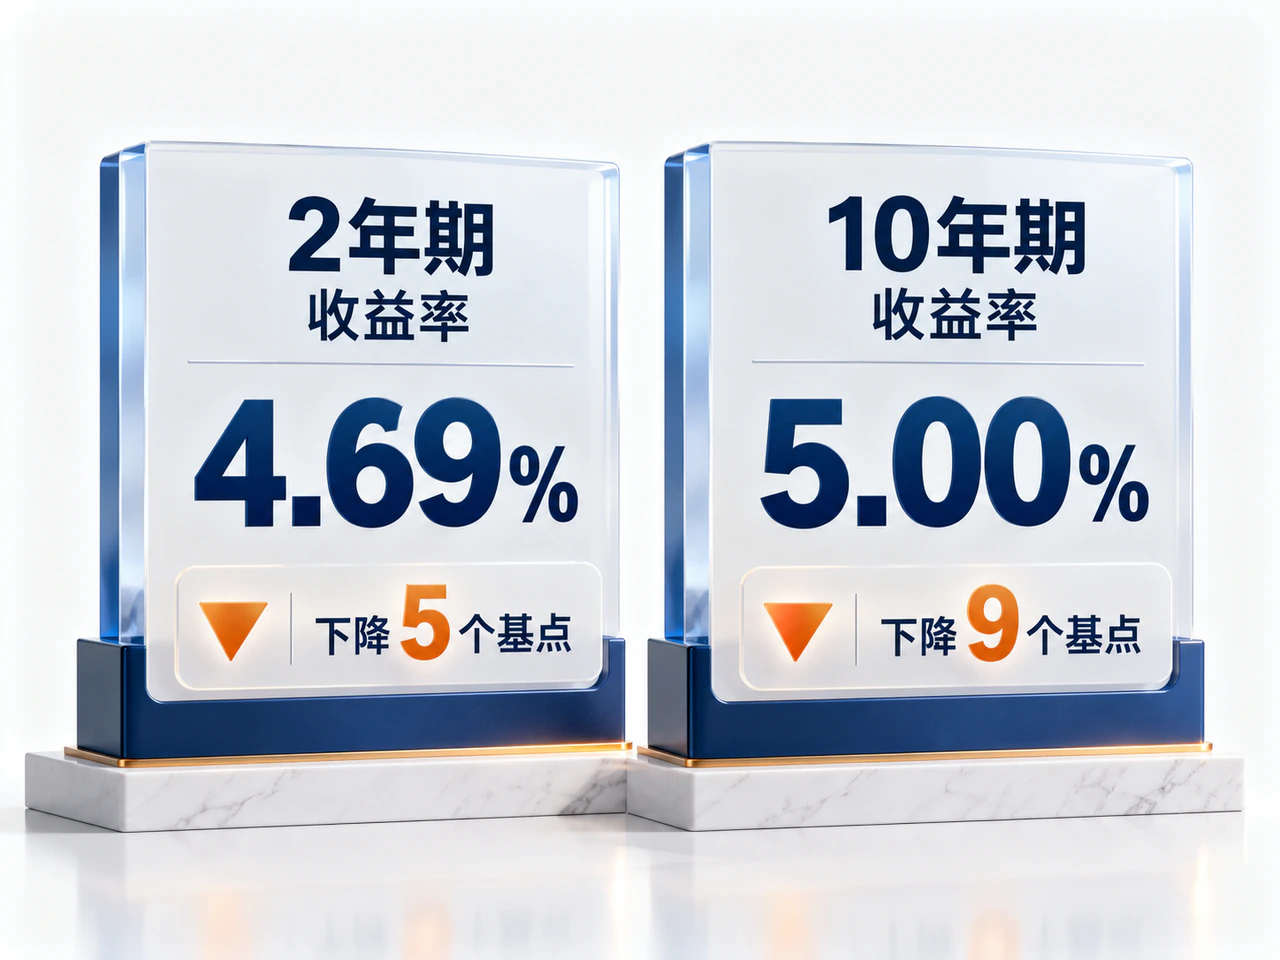
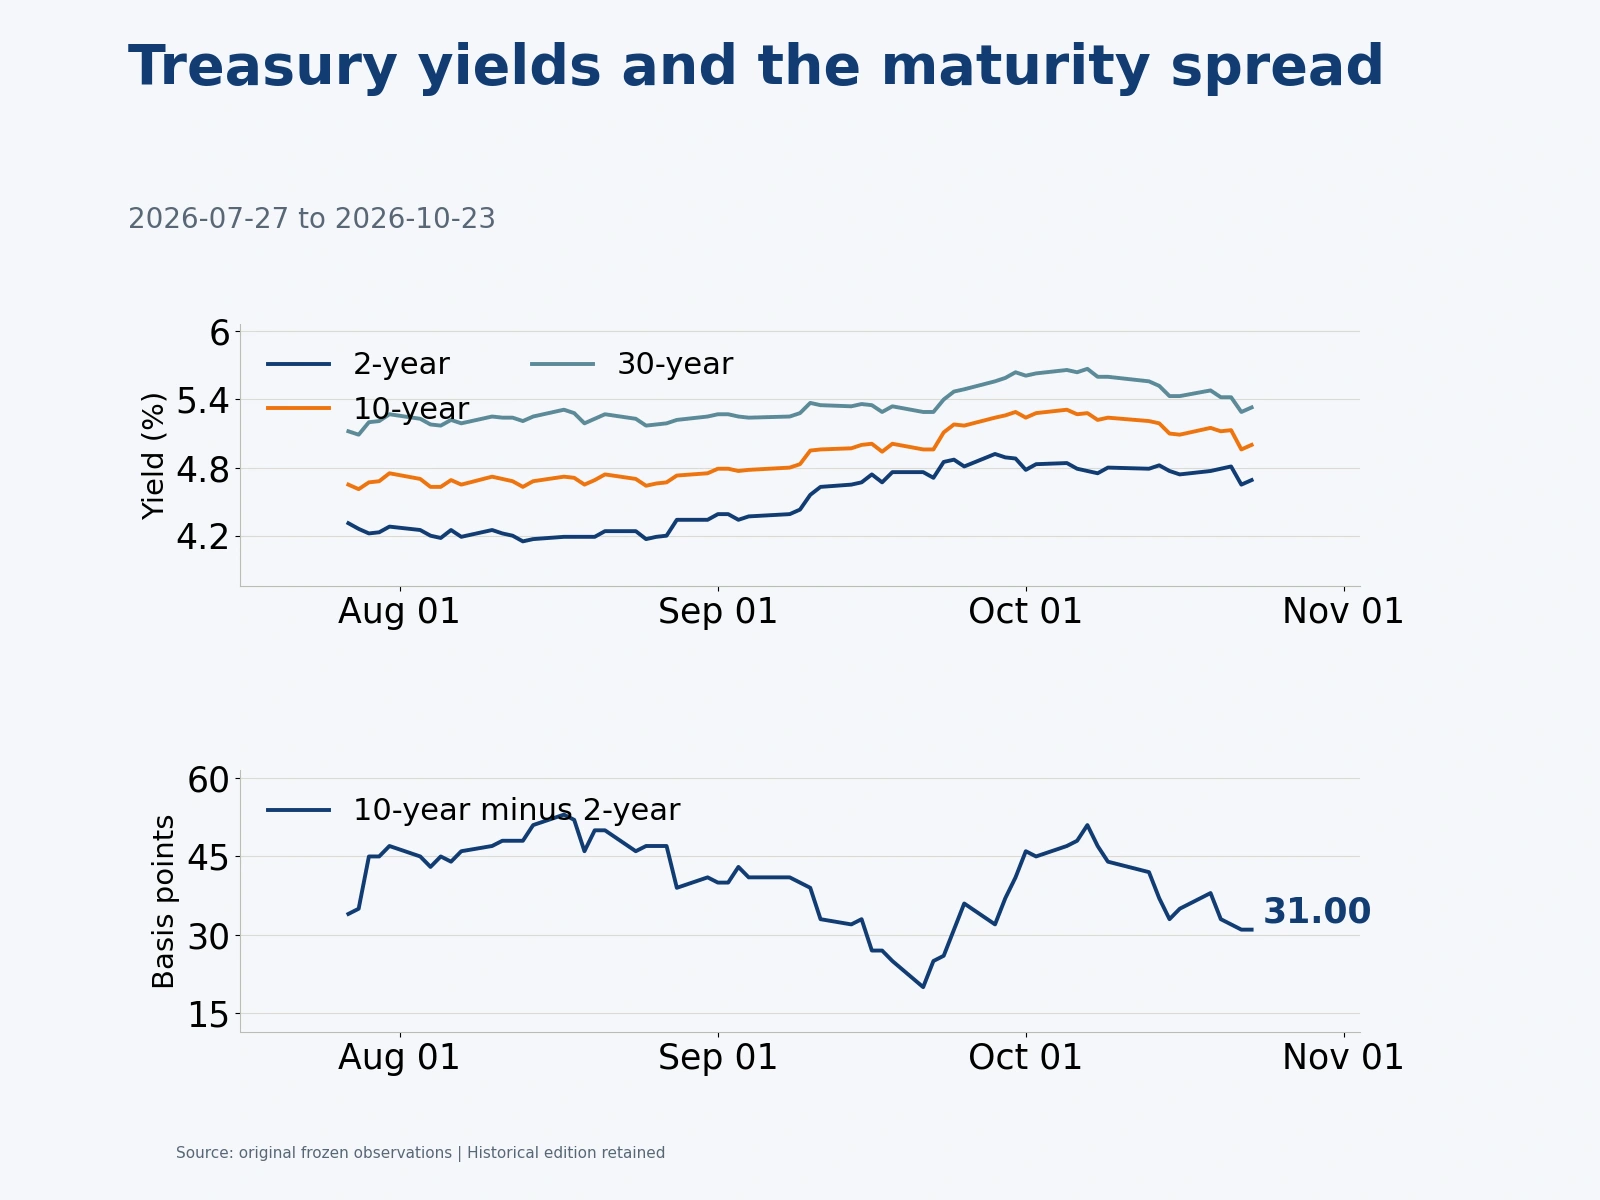
U.S. Treasury yields declined over the week, with larger falls at longer maturities producing a bull flattening of the curve. The two-year yield ended at 4.69%, down five basis points, and the 10-year at 5.00%, down nine. The 10-year minus two-year spread narrowed from 35 basis points at the previous week-end to 31.
| Maturity | October 16 close | October 23 close | Weekly change |
|---|---|---|---|
| 2-year | 4.74% | 4.69% | −5 basis points |
| 5-year | 4.89% | 4.82% | −7 basis points |
| 10-year | 5.09% | 5.00% | −9 basis points |
| 30-year | 5.43% | 5.33% | −10 basis points |
Thursday was the week’s turning point. Two- and 10-year yields had still been 4.81% and 5.13% on Wednesday, before falling by 16 and 17 basis points on Thursday and recovering four basis points each on Friday. MarketWatch cited traders attributing the rally to safe-haven buying, short covering and less Treasury hedge selling as large technology companies slowed their bond issuance. Falling Treasury yields alongside rising corporate credit premiums showed investors reallocating risk within fixed income.
Economic data continued to limit the room for yields to decline. The October flash U.S. composite PMI released on October 23 was 57.6, below September’s 58.4 but still indicating strong expansion. S&P Global said growth in new orders, delivery delays and backlogs strengthened firms’ ability to pass on costs. Goods and services selling prices rose at their fastest pace since August 2022. Previously released initial jobless claims for the week ended October 17 were 194,000, below the market expectation of 200,000, showing that layoffs remained limited.
High interest rates were constraining housing more visibly. The October NAHB Housing Market Index fell three points to 29, and September pending home sales declined 7.3% from the preceding month. Business orders continued to grow while housing demand weakened, leaving policy to balance price pressure against weakness in interest-sensitive sectors.
Demand at the inflation-protected Treasury auction weakened during the bond rally. The October 22 auction of US$26 billion of five-year TIPS had a bid-to-cover ratio of 2.41, down from 2.61 previously, and its awarded real yield was slightly above the prevailing market level. Standard Chartered closed a tactical bullish trade after the 10-year yield fell below 5%, while continuing to watch energy prices and policy risks. On October 29, the Bureau of Economic Analysis was scheduled to release its first estimate of third-quarter GDP alongside September personal income and outlays. Real spending and core PCE prices would further test growth resilience and inflation pressure.
Brent gains more than 6%; gold falls over 4%
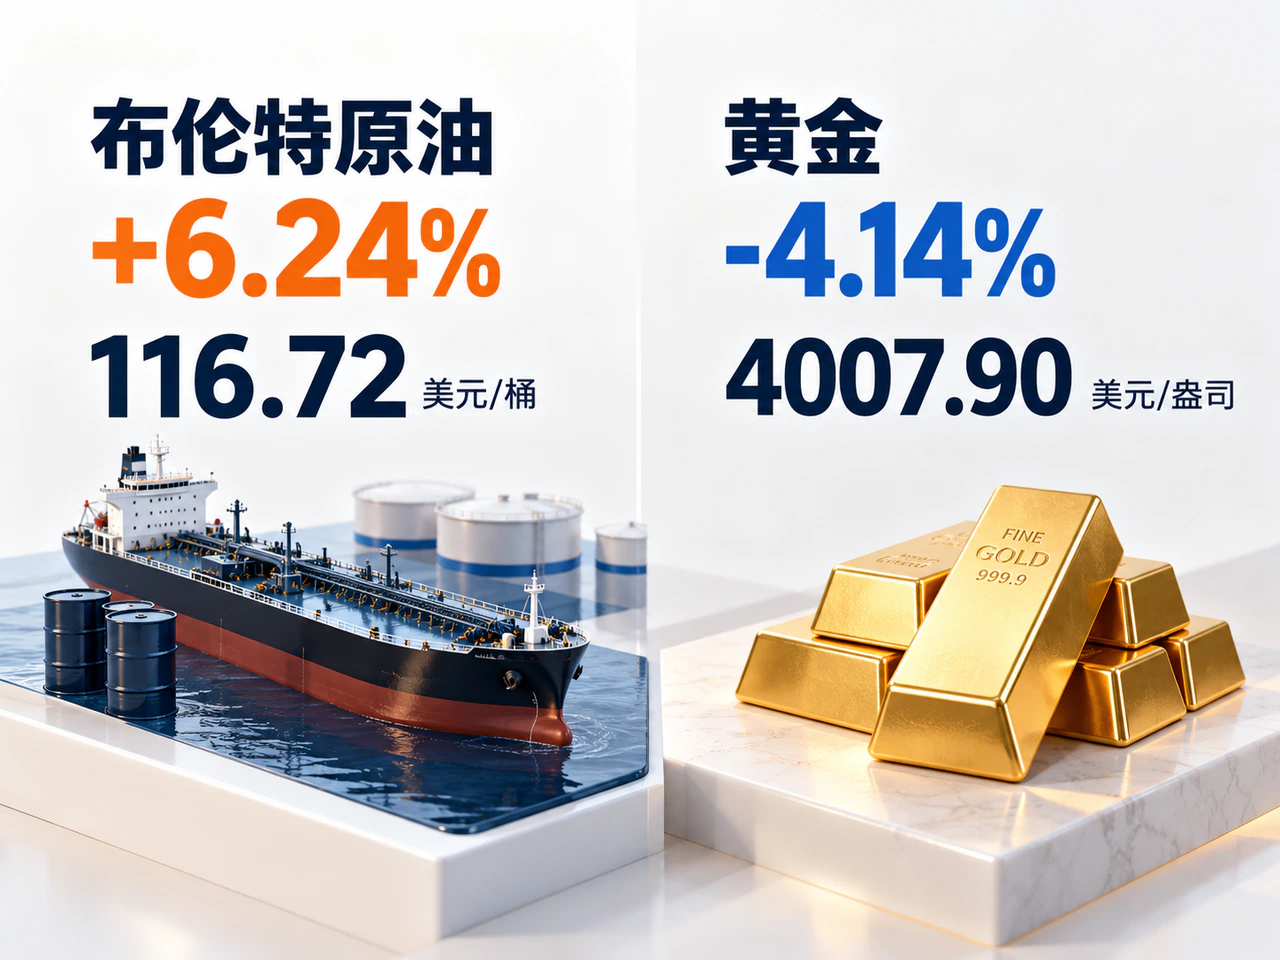
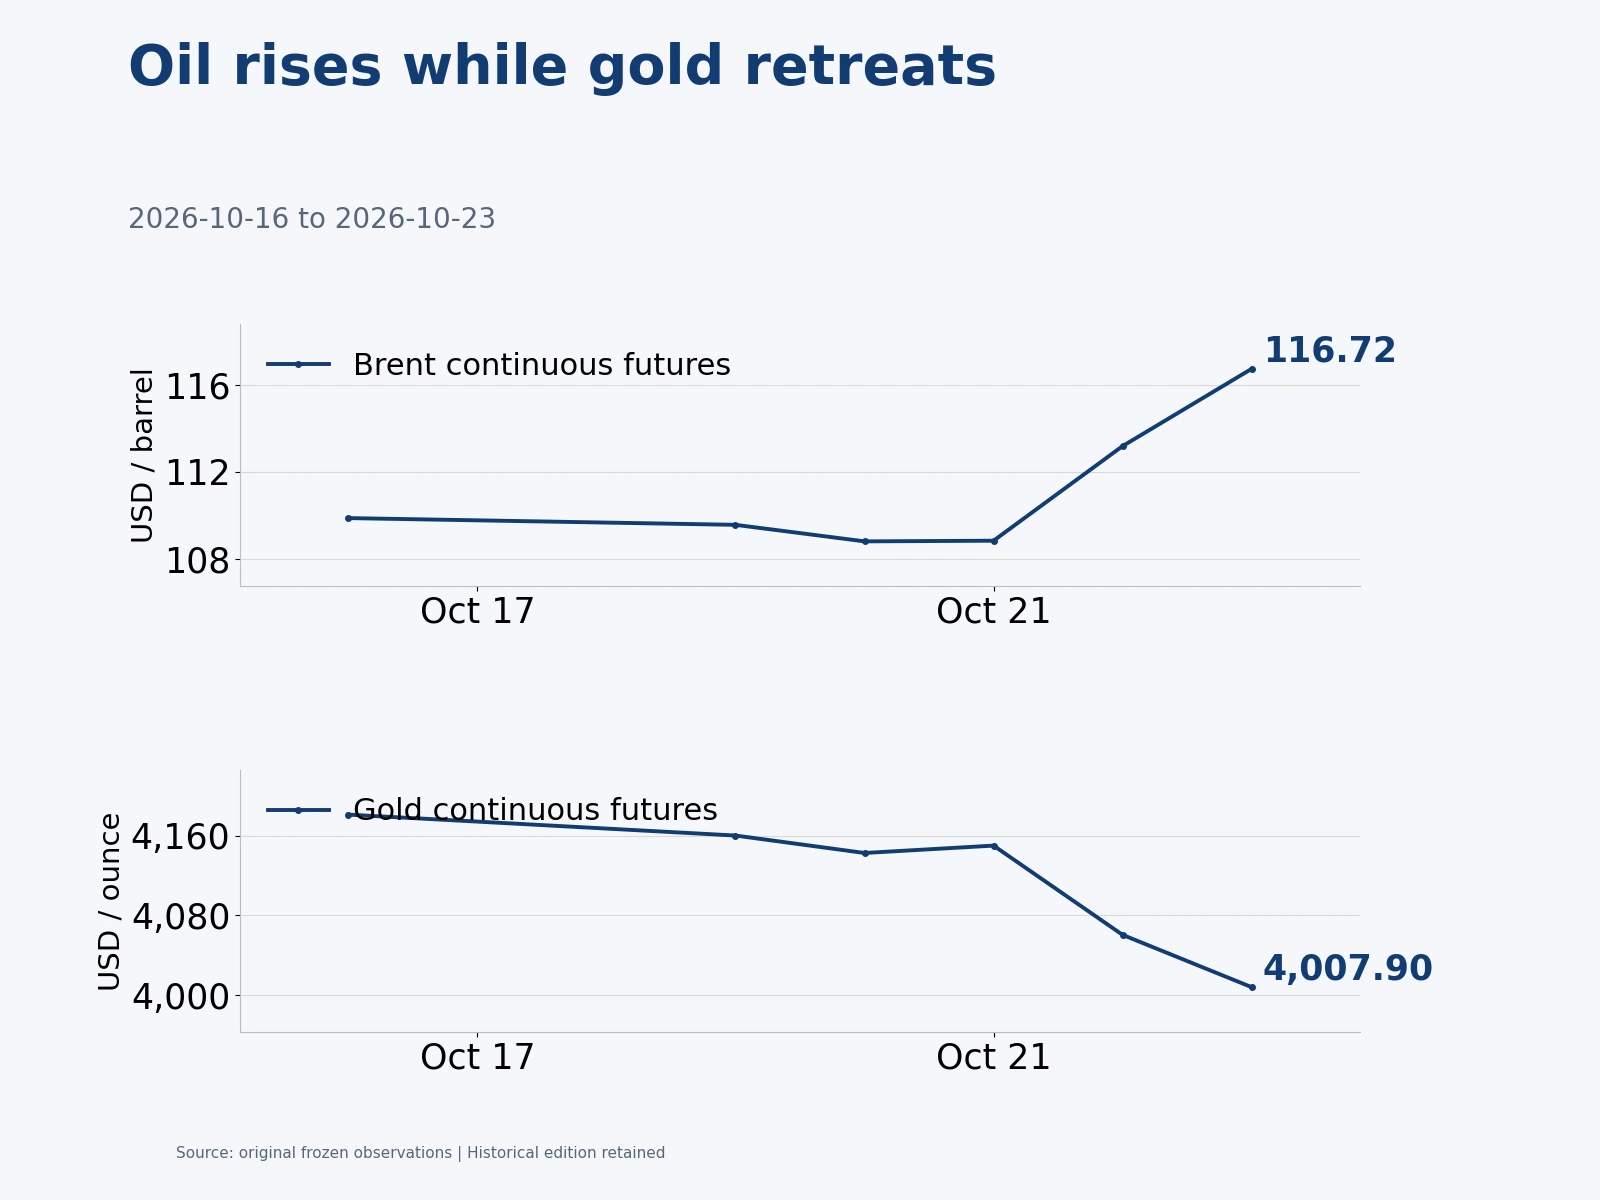
On the continuous-futures daily-close basis, Brent rose 6.24% over the week to US$116.72 a barrel and WTI gained 1.83% to US$103.27. Brent remained near US$109 over the first three trading days, with most of its gains concentrated in the final two. Reports late in the week of attacks on Saudi energy facilities and an oil spill off the UAE coast intensified concerns about energy supply and shipping disruption.
Recovering transport flows provided a supply buffer. The Guardian, citing Kpler, said Persian Gulf oil exports had risen above prewar levels, with some additional flows moving by land pipelines to the Red Sea and Gulf of Oman. People interviewed by Reuters also described increased oil shipments out through Hormuz. Actual supply had improved, but new security risks still led markets to price a greater chance of future disruption.
Falling U.S. inventories supported oil prices. Data released on October 21 for the week ended October 16 showed commercial crude stocks falling by approximately 3.1 million barrels, gasoline by about 3 million, and distillates rising by roughly 1.7 million. The U.S. Energy Department also approved an emergency exchange of up to 400,000 barrels of Strategic Petroleum Reserve crude to address a Louisiana refinery supply disruption. Germany launched tenders to sell reserve petroleum products as well.
Policy on Russian oil provided some relief. Reuters reported on October 19 that the United States granted waivers on some Russia-related sanctions and tariffs that had been scheduled to start that week, easing pressure on India’s energy procurement and trade negotiations. Washington said a trade agreement with India was close, while the relevant investigation and final terms remained unfinished. Energy purchasing options had improved, but rising Middle East supply risks still dominated oil prices late in the week.
Gold continuous futures fell 4.14% over the week to US$4,007.90 an ounce, with losses likewise concentrated in the second half. Over the same period the Dollar Index fell only 0.03% and the 10-year Treasury yield declined nine basis points. American Gold Exchange analyst Jim Wyckoff argued that higher energy prices reinforced inflation pressure and constrained central banks’ room to ease. Margin calls generated by the technology selloff also prompted some investors to sell gold to raise cash. Policy-rate expectations and portfolio liquidity needs jointly affected bullion.
Physical markets offered some buying support. Lower prices during India’s festival season stimulated purchases and raised local premiums. Chinese physical demand was broadly stable, while jewelry consumption remained cautious.
Asian equities fall more sharply as China’s domestic-demand recovery remains slow
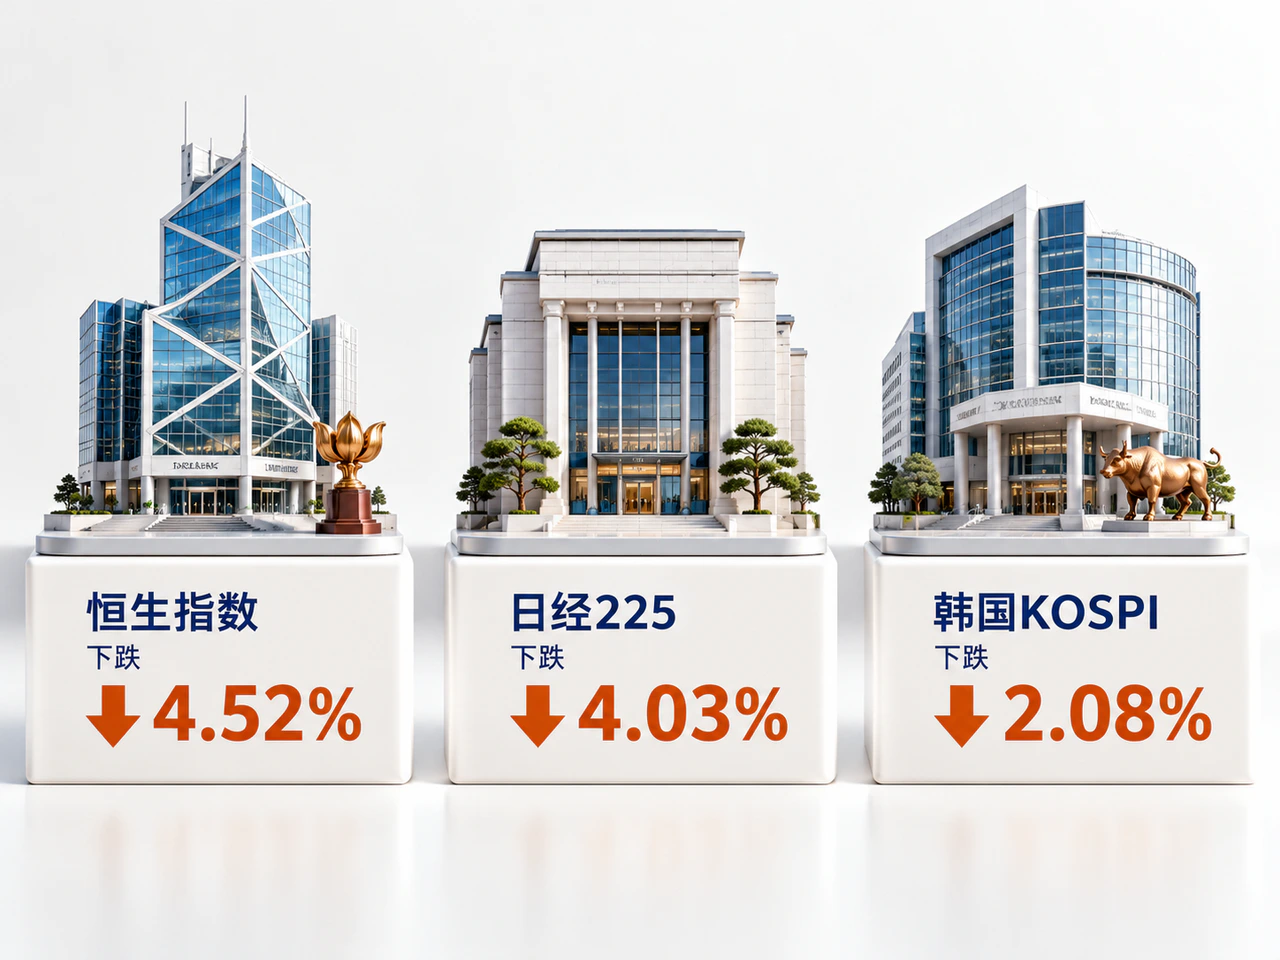
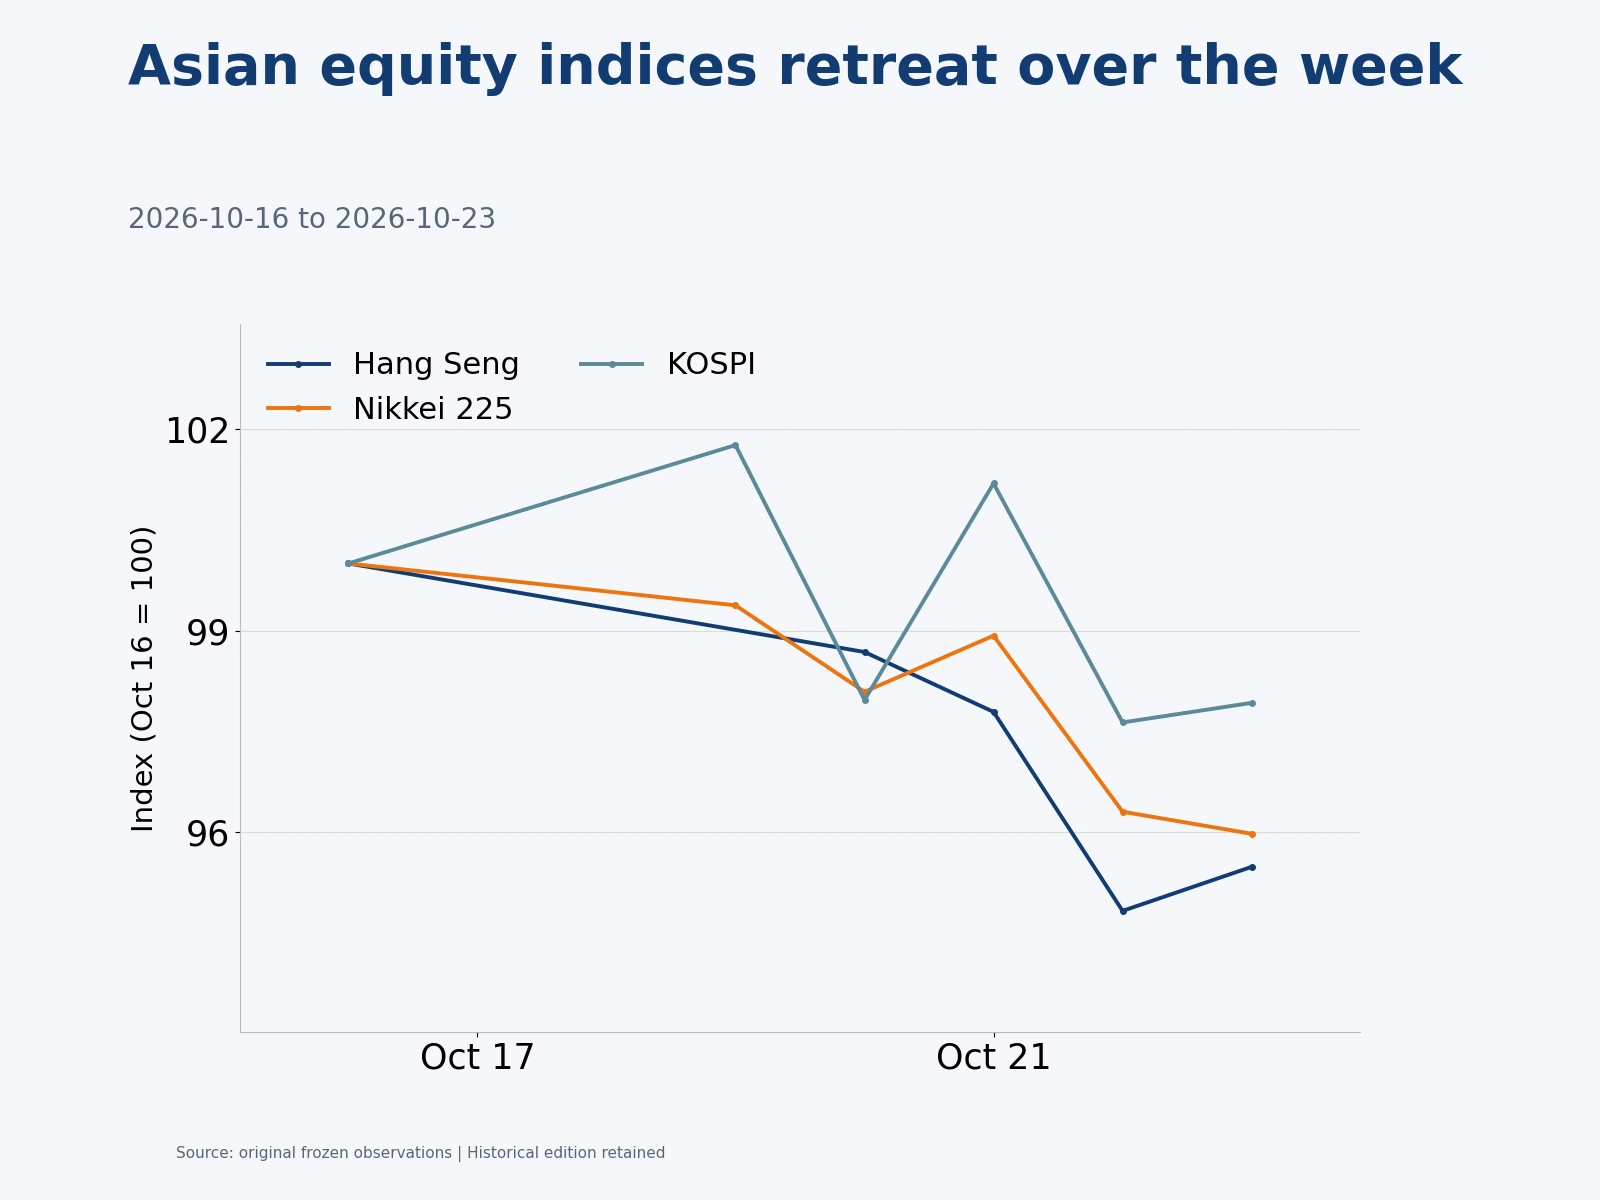
The Hang Seng fell 4.52% over the week, the Nikkei 225 lost 4.03% and South Korea’s KOSPI declined 2.08%, all larger falls than those of the main U.S. large-cap indices. Technology funding and energy costs were the two main transmission channels. Expansion spending and cash returns at Japanese semiconductor-equipment companies, Korea’s memory supply chain and Hong Kong technology businesses faced closer scrutiny, while airlines were affected by higher fuel costs.
SK hynix said on October 23 that Solidigm had stopped assessing pre-IPO financing and a listing because of recent capital-market conditions and share-price changes. The company stressed that expansion needs arising from AI memory demand remained and that it would continue to examine investment timing, scale and financing methods. Demand growth and tighter funding channels were appearing together, making companies’ ability to expand at an affordable cost increasingly relevant to supply-chain valuations.
Cross-border capital rules were also changing funding arrangements. On October 22, the U.S. Treasury published proposed rules for its Outbound Investment Security Program covering semiconductors, artificial intelligence and quantum information, with biotechnology proposed for inclusion. The draft still required public comments and final rules. Its main effects concerned capital availability, transaction-review costs and financing structures; specific technology thresholds and the extent of investor participation would determine the actual impact on individual companies.
Chinese data released during the week showed improving production alongside a slower recovery in domestic demand. Third-quarter GDP grew 4.5% year on year, accelerating from 4.3% in the second quarter. September industrial value added and the services production index grew 5.5% and 4.8%, while retail sales increased 1.1%. Fixed-asset investment excluding rural households fell 7.2% over the first three quarters, leaving consumption and investment in need of demand support. October’s one-year and over-five-year loan prime rates remained 3.00% and 3.50%, respectively. Policy effectiveness depended increasingly on how quickly existing funding reached real economic activity.
General public-budget revenue rose 5.1% year on year in the first three quarters, while expenditure increased 1% and local expenditure only 0.2%. New special-purpose bond issuance in September was RMB 633.9 billion, up RMB 214.8 billion from a year earlier. Issuance in the first three quarters had used 81% of the annual quota, while issuance under the RMB 6 trillion hidden-debt refinancing limit had reached 98.3%. Special-purpose bonds mainly supported project construction; debt swaps released fiscal capacity by reducing interest and repayment pressure. Their transmission proceeded at different speeds, so future growth depended on how quickly funding became actual expenditure, construction and household demand.
French budget pressure keeps sovereign-bond performance divided
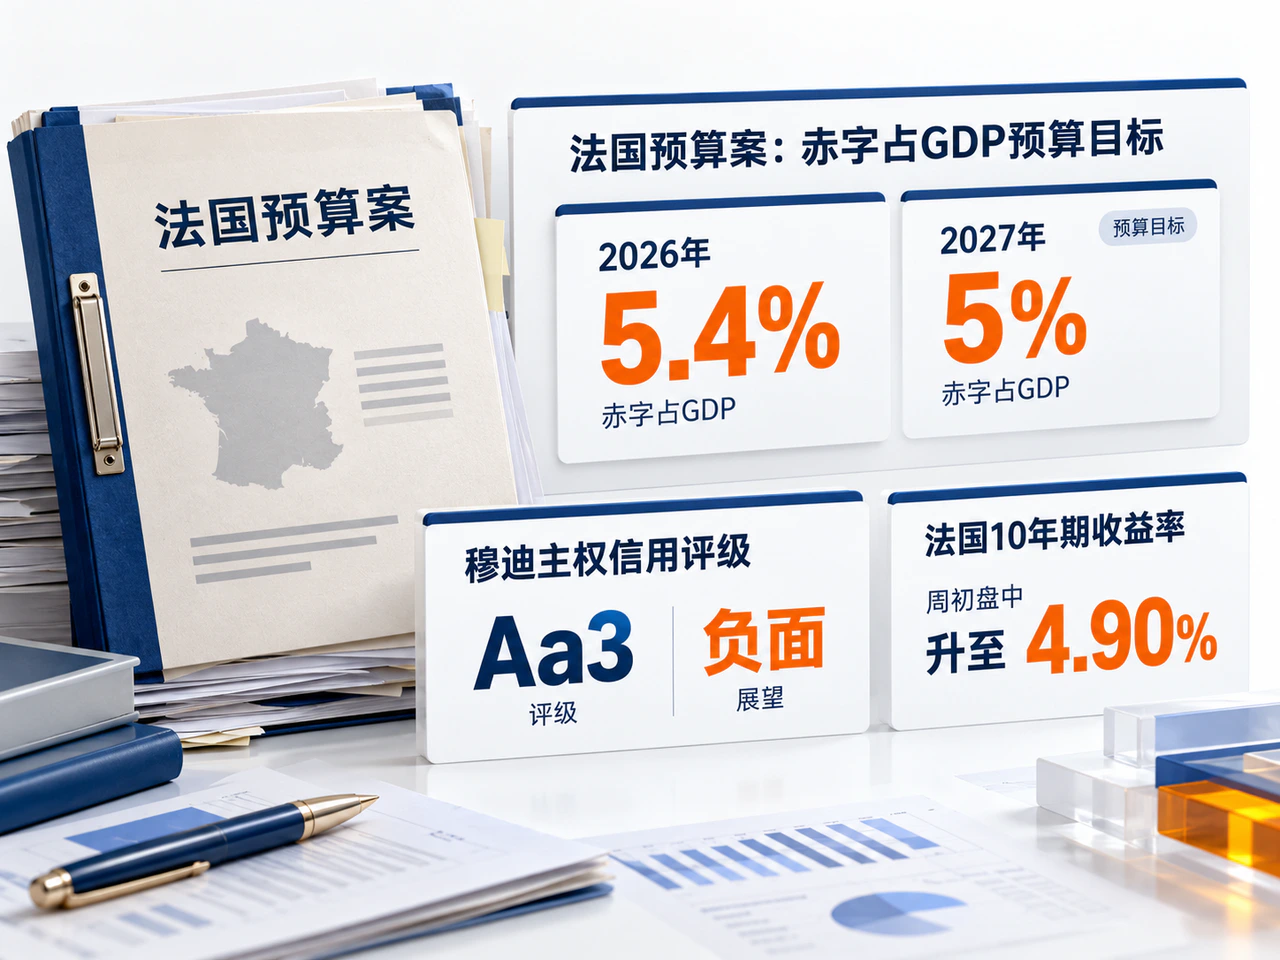
While U.S. Treasuries rallied, French government bonds remained under pressure from budget execution. Reuters reported that France’s 10-year yield rose intraday to 4.90% early in the week and briefly reached 5.14% on Thursday. The French–German spread widened to a 15-year high. The budget proposed reducing the deficit from 5.4% of GDP in 2026 to 5% in 2027, but some spending-cut provisions had already been removed during parliamentary scrutiny. Whether fiscal consolidation could be implemented became an important source of financing risk.
After European and U.S. equities closed on Friday, Moody’s affirmed France’s Aa3 rating with a negative outlook. This eased concern about a downgrade in that review, while attention remained on the 2027 deficit-reduction budget and financing costs. The divergence between U.S. and French government bonds in the same week showed that sovereign debt’s protective role still depended on the issuer’s fiscal position and market liquidity.
The scale of corporate financing, energy costs and the ability to execute fiscal plans were the three main angles through which markets reassessed growth prospects. Resilient U.S. orders and employment continued to support the earnings base, while investors placed greater weight on the cost of producing growth and when cash flow would materialize. The following week’s data and earnings would continue to test whether those two sides could be balanced.


