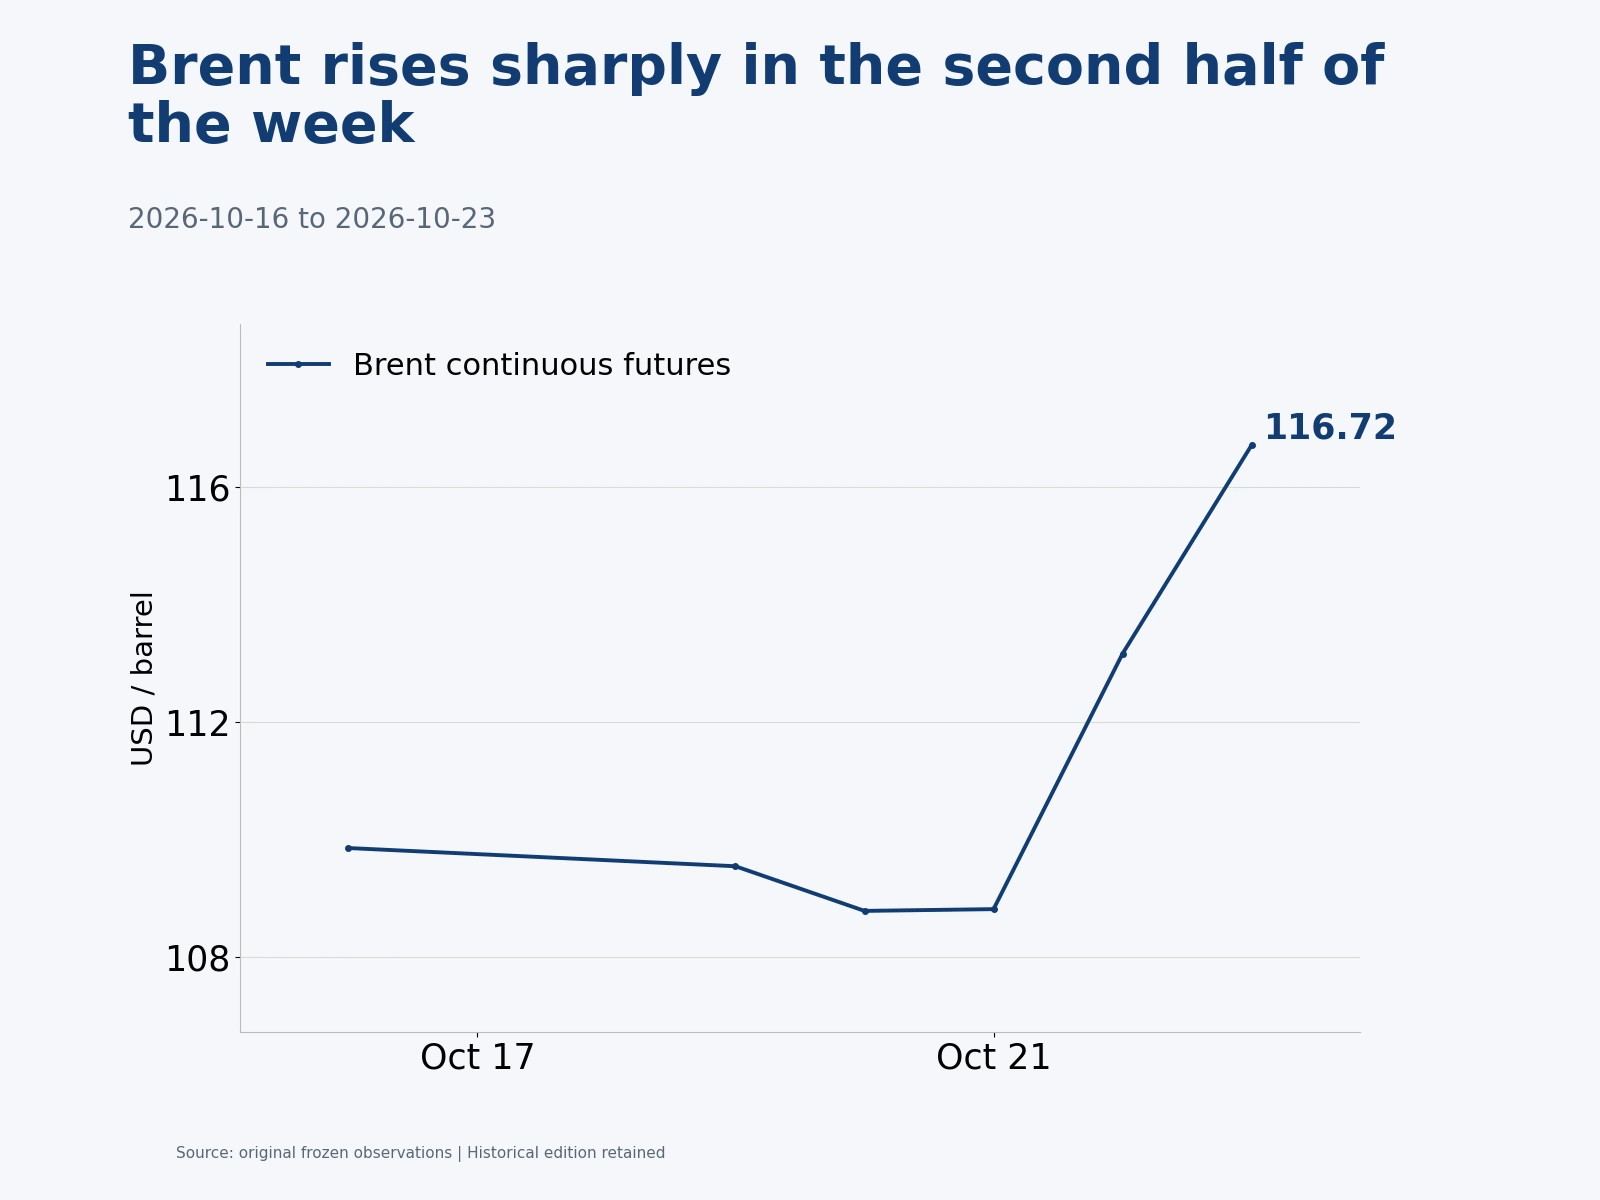
During October 19–25, international oil prices rose even though Middle East crude exports had recovered above prewar levels. Elevated tanker freight rates and a renewed risk of attacks on energy facilities in the latter half of the week continued to support prices. Using Yahoo’s vendor daily closes for continuous futures contracts, Brent ended October 23 at US$116.72 a barrel, up 6.24% from the previous Friday; WTI closed at US$103.27, up 1.83% over the week. Brent hovered near US$109 early in the week before climbing sharply on Thursday and Friday as Middle East security risks intensified. The U.S. Dollar Index slipped only about 0.03% over the same period, leaving changes in financial conditions with limited explanatory power. Physical delivery costs and the safety of shipping routes remained the central tensions driving pricing.
Middle East exports recover to 17.3 million barrels a day, while extreme freight rates and attacks still constrain delivery

A Reuters column on October 22, citing Kpler, put Middle East oil exports in October to that point at 17.3 million barrels a day. That exceeded both September’s 16.4 million and the 16.9 million average in the two prewar months. Flows through the Strait of Hormuz had recovered from 9.75 million barrels a day in September to 11.7 million, about 82% of their prewar level. Exports from Saudi Arabia’s Red Sea port of Yanbu had also recovered to approximately 3 million barrels a day.
The recovery in export volumes relied primarily on escorts, route changes and producers taking greater responsibility for delivery. Refiners’ actual acquisition costs and delivery reliability had not improved in parallel. Reuters reported that benchmark freight for a tanker carrying about 2 million barrels from the Middle East to China remained near US$1.4 million a day, more than 12 times the prewar rate. Some Gulf producers had begun selling delivered cargoes to Chinese and Indian customers and sharing the high logistics cost with buyers through price discounts.
The risk of Middle East supply disruption increased again in the second half of the week. Reuters reported on October 23 that Houthi attacks on Saudi Arabia involved energy facilities and that Saudi Aramco had requested the evacuation of its Dhahran headquarters the previous day. Authorities in the United Arab Emirates also reported a coastal tanker oil spill; the cause and vessel involved had not been disclosed. Security threats thus affected both Gulf shipping lanes and alternative export routes via the Red Sea. With Hormuz flows still below a full recovery, disruption of the Red Sea alternative would weaken the logistics buffer that had only recently been established. Buyers were concerned not only with the volume currently being loaded but also with paying more to protect against delays to subsequent shipments.
U.S. commercial crude draws exceed expectations at 3.06 million barrels; mixed product stocks and emergency releases provide a buffer
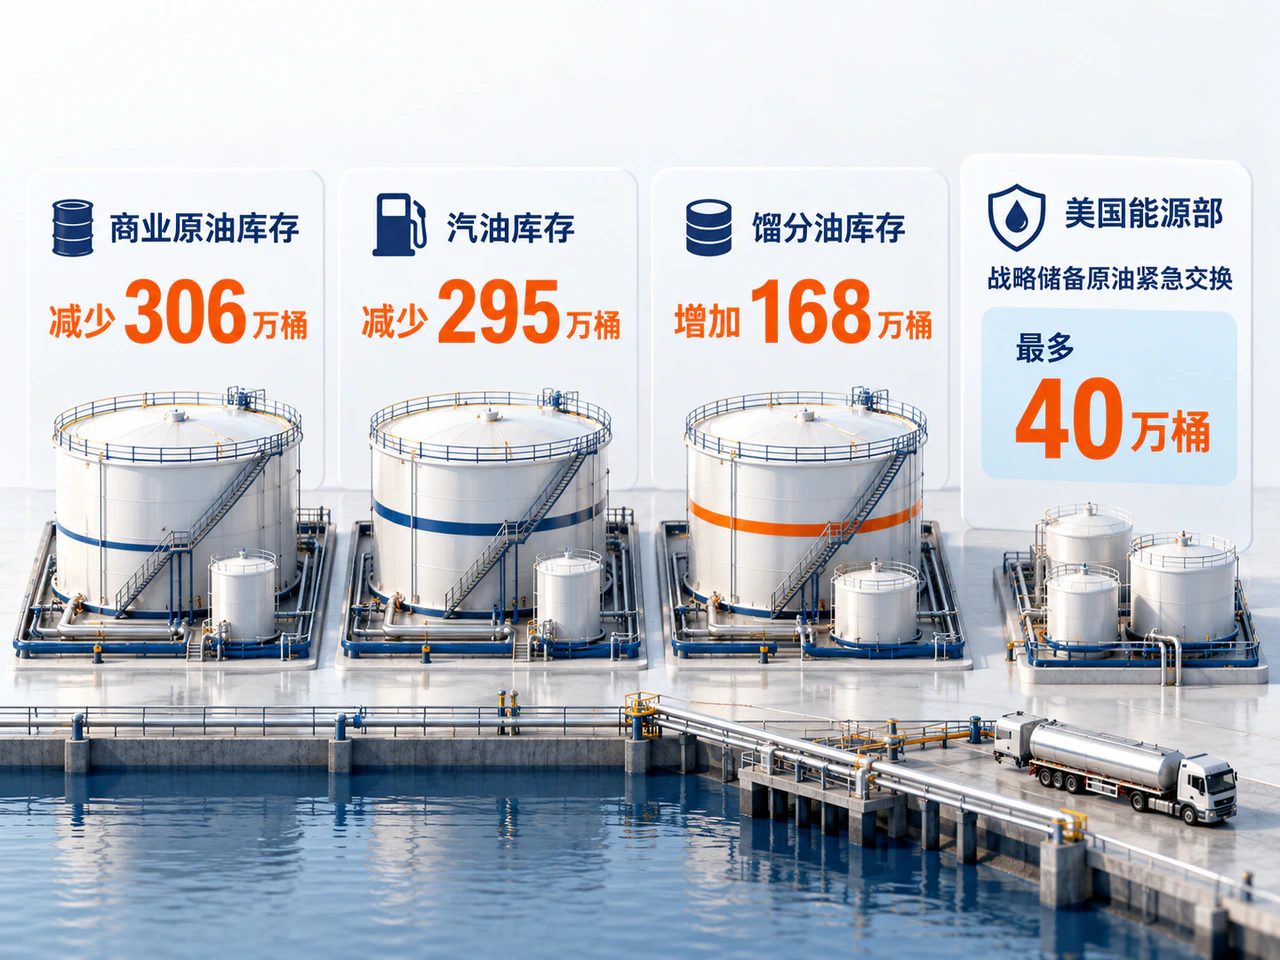
U.S. inventory draws offered another layer of support. EIA data released on October 21 for the week ended October 16 showed commercial crude stocks falling by 3.06 million barrels to 412.5 million, far more than the 820,000-barrel draw expected in a Reuters poll. Gasoline inventories fell by 2.95 million barrels to 205.3 million. U.S. net crude imports increased by 837,000 barrels a day that week, yet commercial stocks still declined substantially, indicating that the weekly supply-demand balance continued to consume reserves.
Inventory details and policy measures nevertheless provided some relief. The same EIA report showed Cushing crude stocks rising by 987,000 barrels and distillate stocks increasing by 1.68 million barrels to 104.3 million. Refinery utilization edged down 0.1 percentage point to 93.4%. While crude and gasoline draws supported prices, inventory accumulation at the delivery hub and a recovery in diesel and heating-oil stocks eased some pressure. Reuters reported that Germany’s oil stockpiling agency had launched tenders that week to sell diesel, heating oil and crude. The U.S. Energy Department authorized an emergency exchange of up to 400,000 barrels of Strategic Petroleum Reserve crude to address a supply disruption at a Louisiana refinery. Such measures could improve deliveries in specific locations, but their lasting effect would depend on release speeds and the recovery of logistics.
WTI’s first-to-twelfth-month backwardation reaches US$21.73 as markets await the November 1 OPEC+ meeting

Tight physical and logistics conditions were directly visible in the futures curve. Morgan Downey’s Oil 101 curve compilation showed both WTI and Brent in backwardation on October 23, with near-month prices above later delivery months. WTI’s first-to-twelfth-month spread was approximately US$21.73. Steep backwardation encouraged holders to sell oil sooner and showed the higher premium being paid for crude available for near-term delivery. Lower deferred prices left room for a subsequent supply recovery and demand adjustment.
The next key supply-policy event was the November 1 meeting of seven OPEC+ countries. Their previous official decision, on October 4, was to keep November output at the level required for September. In the prevailing conditions, quotas were only one part of supply: restoring actual deliveries also required production, loading and safe passage to work together.
Four sets of signals would determine whether the rally continued: whether exports through Hormuz and Yanbu could keep recovering despite increased attacks; whether high freight and delivery costs would ease; whether U.S. commercial crude and gasoline draws continued and distillate replenishment persisted; and whether the near-month premium over deferred contracts narrowed. Stable cargo flows, lower logistics costs and stock rebuilding would weaken near-term support for high prices. Renewed export constraints and further inventory declines would instead keep supply risk at the center of oil pricing.


