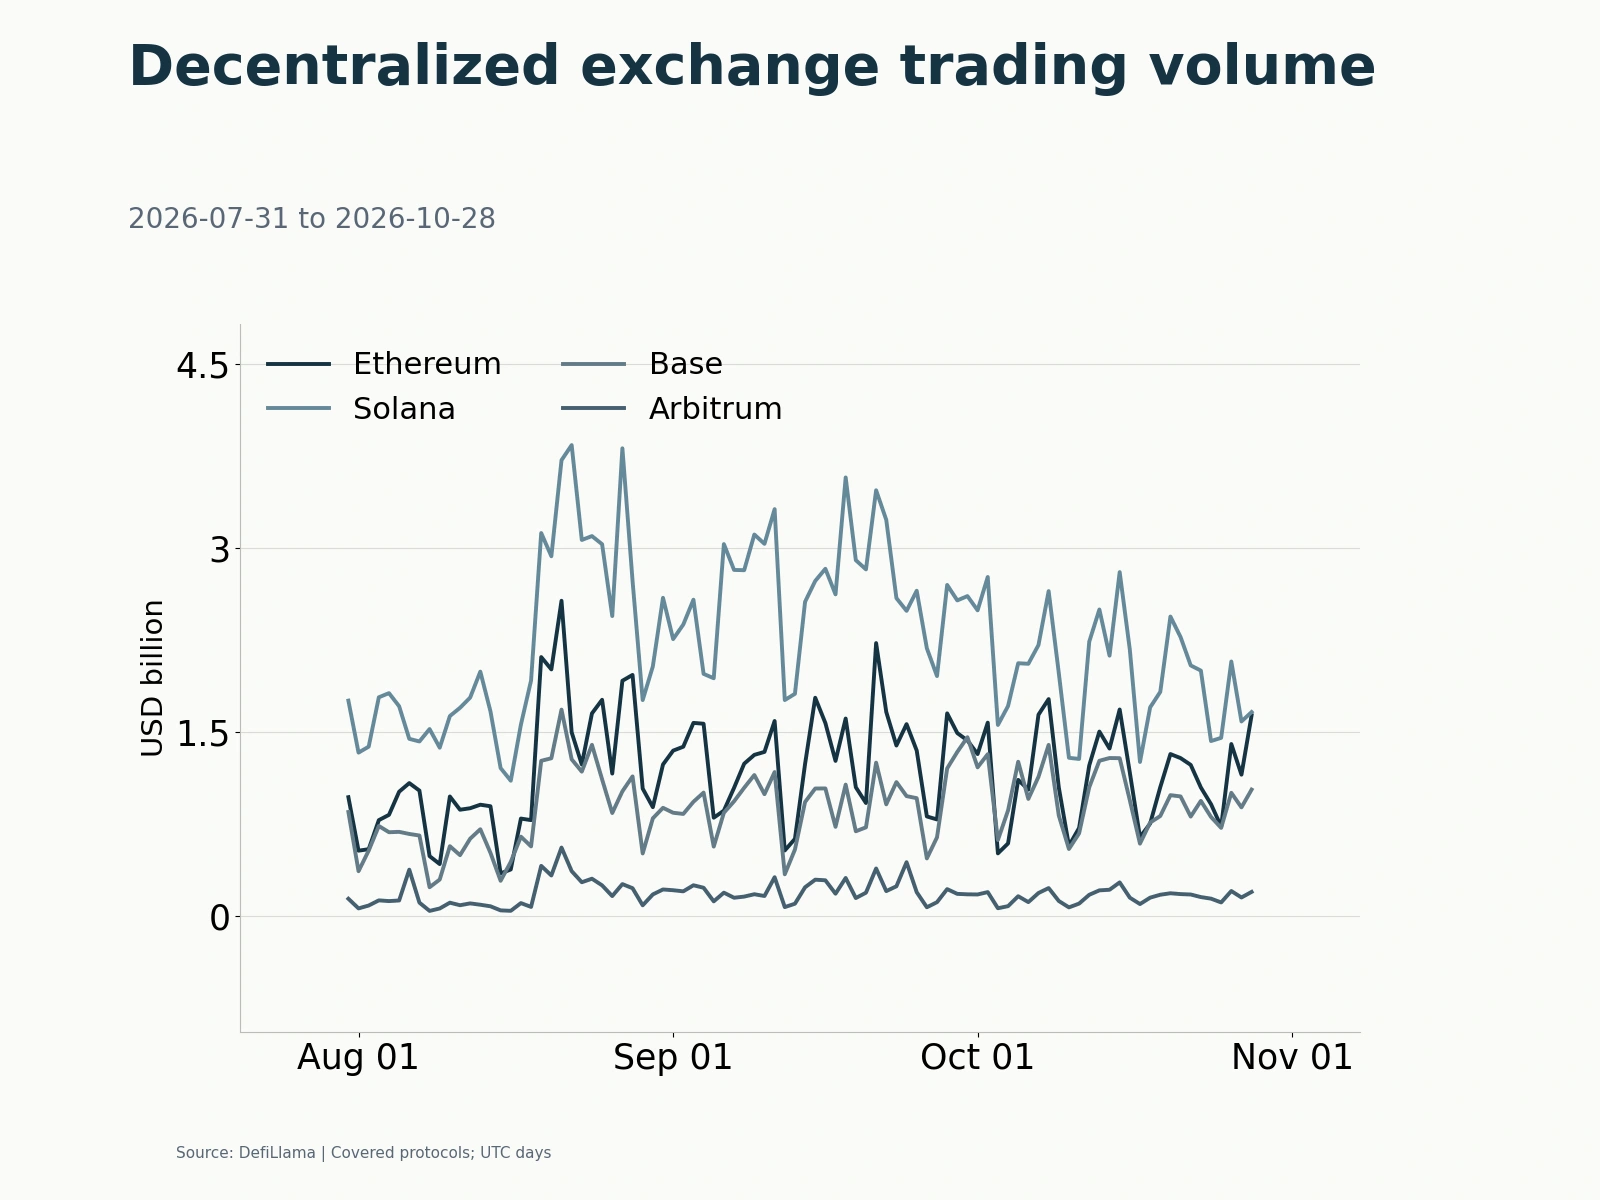
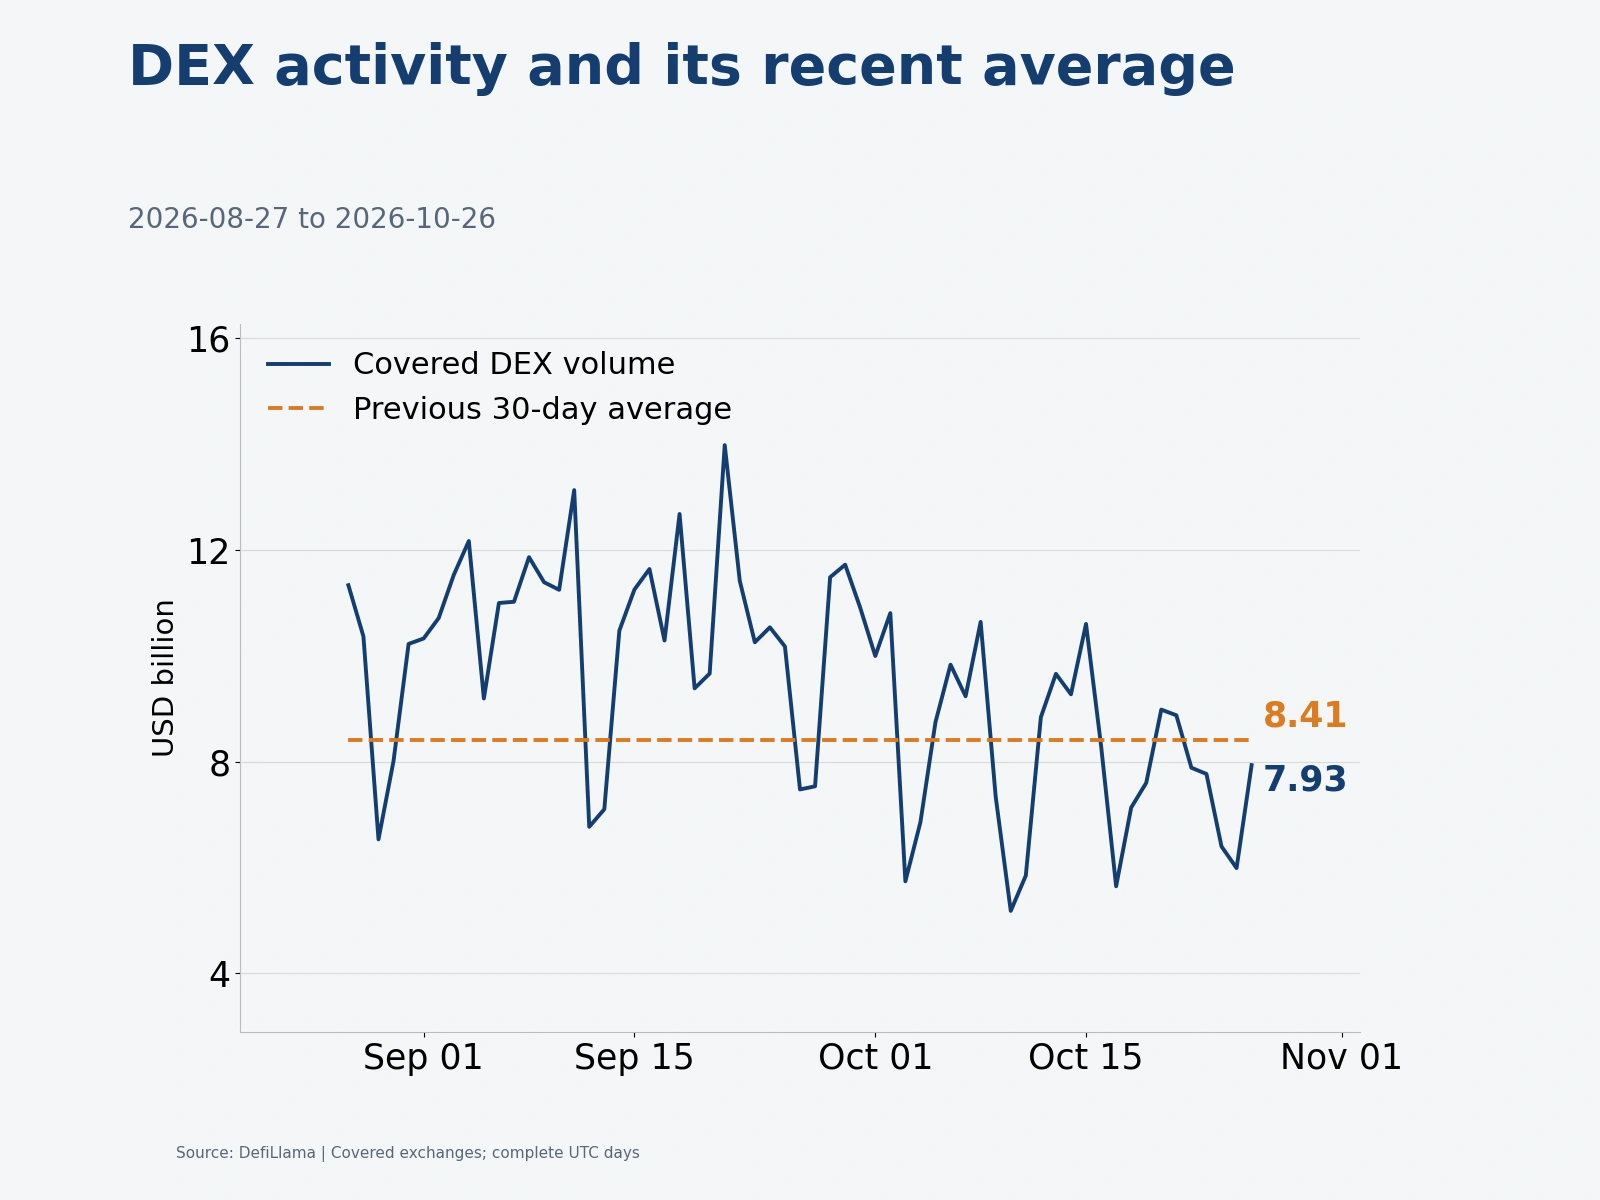
On October 26, measured by UTC daily observations available on the morning of October 27 Beijing time, on-chain trading rebounded from weekend lows. Across decentralized exchanges (DEXs) covered by DefiLlama, total daily volume rose to US$7.934 billion, up 32.5% from the preceding day but still approximately 5.7% below the previous 30-day average.
The recovery was uneven. Trading on Ethereum mainnet and some layer-2 networks returned above recent averages first, lending-protocol fees changed more moderately, and traditional payment and financial institutions continued incorporating stablecoins into existing settlement processes. Trading, borrowing and payments together increased on-chain activity, but the resulting cash flows went to different participants: liquidity providers, protocol treasuries, stablecoin issuers and service providers controlling end-customer relationships. Growth in business activity did not translate directly into protocol revenue growth.
Ethereum-related networks move above 30-day average volume; lending fees lag trading fees
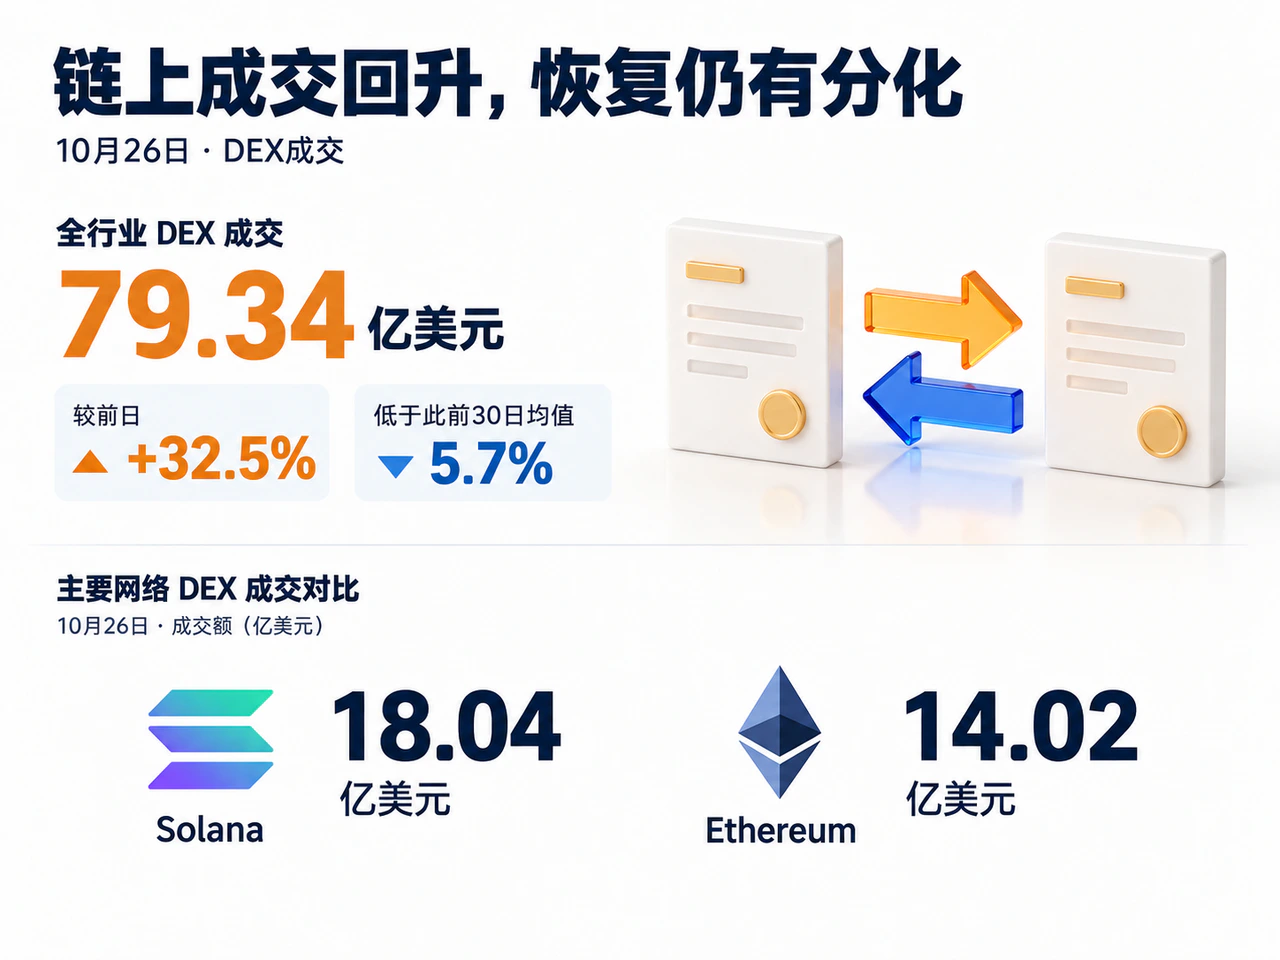
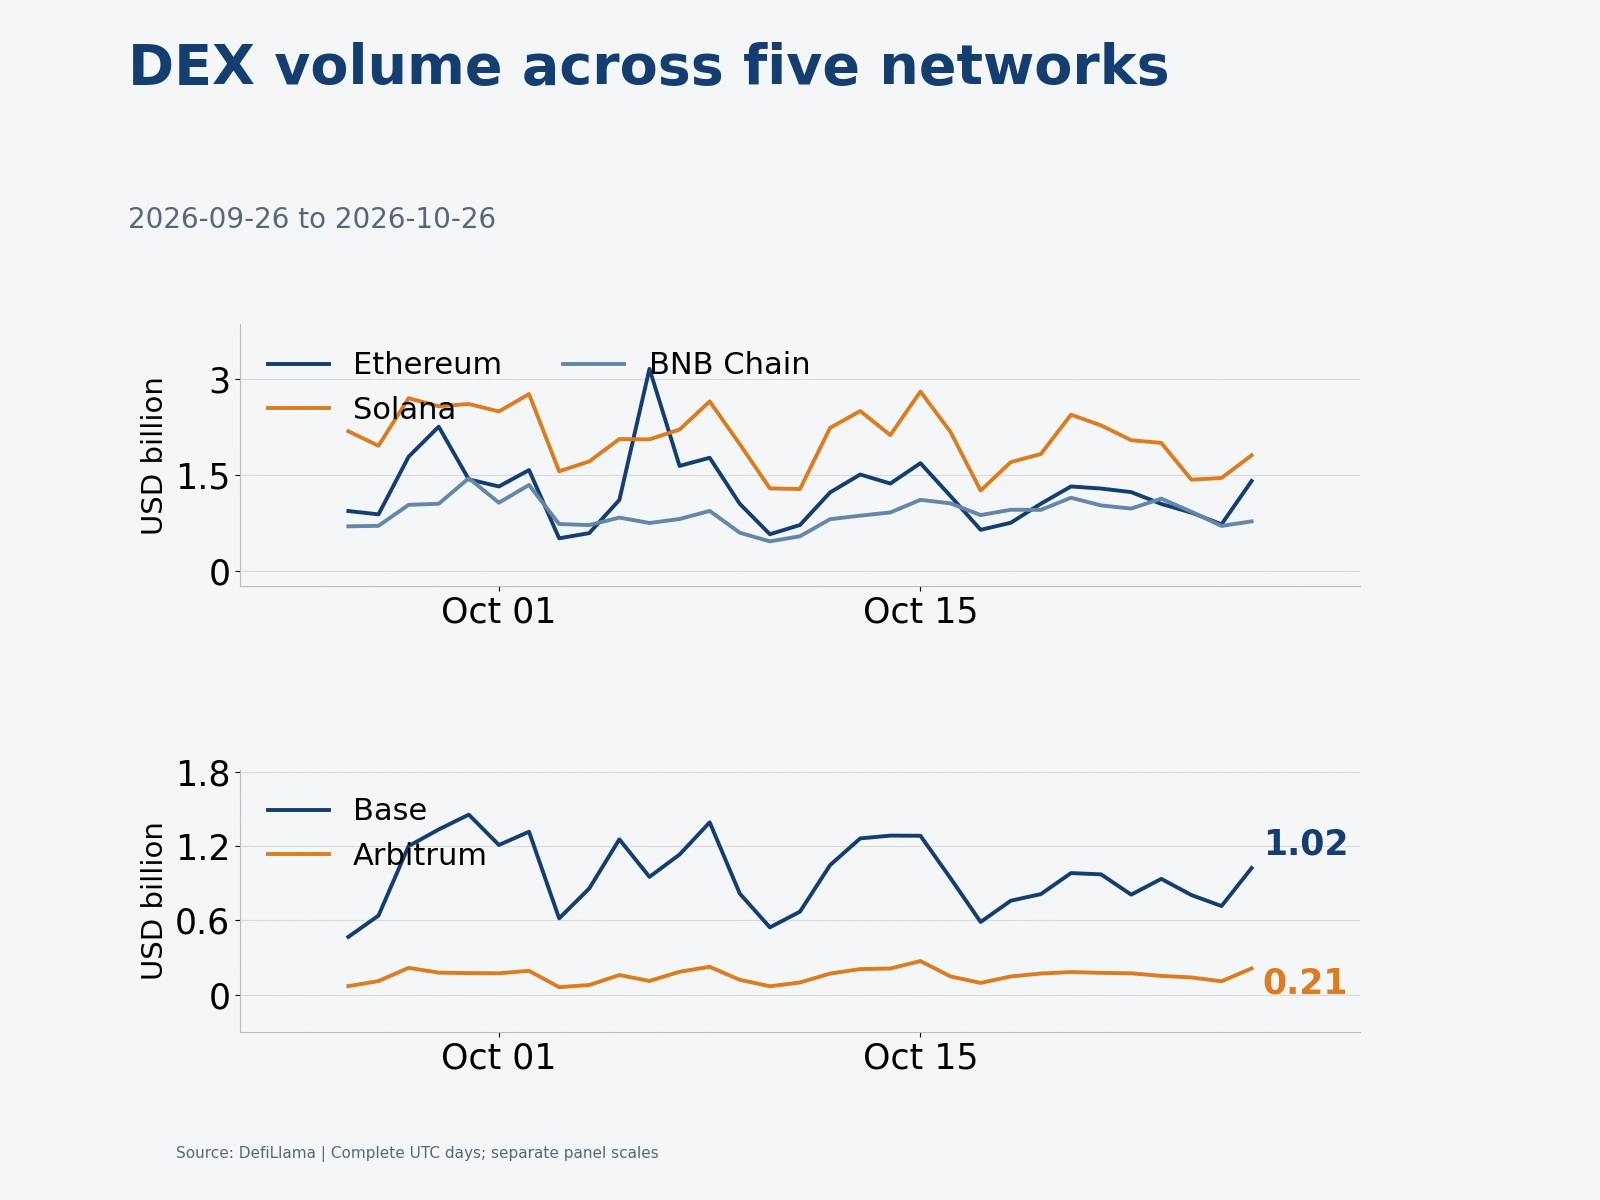
On October 26, DEX volume recovered across all five major chains and layer-2 networks in the sample, led in percentage terms by Ethereum and Arbitrum. Ethereum recorded US$1.402 billion, up 93.2% from the preceding day. Arbitrum and Base reached US$211 million and US$1.023 billion, rising 96.4% and 42.9%, respectively. Solana volume was US$1.804 billion, up 24.5%, while BNB Chain recorded US$772 million, up 10.2%.
Sunday’s low base amplified the daily rebound. Comparing volume with the 30-day average from September 26 through October 25 gave a better indication of the extent of recovery. Arbitrum, Ethereum and Base were 39.3%, 13.3% and 5.6% above their respective 30-day averages, moving above recent average trading levels. Solana and BNB Chain remained 13.0% and 14.4% below their averages. Even so, Solana’s absolute volume of US$1.804 billion remained the largest among these five samples.
The trading revival directly raised fees at leading exchanges, while fees from outstanding lending changed more moderately. Under each protocol’s statistical definition, Uniswap V3 trading fees reached US$1.0642 million that day, up 80.9%; Uniswap V4 generated US$1.0589 million, up 43.8%. Aave V3 fees were US$1.1141 million, up just 0.6%, while Morpho Blue fees were US$815,500, up 10.4%. Lending fees can include liquidation-related and other items alongside interest.
Beyond trading and lending, institutional payments and asset settlement were also moving into on-chain production environments. In its October 26 Money20/20 observations, BitGo said Visa had moved USDC prefunding arrangements from pilot to production, while recipients still received funds through their existing bank accounts or cards. JPM Coin was also expanding from its existing network to Ethereum mainnet, and tokenized securities were advancing in collateral, repo and settlement applications.
Aave and Morpho retain fees differently; stablecoin payments rise 90% as revenue sharing spans more stages
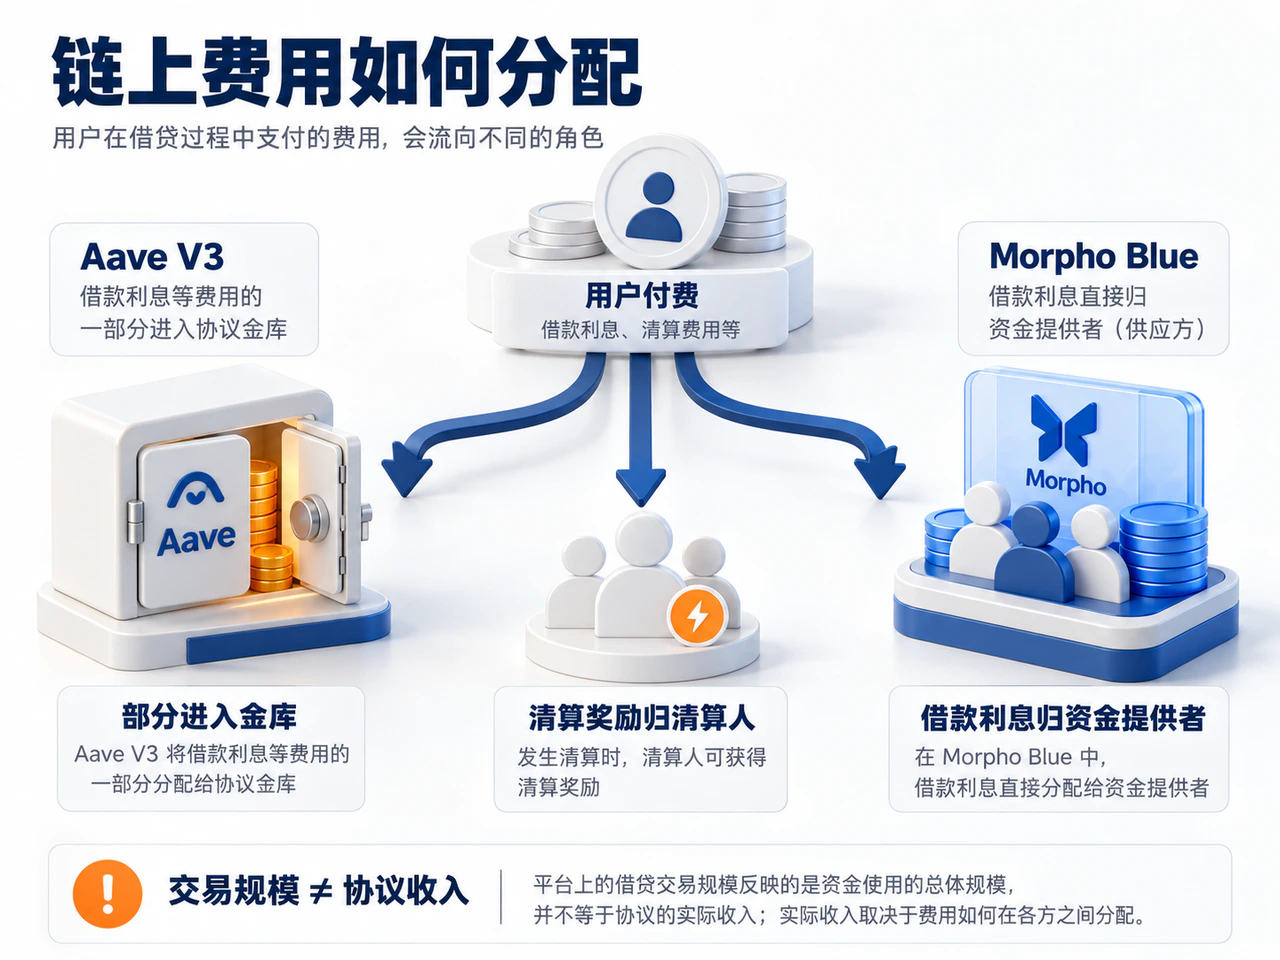
Whether recovering on-chain activity becomes sustainable operating revenue depends on how fees are allocated in each business. Trading volume measures asset turnover; user-paid fees represent the cost of use; and the revenue ultimately retained by a protocol must pass through several layers of distribution.
The lending comparison is particularly direct. DefiLlama’s Aave V3 fee measure includes borrowing interest, flash loans, liquidations and other charges. The portion allocated to the treasury is counted as protocol revenue, while depositor earnings are distributed separately. Under the Morpho Blue definition, all borrowing interest goes to capital providers and liquidation incentives go to liquidators; the statistical adapter records zero protocol revenue. Morpho Blue’s US$815,500 of fees that day therefore represented actual borrowing and liquidation expenditure, but the proceeds accrued directly to lenders and liquidation service providers rather than accumulating in the protocol treasury. Assessing token value requires distinguishing total protocol fees from the amount actually retained by the treasury.
The revenue-sharing chain is longer in payments. BitGo cited Allium data showing adjusted stablecoin payment volume of US$54.1 billion in September, approximately 90% above US$28.5 billion a year earlier. Average stablecoin supply over the same period was US$273.7 billion, only about 4.4% above the prior year’s US$262.2 billion. These monthly figures indicated that payment growth relied mainly on faster turnover of existing funds, rather than necessarily requiring a comparable increase in token issuance.
Fast growth in payment flows nevertheless did not mean the underlying blockchain or a single protocol would capture most of the commercial value. In Visa’s USDC prefunding example, stablecoins mainly addressed the time constraints of moving funds through traditional payment networks at night and on weekends and reduced idle prefunded balances. Customer access, compliance arrangements and final payout channels remained in place. Service fees were distributed among payment networks, wallets, foreign exchange and compliance functions. The blockchain providing underlying settlement was one part of the complete business chain.
From some networks’ daily DEX volumes returning above average to monthly stablecoin payment expansion, assessing the commercial substance of the on-chain economy requires tracing scale of use, user payments and retained revenue in sequence. Whether individual networks can sustain above-average trading, whether total market volume returns above average, who pays the fees and which part of the chain retains the revenue will determine whether recovering on-chain demand truly becomes operating value for the protocols themselves.
Follow the original-article link for further details.