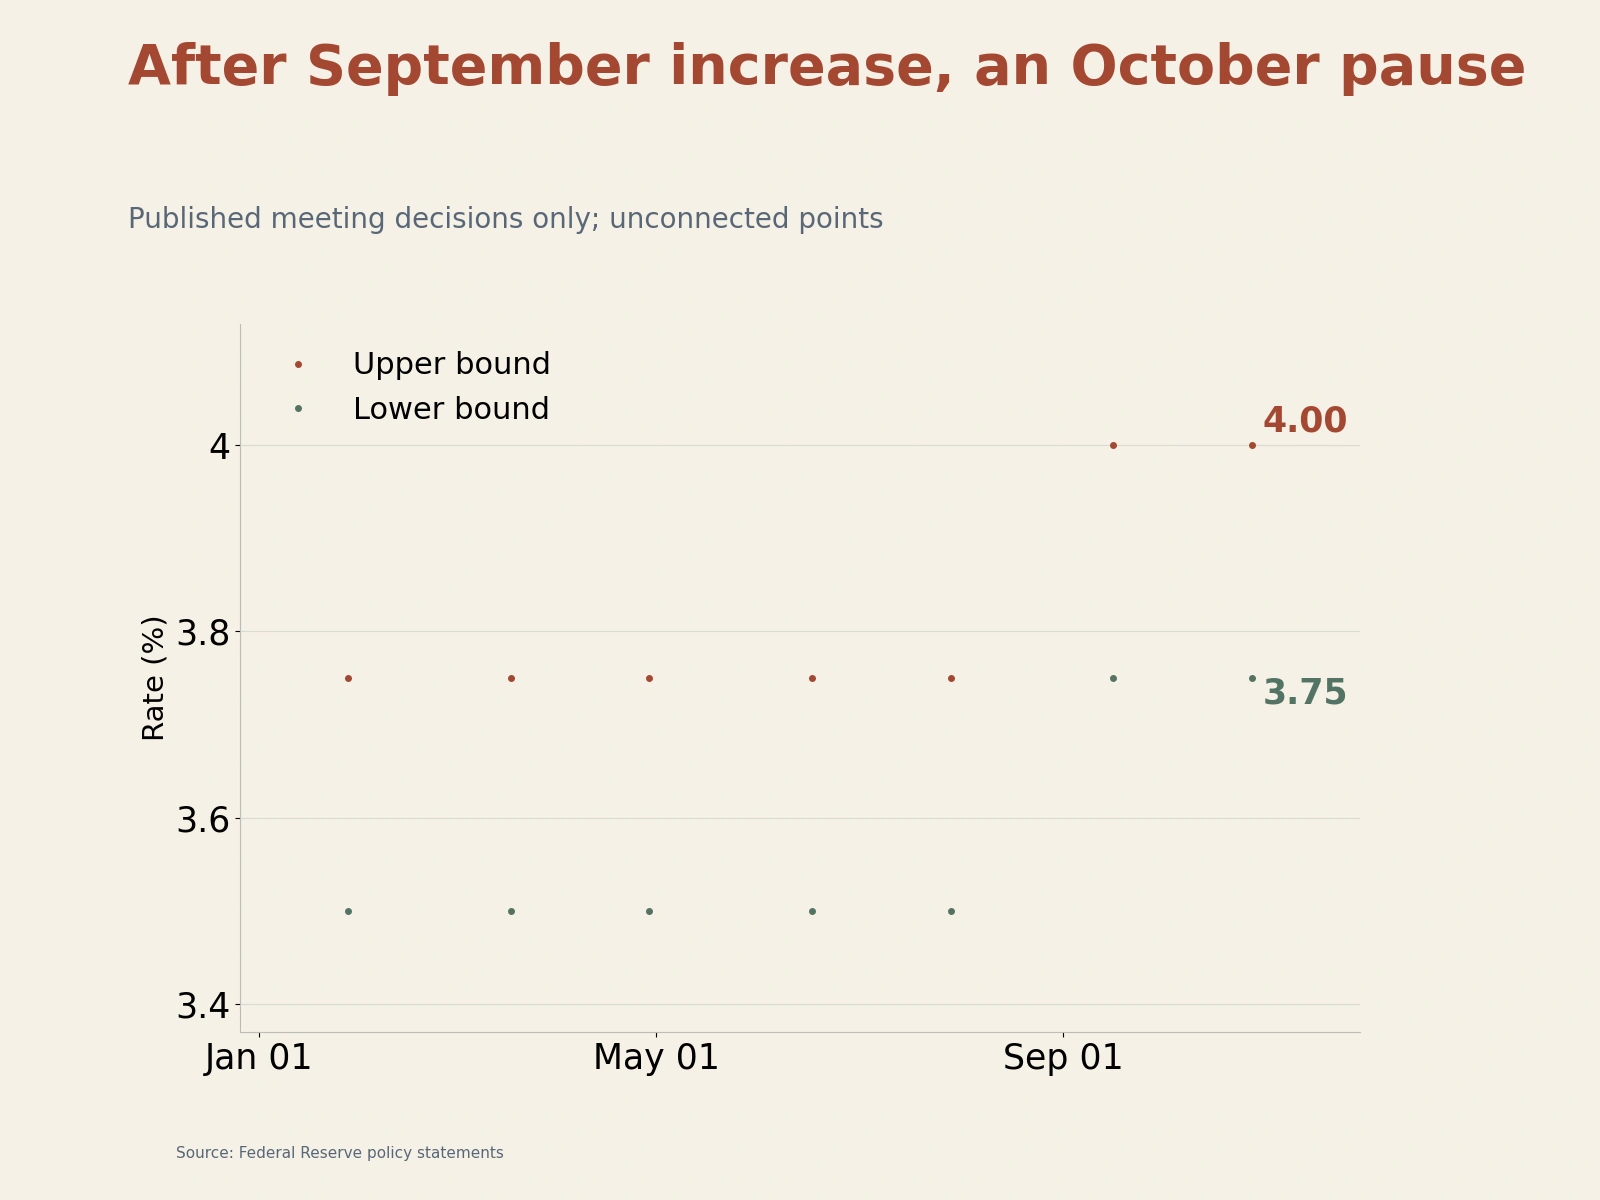
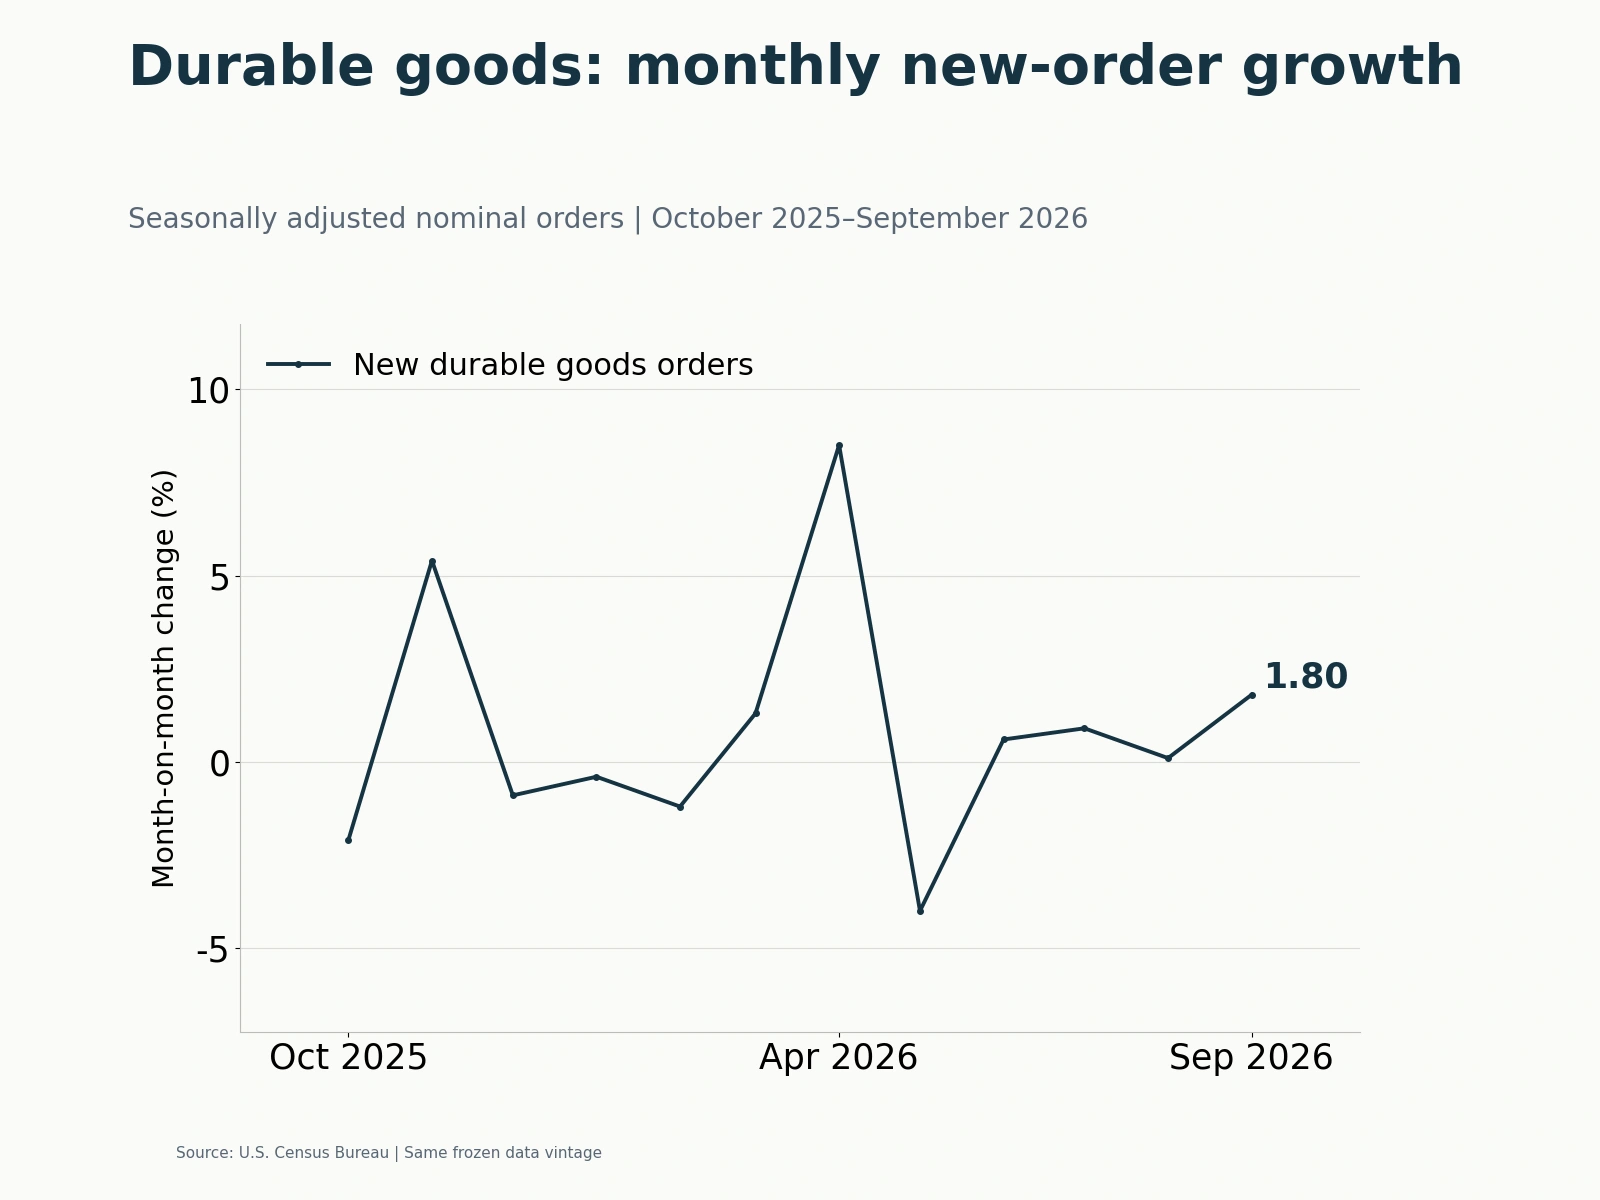
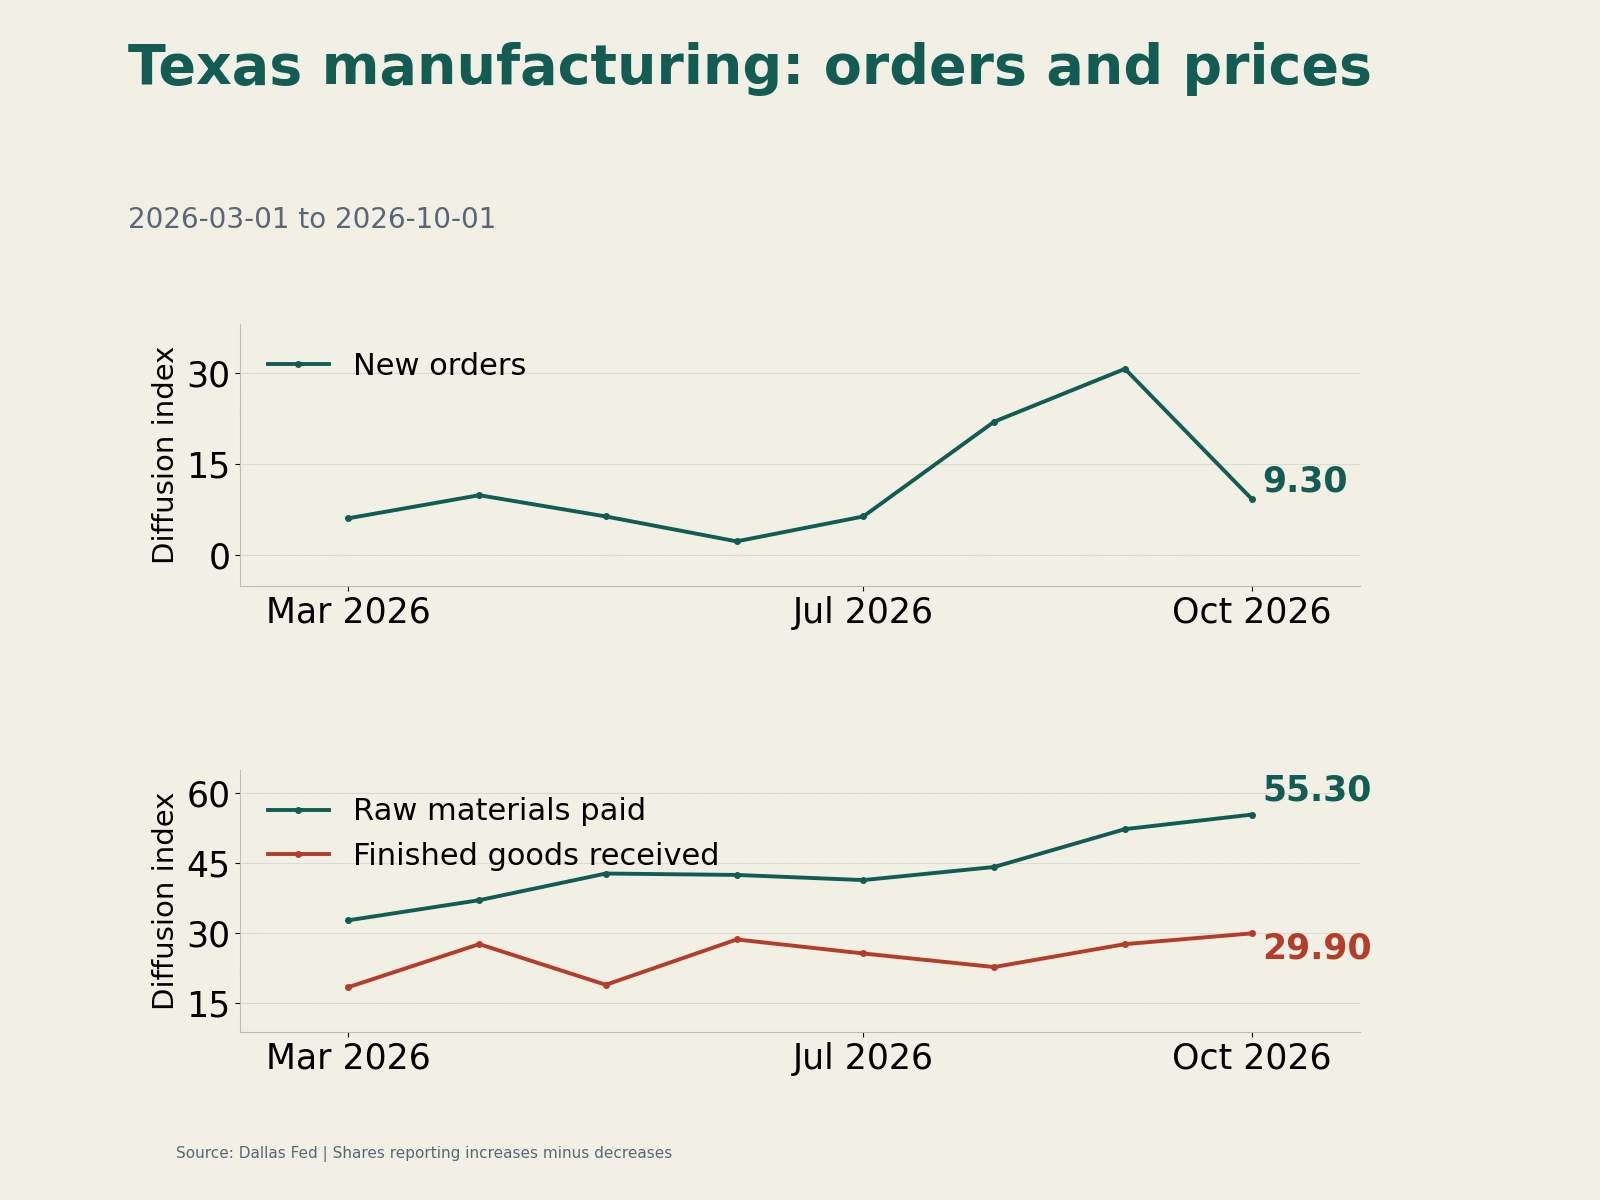
On October 28, 2026, the Federal Reserve voted 10–2 to keep the target range for the federal funds rate at 3.75%–4%, with Cook and Hammack favoring a 25-basis-point increase. The following day, October 29, the U.S. Bureau of Economic Analysis released its advance estimate of third-quarter GDP alongside September personal consumption expenditures (PCE) data: real economic growth accelerated, while monthly inflation remained elevated. For a committee that had just opted to hold rates steady, the releases offered reasons both to remain patient and to stay alert to inflation. They raised the bar for a near-term rate cut, while requiring the Fed to keep assessing whether strong quarterly growth can persist and whether the decline in inflation is sufficiently durable.
Q3 GDP Growth of 3.4% Confirms Resilient Domestic Demand, but September Real Consumption Growth Slows to Less Than 0.1%
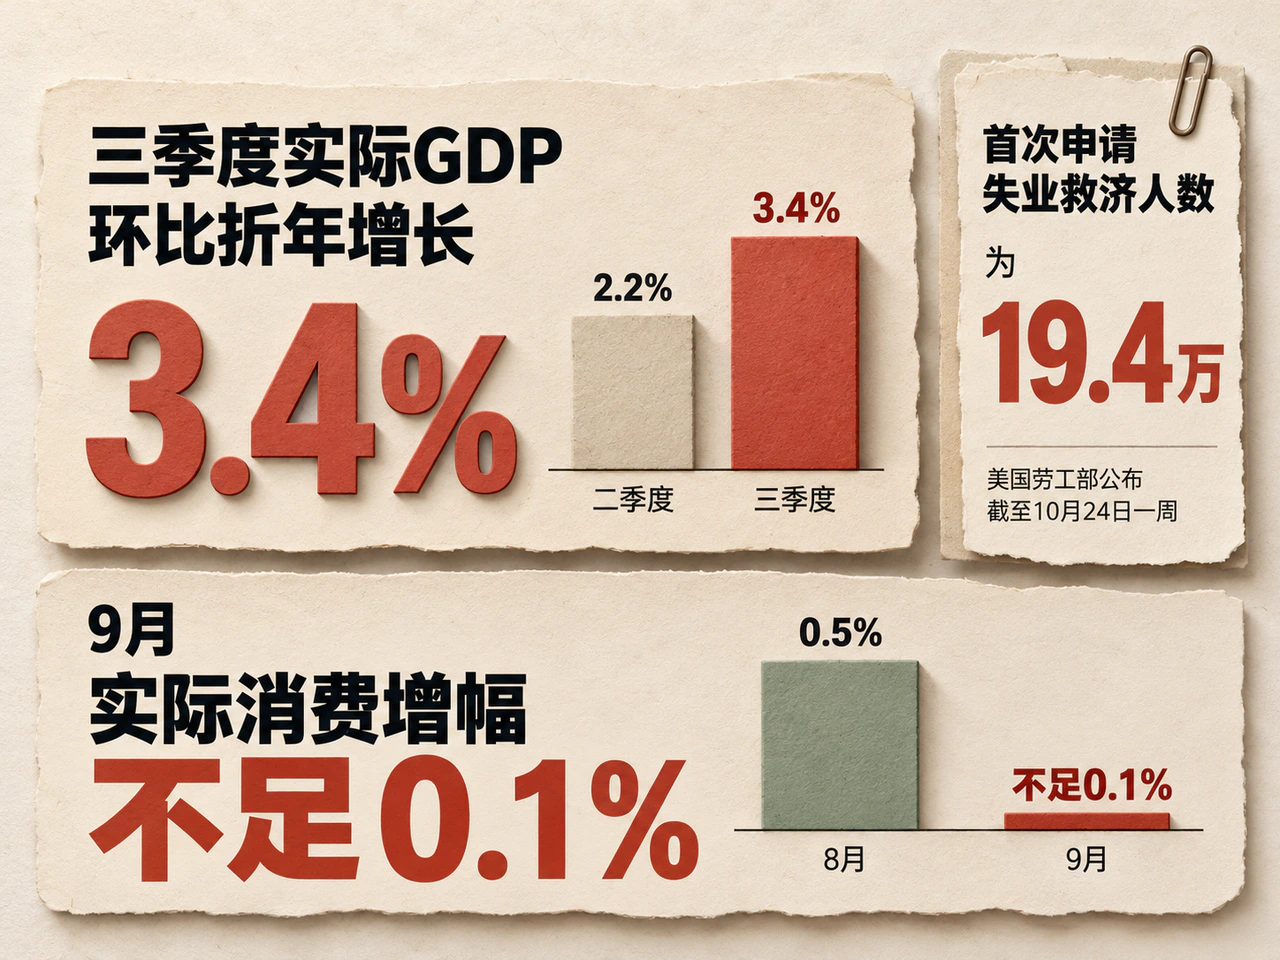
Real GDP grew at an annualized quarter-on-quarter rate of 3.4% in the third quarter, up from 2.2% in the second. Faster investment growth and a rebound in government spending drove the acceleration, while consumption continued to contribute. Excluding inventories, government spending and net exports, real final sales to private domestic purchasers—a measure of consumption and private fixed investment—rose at a 4.9% annualized rate, accelerating further from 4.6% in Q2. Stronger private demand reduced pressure on the Fed to ease policy immediately to support growth.
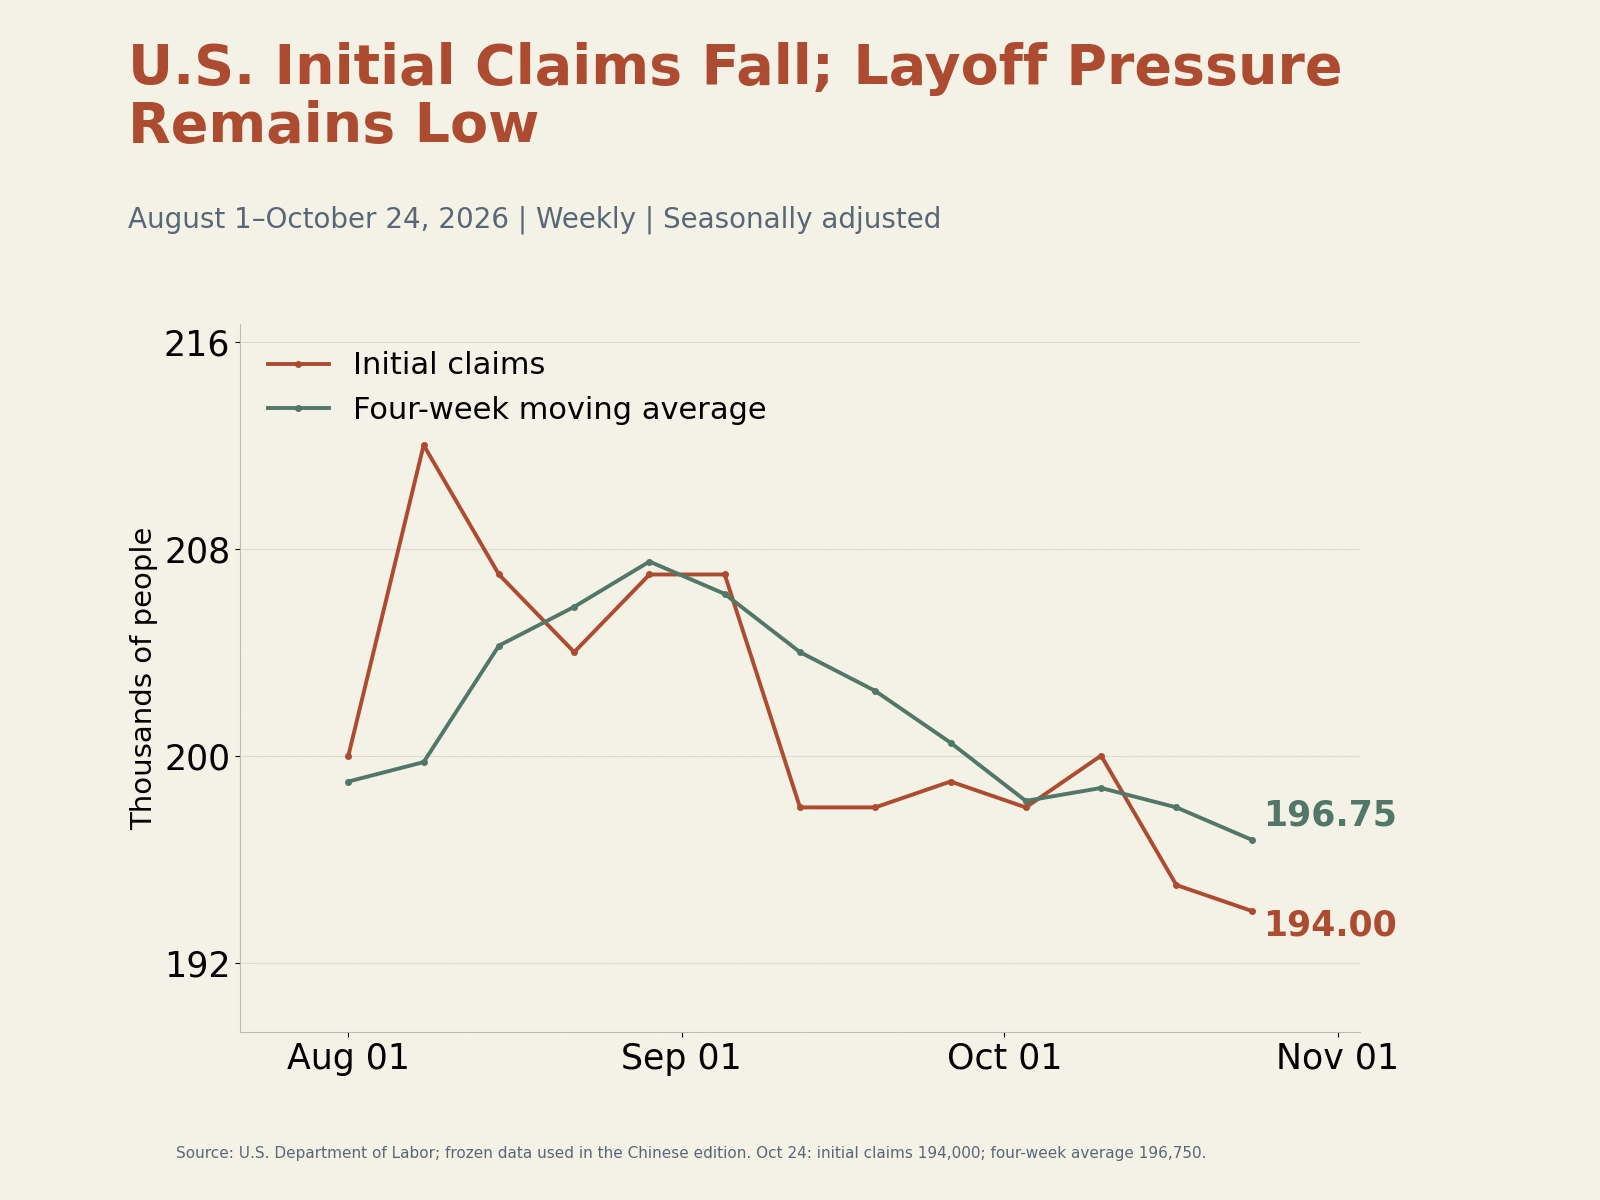
The labor market likewise showed no sign of a significant broadening in layoffs. According to the U.S. Department of Labor, seasonally adjusted initial unemployment claims totaled 194,000 in the week ended October 24, down 1,000 from the previous week's revised figure; the four-week average fell from 207,500 at the end of August to 196,750. Continuing claims declined by 21,000 to 1.701 million in the week ended October 17. The fall in initial claims further reinforced the assessment that the labor market remained resilient.
However, strong quarterly growth masked signs of a slowdown toward the quarter's end. Nominal consumption rose 0.5% month on month in September, but after adjusting for prices, real consumption increased by less than 0.1%, well below August's 0.5%. Real disposable income fell 0.3% over the same period, and the saving rate was 3.8%. Inflation continued to squeeze households' real purchasing power. Whether consumption can sustain its third-quarter performance will still depend on support from income and employment.
Q3 Core PCE Inflation Eases to a 2.5% Annualized Rate, but September's 3.1% Year-on-Year Rate Constrains Rate Cuts
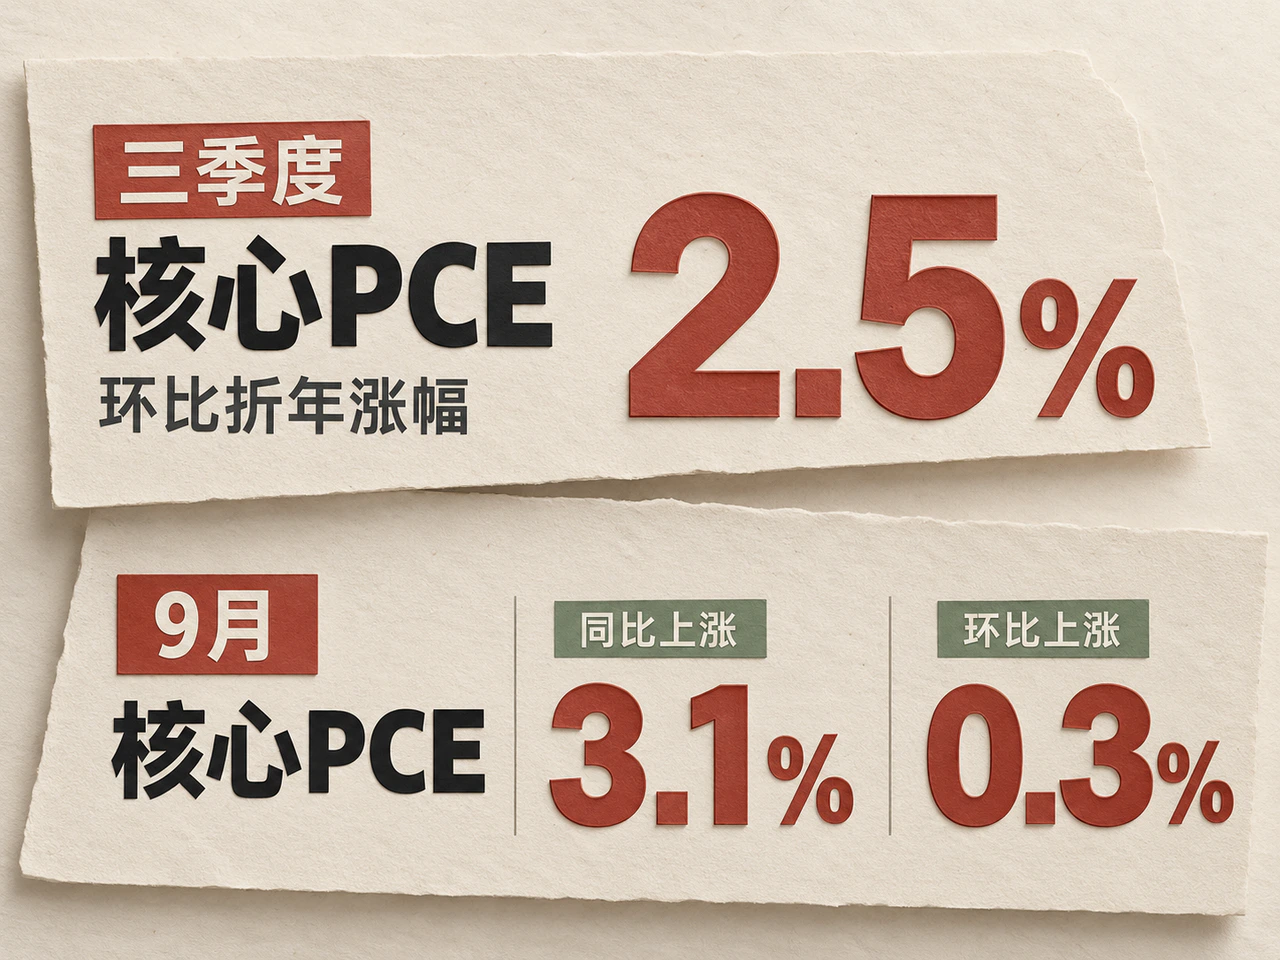
Inflation presented a mixed picture: quarterly pressures moderated, while the monthly readings remained elevated. The PCE price index rose 0.5% month on month in September, up from 0.3% in August, and was 3.6% higher year on year. Core PCE, which excludes food and energy, rose 0.3% month on month, matching August, and 3.1% year on year. Core inflation remained well above the 2% target, while the monthly increase in headline prices widened, offering no fresh inflation-based justification for a near-term rate cut.
At the same time, the PCE price index rose at an annualized quarter-on-quarter rate of 2.1% in Q3, a marked slowdown from 5.0% in Q2. Core PCE inflation on the same basis also declined, from 3.3% to 2.5%. Because annualized quarterly rates and monthly year-on-year rates capture price changes over different time horizons, policy judgments need to consider both recent momentum and persistence. Quarterly price pressures did ease, giving the Fed reason to continue observing; September's monthly readings, however, showed that progress toward the inflation target remained uneven.
Taken together, the data favor keeping interest rates at their current level while awaiting more information. Resilient growth and employment reduce the urgency of cutting rates, while slower quarterly inflation provides room for further observation. Looking ahead, if monthly core price increases remain elevated and demand and employment stay strong, the case for a rate increase will strengthen. Conversely, if real income and consumption weaken together, the cost of continuing to wait will also rise.
The next key tests are the third-quarter Employment Cost Index, due on October 30; September job openings, due on November 3; and the October employment report, due on November 6. Whether wage costs cool, hiring demand eases and employment growth retains support will help markets and the Fed assess how much longer the current combination of strong growth and high inflation can last.