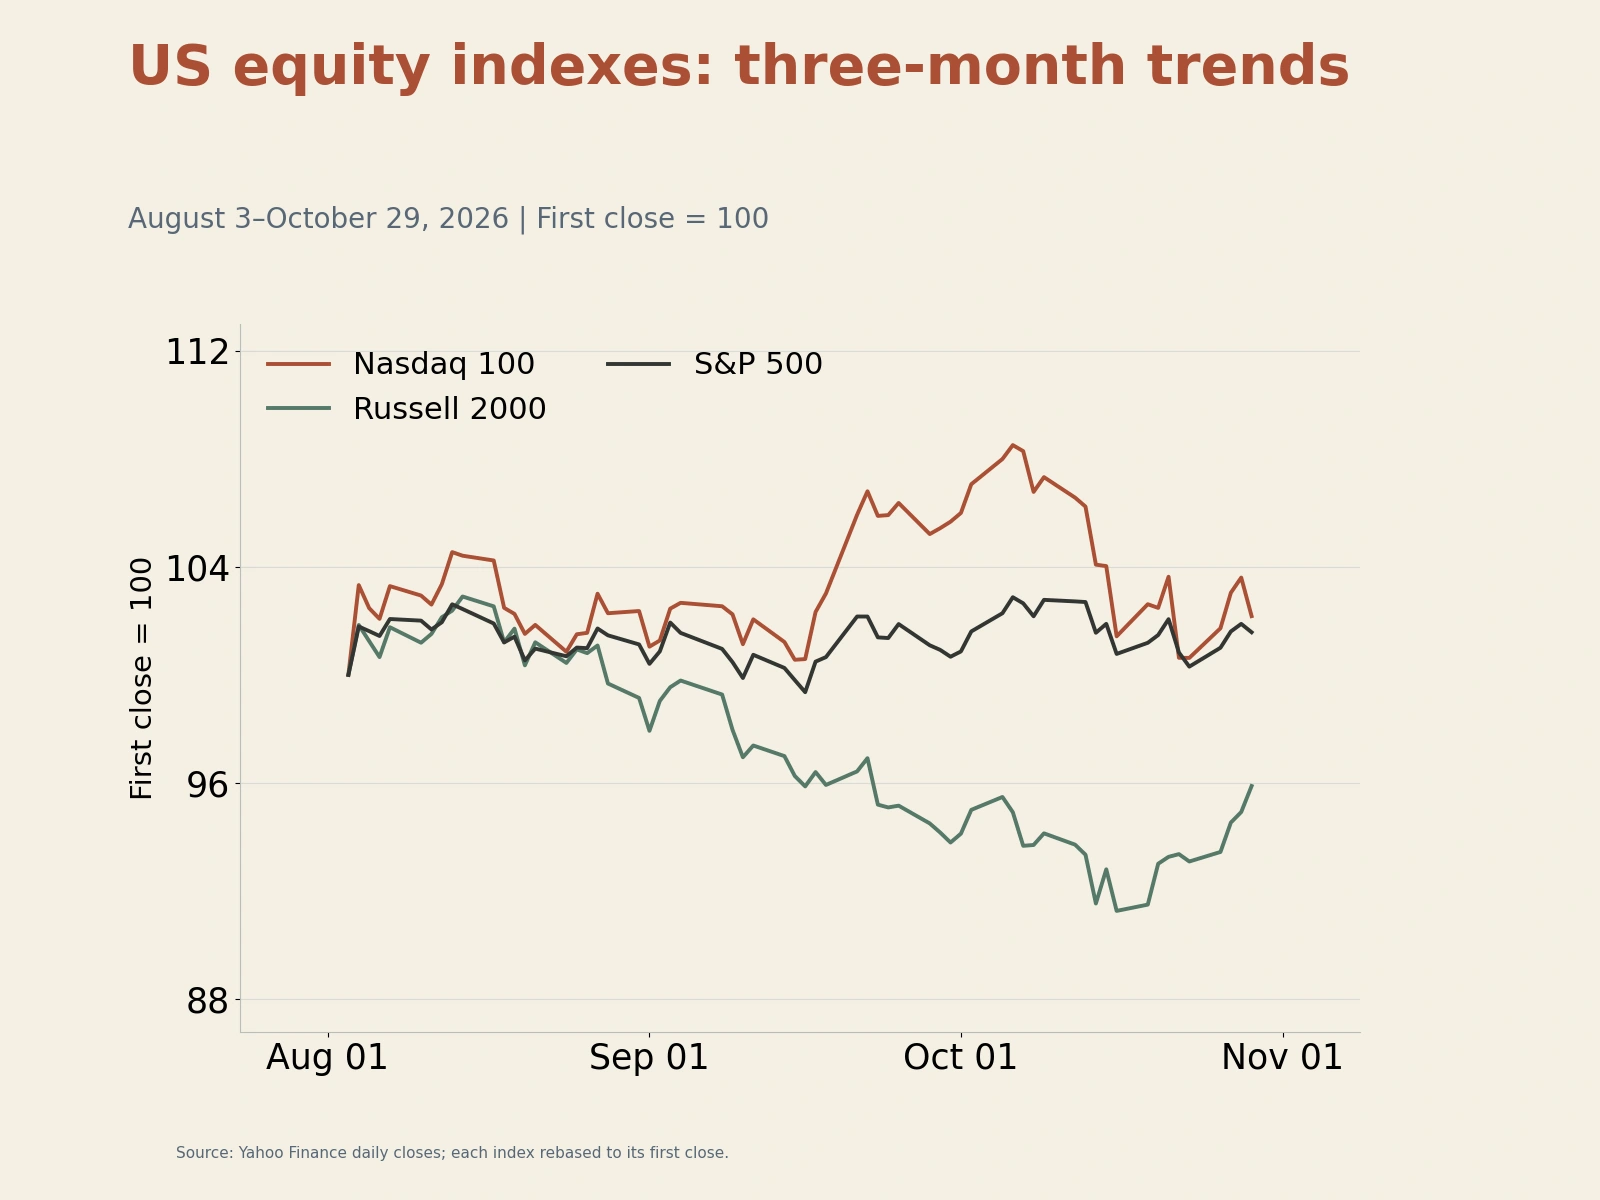
On October 30, 2026, major global assets repriced around the returns on corporate AI capital spending and the risk of energy inflation. U.S. stocks fell, led by technology shares, with the Nasdaq 100 down 3.46%. Gold weakened alongside equities, plunging 3.63% on the day; Commerzbank suggested that some investors may have sold highly liquid assets to replenish cash. Meanwhile, energy supply and shipping risks drove international oil prices higher, supporting energy stocks while making it harder for other industries to absorb costs. U.S. Treasuries rallied as elevated yields attracted investors and some wage data cooled, although rising oil prices continued to limit the scope for yields to decline.
Amazon's free cash flow turns negative as technology selloff drives a 3.46% Nasdaq 100 slump
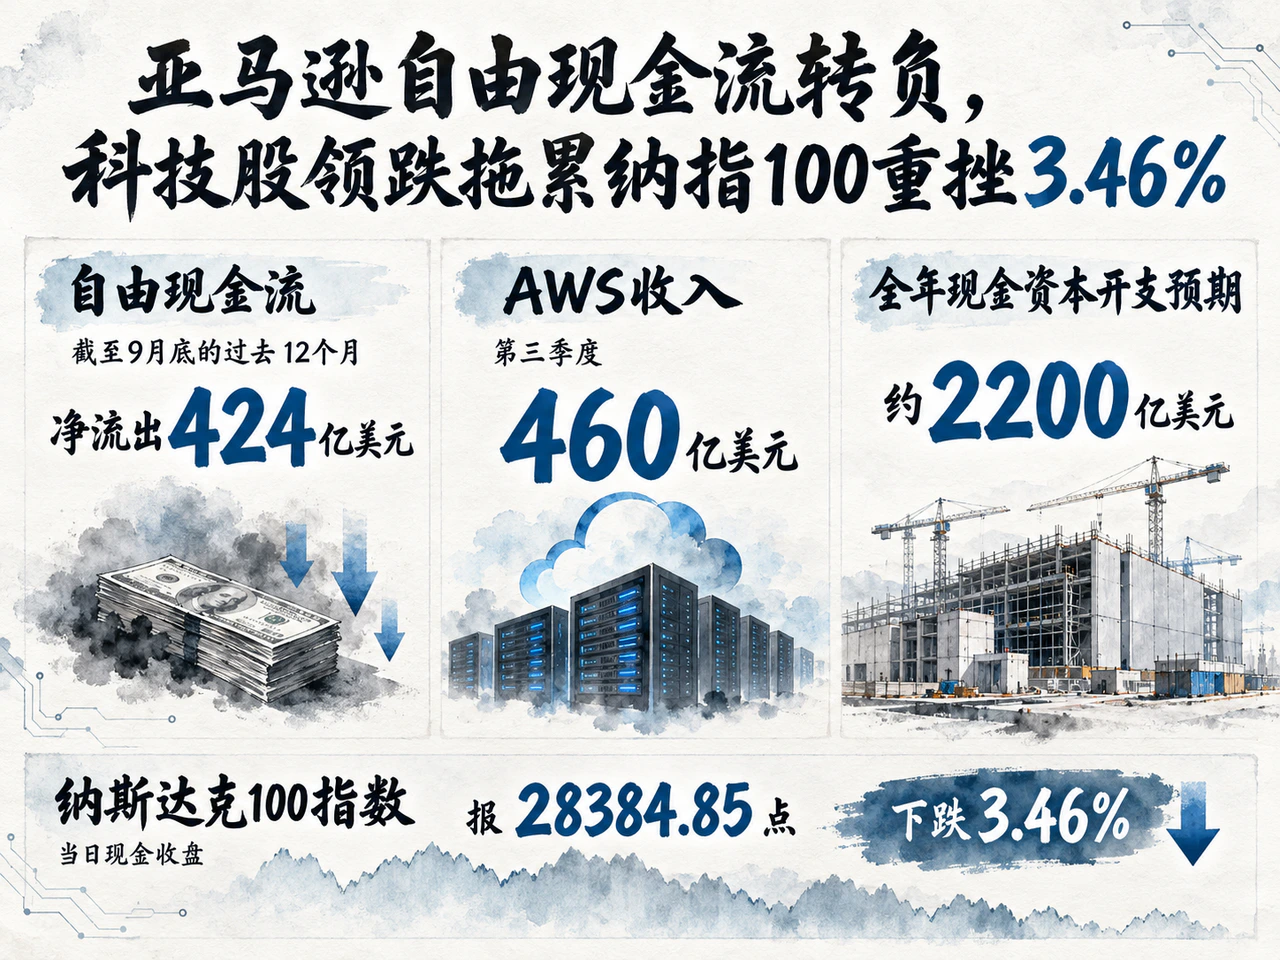
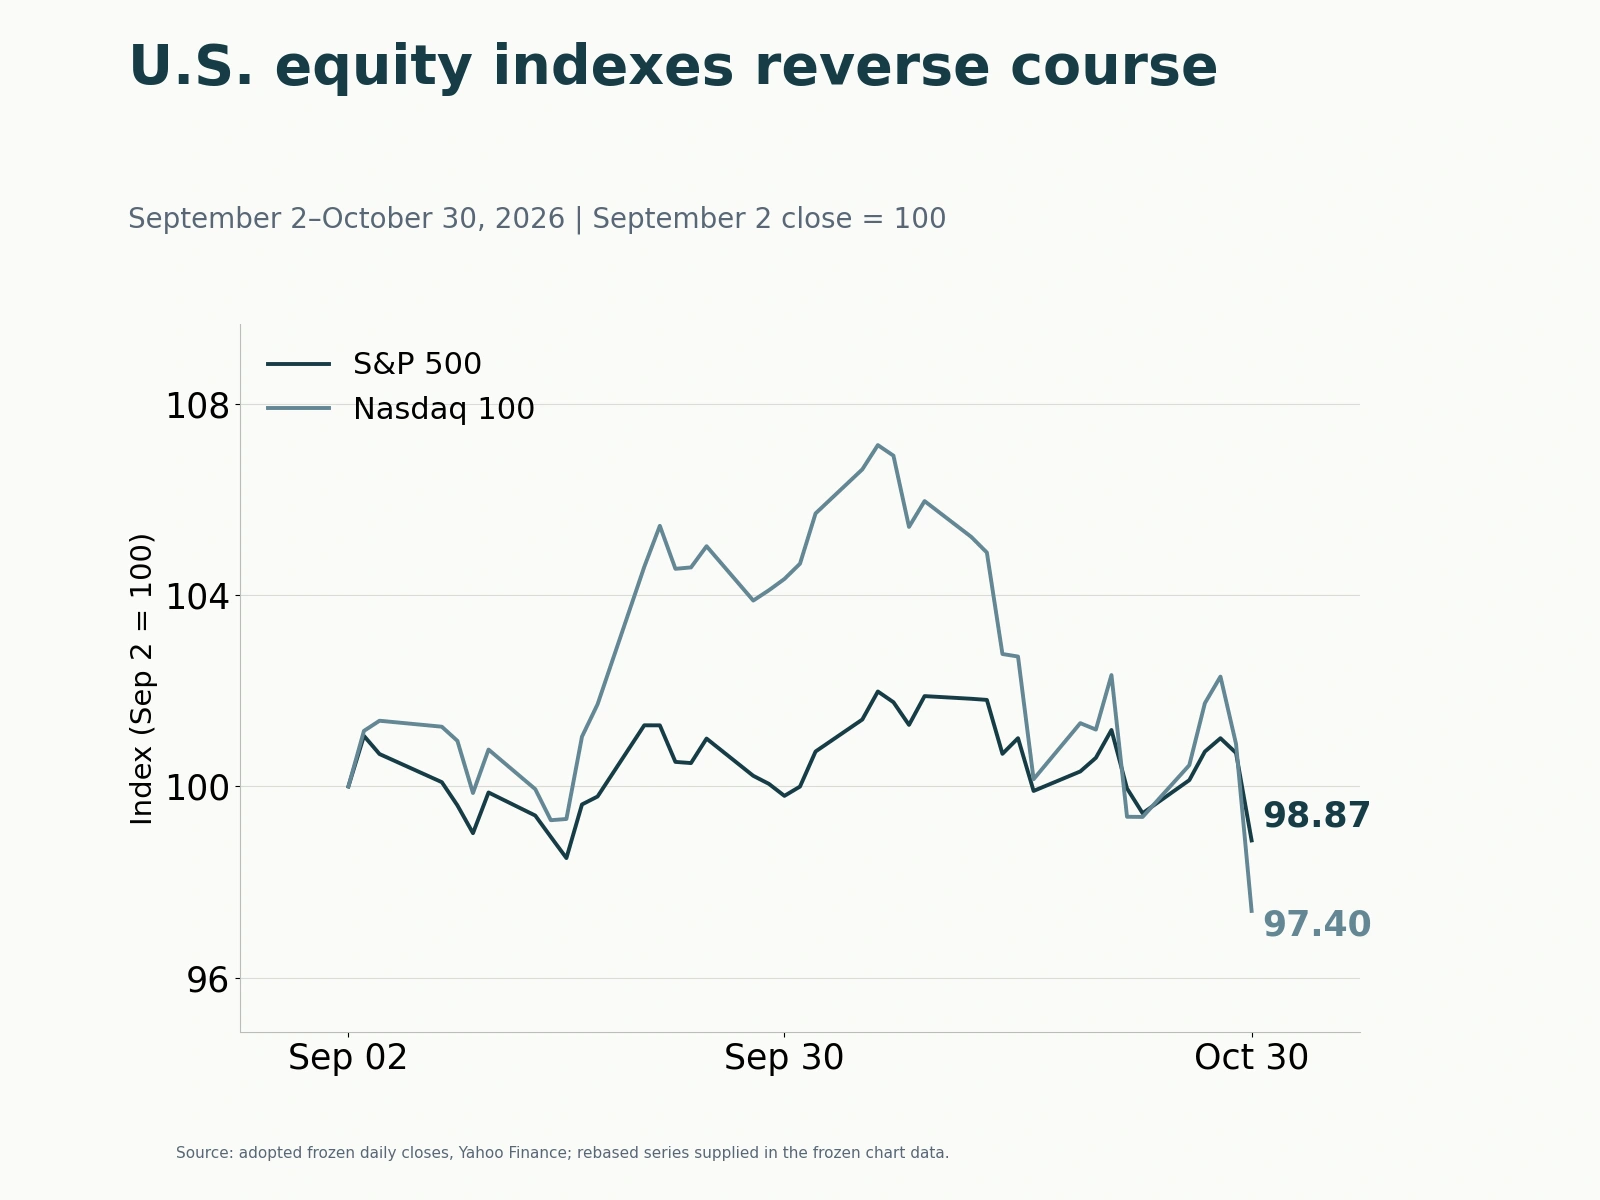
All three major U.S. equity indexes closed lower. At the U.S. cash close, the S&P 500 stood at 7,580.07, down 1.82%; the Nasdaq 100 was at 28,384.85, down 3.46%; and the Dow was at 51,770.31, down 1.09%. U.S. dollar-denominated sector ETFs diverged sharply according to their earnings drivers: technology fund XLK plunged 4.89%, financials fund XLF fell 0.76%, and energy fund XLE rose 1.91% against the broader decline.
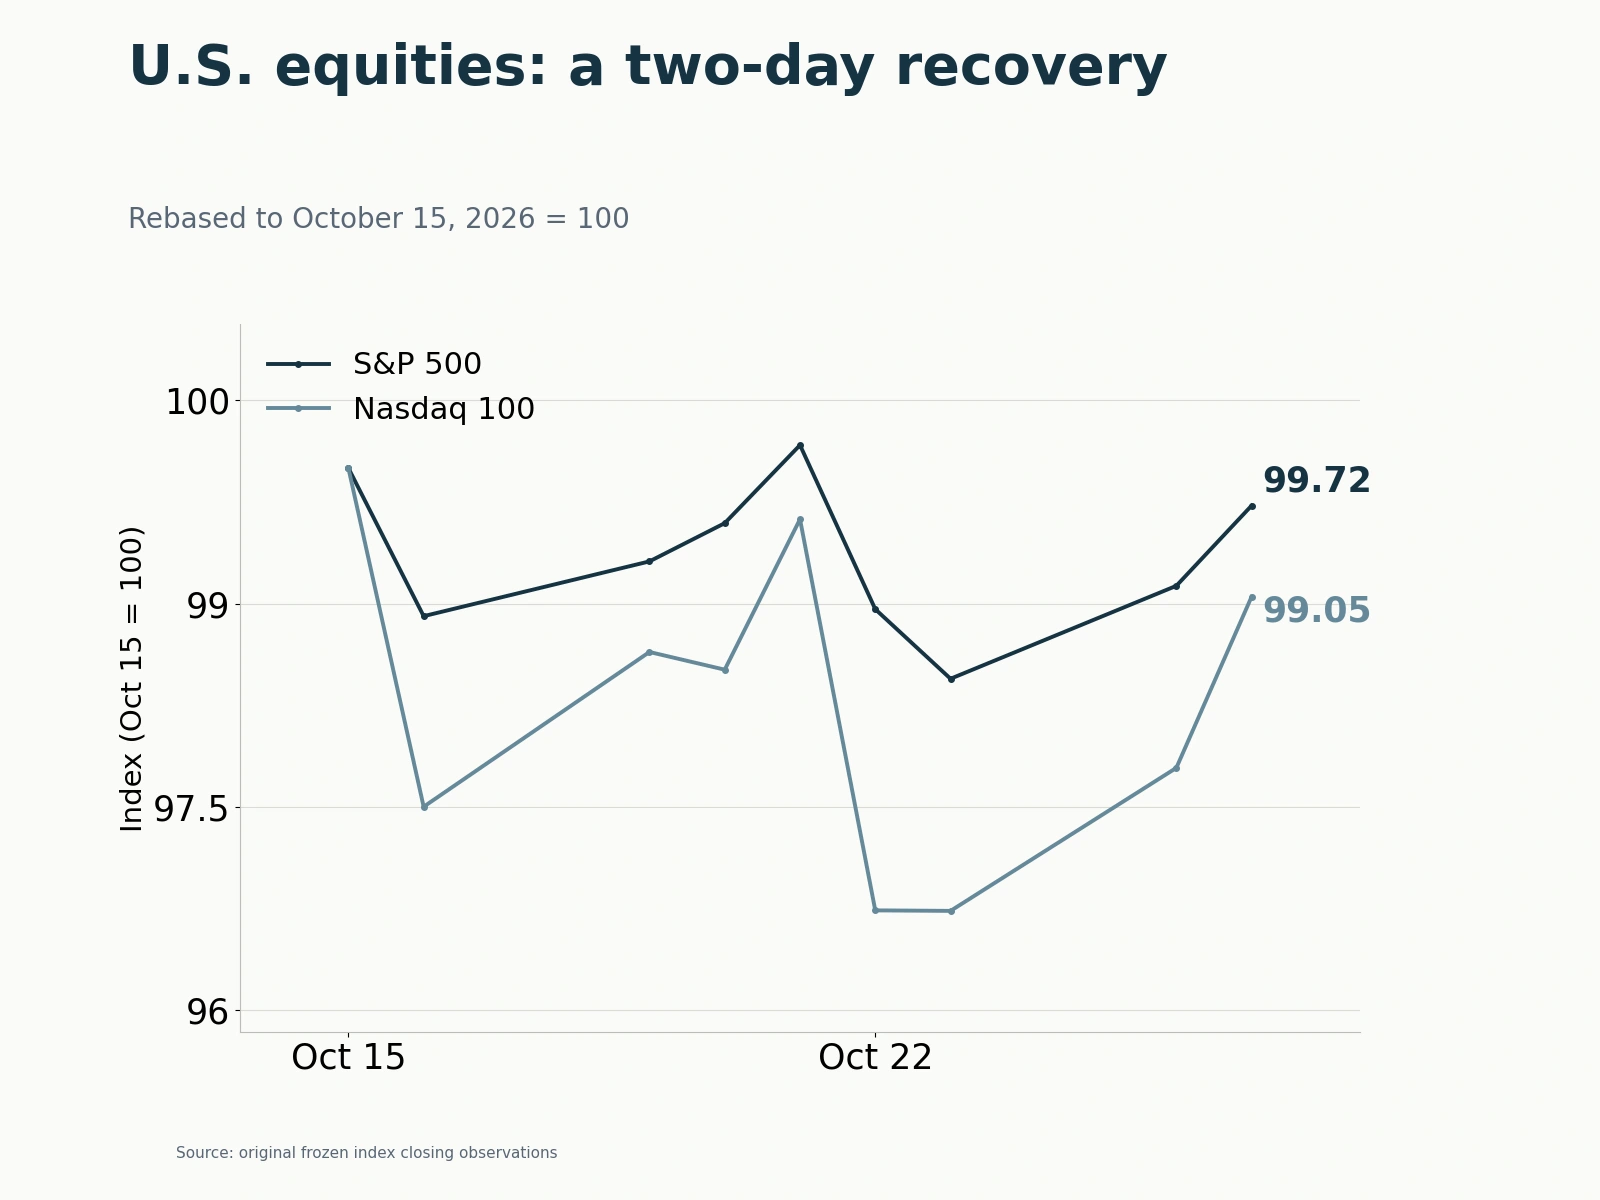
The decline interrupted technology stocks' earlier recovery. The Nasdaq 100 had risen from 28,957.53 on October 23 to 29,813.16 on October 28, before falling for two consecutive sessions; its October 30 close was below the October 23 level. Technology ETF XLK likewise fell from $191.00 on October 28 to $179.51. Selling pressure and demand for hedges extended beyond a handful of technology heavyweights: the small-cap Russell 2000 fell 1.66% that day, while the VIX rose from 17.20 to 19.42, an increase of 2.22 index points.
The immediate catalyst for the technology revaluation came from earnings released after the U.S. market close on October 29, Eastern Time. Amazon's third-quarter net sales rose 12% year on year to $201.9 billion. The company noted that Prime Day had shifted from the third quarter last year to the second quarter this year; excluding that timing change, quarterly sales growth would have been about 4 percentage points higher. AWS revenue rose approximately 39% year on year to $46.0 billion, while operating income was $28.1 billion, with a margin of 13.9%. Despite continued strong cloud growth and improved profitability, free cash flow over the 12 months through the end of September was a net outflow of $42.4 billion, compared with a net inflow of $14.8 billion a year earlier. Amazon's operating cash flow grew 29% to $168.3 billion over the same period, but net purchases of property and equipment increased by $94.8 billion year on year, driving the deterioration in free cash flow. The company said the increase primarily reflected AI investment and expected full-year cash capital spending of approximately $220 billion. The market is reassessing how quickly revenue and profit growth can cover construction spending, and what valuation is appropriate during the intervening period.
Intel's results further exposed differences within technology demand. Third-quarter revenue grew 21% year on year to $16.5 billion. Data Center and AI revenue rose 78% to $7.3 billion, but Client Computing and Physical AI revenue fell 5% to $8.1 billion. Intel expected the PC slowdown to persist at least through the first half of 2027. Its fourth-quarter guidance of $15.0 billion to $16.0 billion in revenue and $0.25 in non-GAAP earnings per share was below third-quarter actual results on both measures.
Yahoo Finance's market coverage that day linked the technology selloff to concerns about AI investment returns following Amazon's and Alphabet's results, and also cited pressure on PC demand from memory prices and supply. Truist Chief Investment Officer Keith Lerner said expectations for technology stocks had previously been high and investors were paying greater attention to AI returns, while financing costs were also creating pressure. Expanding server orders, strained end-user demand and heavy construction spending are making it harder for the technology sector to continue commanding a uniform growth premium.
Modestly slower wage growth lifts the Treasury belly as the 10-year yield falls to 4.94%
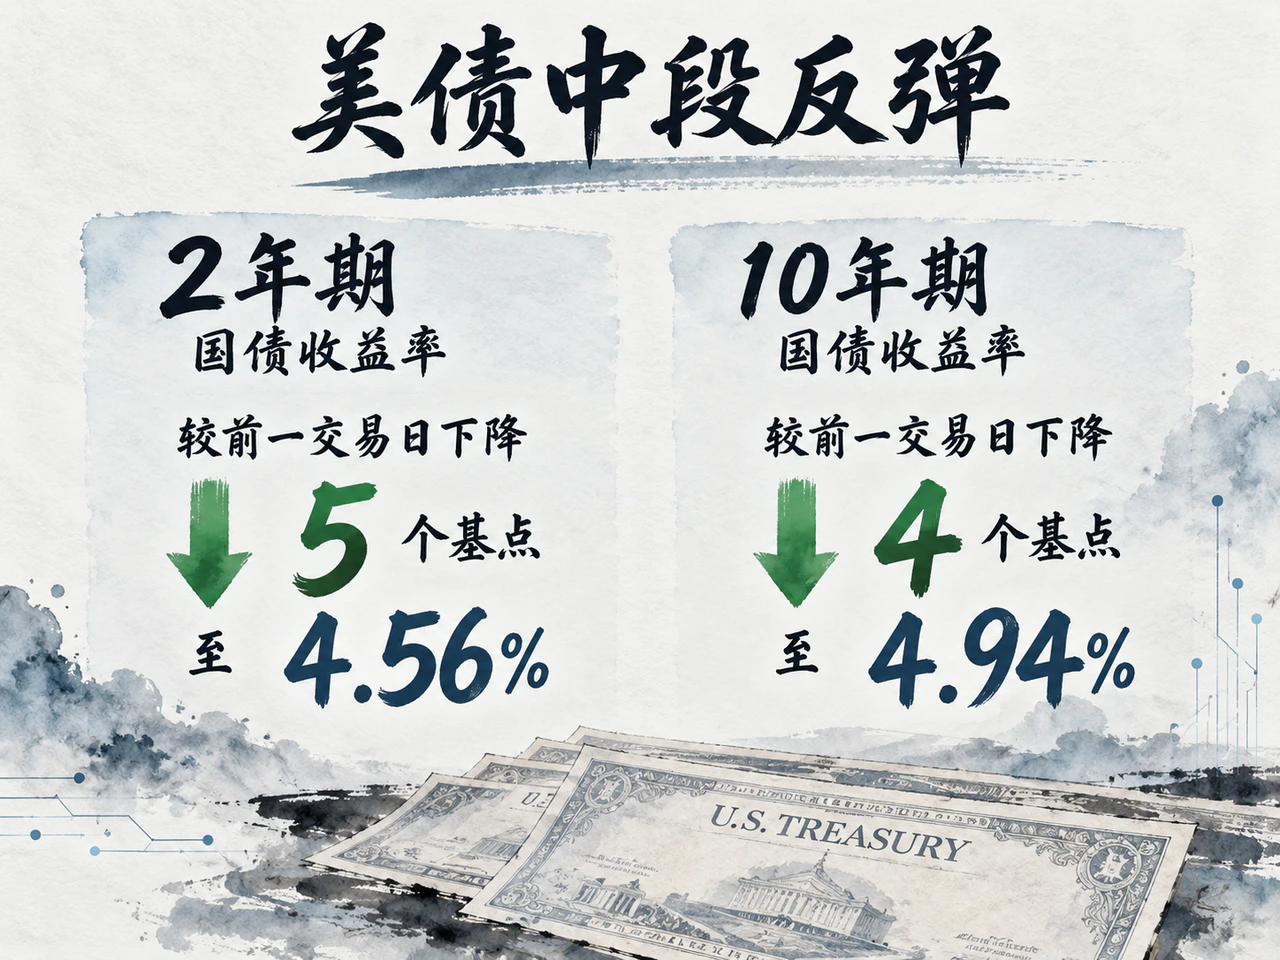
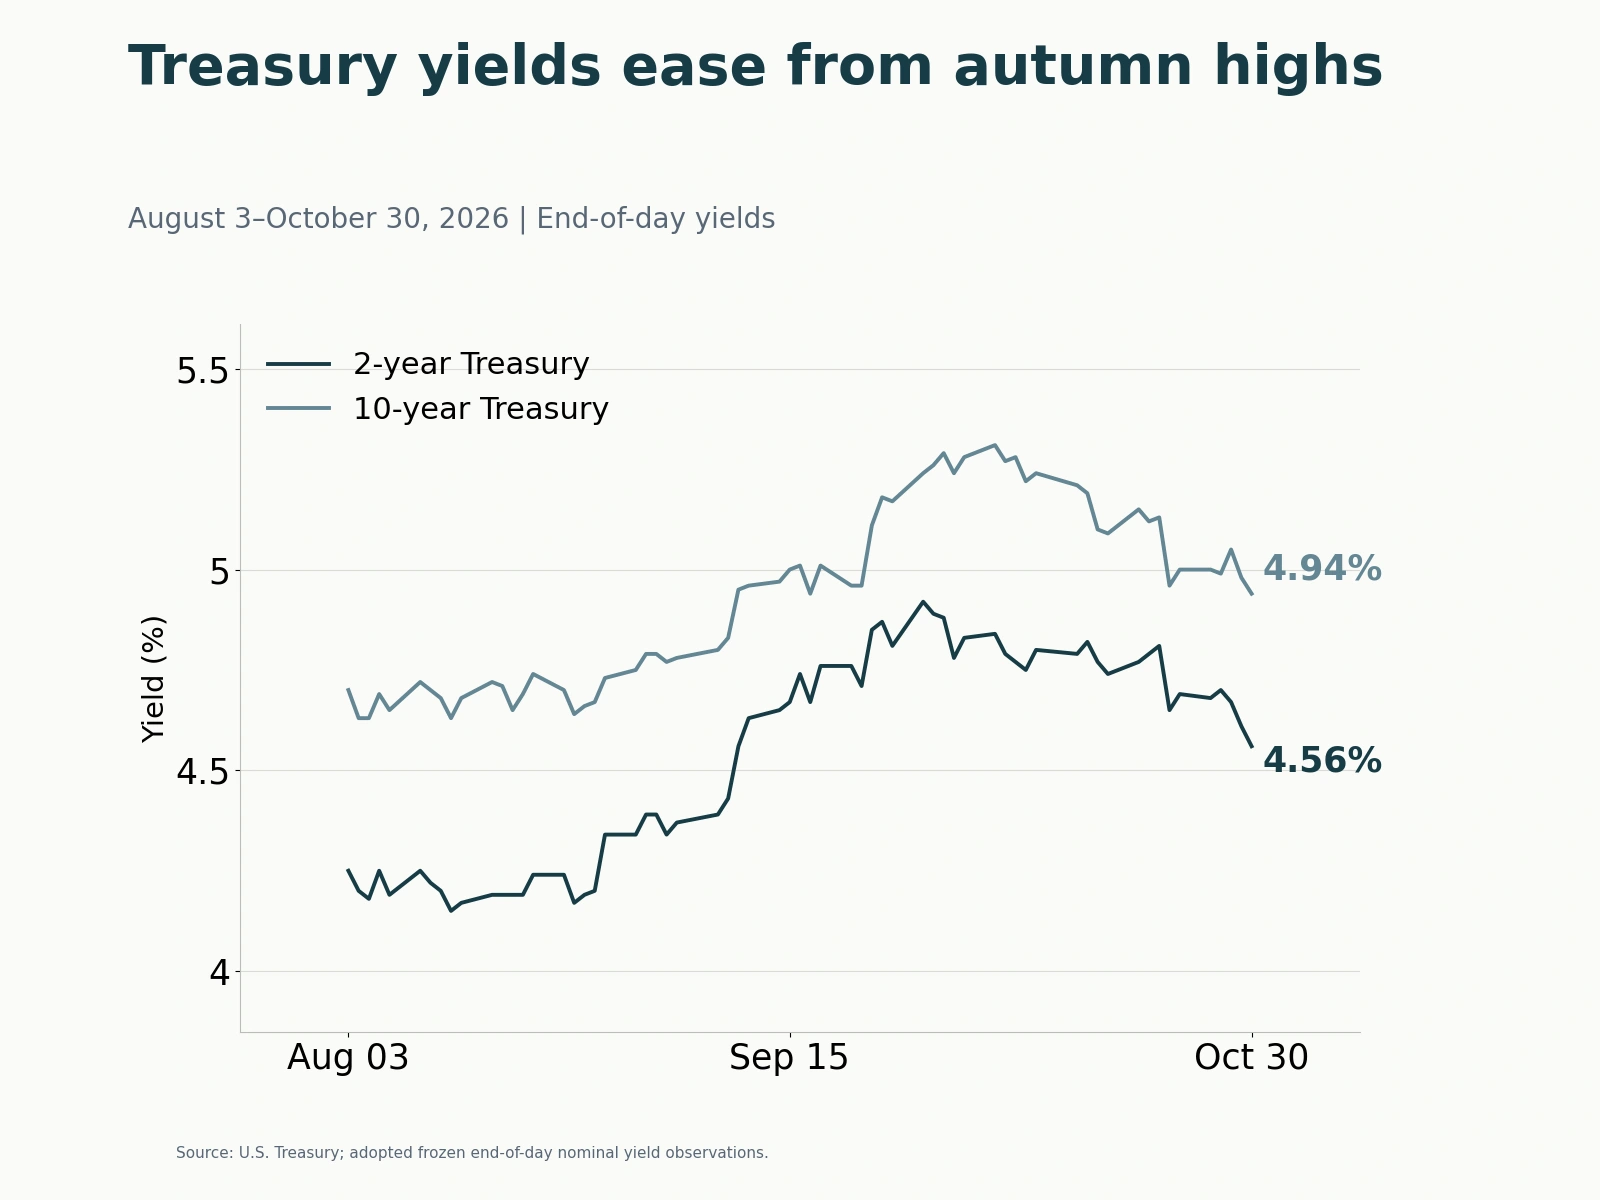
The Treasury rally was led by the belly of the curve, with a smaller response at the ultra-long end. The U.S. Treasury's end-of-day curve showed the 2-year yield down 5 basis points from the previous session to 4.56%, the 5-year down 7 basis points to 4.71%, the 10-year down 4 basis points to 4.94%, and the 30-year down 1 basis point to 5.31%. The 10-year/2-year spread widened from 37 to 38 basis points, while the 30-year/5-year spread increased from 54 to 60 basis points. Real yields also provided support: the Treasury's 5-year real yield fell from 2.31% to 2.25%, and the 10-year from 2.63% to 2.60%, while the 30-year edged up from 3.07% to 3.08%. Over the month, nominal 10-year and 30-year yields had fallen 35 and 33 basis points, respectively, from their September 30 levels of 5.29% and 5.64%. Bloomberg reported on October 30 that high yields were drawing buyers back into long-dated bonds, while pressure on equity valuations and volatility were also prompting some investors to allocate to government debt.
The third-quarter Employment Cost Index, released that day, gave the bond market evidence of cooling wage growth. Seasonally adjusted total compensation for civilian workers rose 0.8% quarter on quarter, down from 0.9% in the second quarter and in line with market expectations. Wages and salaries rose 0.7%, compared with 0.9% previously. However, quarterly total compensation growth had remained between 0.7% and 0.9% for the nine quarters since the third quarter of 2024, so the improvement was still modest. Year on year, total compensation rose 3.4%; wage growth slowed to 3.1%, but benefit growth accelerated to 3.9%. Within benefits, private-sector health benefit costs rose 6.4% year on year, up from 6.0% in the previous quarter.
The Chicago Business Barometer, also released that day, fell from 58.8 in September to 55.3 in October, remaining in expansion territory. Production and new orders slowed, and order backlogs contracted for a fourth consecutive month. However, the employment component rose to its highest level since April 2021, while prices paid jumped 8.9 points to the highest level since December 2021; the report linked this to chemical and petroleum input costs. With wage growth easing while other input costs rise, companies' ability to pass costs downstream still depends on the strength of their orders.
September PCE data, released earlier on October 29, formed the macroeconomic backdrop to the day's trading: headline prices rose 3.6% year on year and core prices rose 3.1%; nominal consumption increased 0.5% month on month, real consumption was unchanged after rounding, and real disposable income fell 0.3%. According to Reuters' report on the morning of October 30, markets assigned an approximately 80% probability to a 25-basis-point rate increase in December. Standard Chartered's outlook that day continued to forecast a 25-basis-point increase in December and another in the first half of 2027, and confined its preferred bond duration to 3–7 years. Falling nominal yields thus continued to coexist with expectations of further monetary tightening.
Ultra-long Treasuries continued to face constraints from fiscal supply. In Reuters interviews with investment firms that day, respondents expected a U.S. budget deficit of about $2 trillion this year, or approximately 6% of GDP, and argued that a change in control of Congress would be unlikely to reduce borrowing quickly. Allspring's George Bory said divided government could slow some spending growth and thereby support long-dated bonds. Pimco's Libby Cantrill, however, thought spending could still increase under different election scenarios. Next week's Treasury quarterly refunding announcement and the December 11 government funding deadline will continue to shape market assessments of Treasury supply.
In credit markets, higher compensation for credit risk partly offset the improvement in funding costs from lower benchmark yields. ICE BofA U.S. high-yield spreads, updated on October 30 and reflecting the October 29 close, stood at 326 basis points, 12 basis points wider than on October 28. Investment-grade corporate spreads were 89 basis points, up 3 basis points. Both remained below their October 23 levels of 338 and 91 basis points, but the midweek recovery had faltered. Bloomberg also reported during Asian trading on October 30 that concerns over issuer liquidity were weighing on Chinese high-yield dollar bonds. Average prices had fallen about 1.9 cents that week through Thursday, while some offshore bonds of state-backed property companies rebounded about 1 cent in early Friday trading. Differentiation among issuers remained pronounced.
Shipping risks lift Brent above $117 as cash-raising pressure sends gold below $3,900
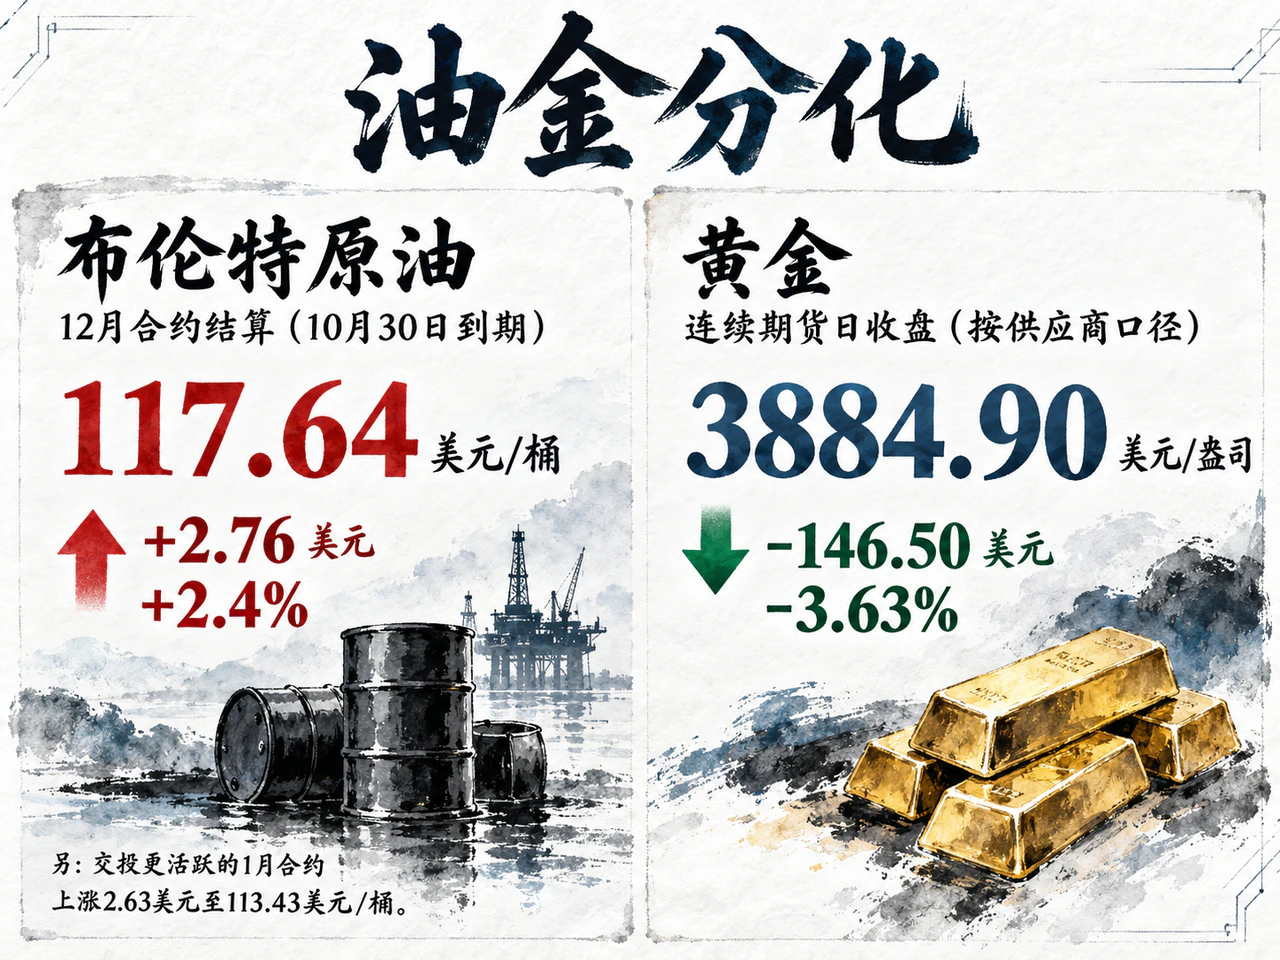
International oil prices extended their rise. Reuters' closing report showed that the December Brent contract, which expired on October 30, settled at $117.64 a barrel, up $2.76, or 2.4%. The more actively traded January contract rose $2.63 to $113.43 a barrel. WTI futures settled at $104.12 a barrel, up $2.12, or 2.08%. On the basis used in that report, Brent and WTI gained 13.6% and 15.2%, respectively, in October, their fourth consecutive month of gains.
Actual maritime security incidents continued to support the near-term supply premium. The UK Maritime Trade Operations office disclosed on October 30 that a tanker had been struck by an attached explosive device while passing through the Strait of Hormuz on October 29; responsibility remained unclear. Kim Fustier, HSBC's head of European oil and gas research, said in a Reuters survey that flows of liquid energy through Hormuz had recovered to approximately 10 million barrels a day, faster than the bank had previously expected. However, near-month premiums, physical price differentials and freight rates still pointed to tight physical markets. Recovering shipments and persistently high transport risks were jointly driving current oil prices, while expensive oil had begun to restrain demand.
Transport cost pressures were also evident in Russia's export chain. Citing trading and shipping sources, Reuters said the cost of transporting Urals crude from western Russian ports to India had risen to around $30 a barrel or more in late October, from approximately $20 in September, because of Black Sea risks, vessel shortages and longer routes. This squeezed exporters' net proceeds and changed refiners' comparisons of the delivered costs of alternative crude supplies. Reuters also reported that the United States was pushing Russia–Ukraine talks and discussing possible sanctions relief and limits on attacks on energy facilities. The Pentagon had not confirmed the private discussions. Whether diplomatic signals can lower costs still depends on actual changes in shipping and sanctions arrangements. On Iran, Qatari mediators had returned to Tehran; developments will continue to affect markets through oil supply and shipping risk premiums.
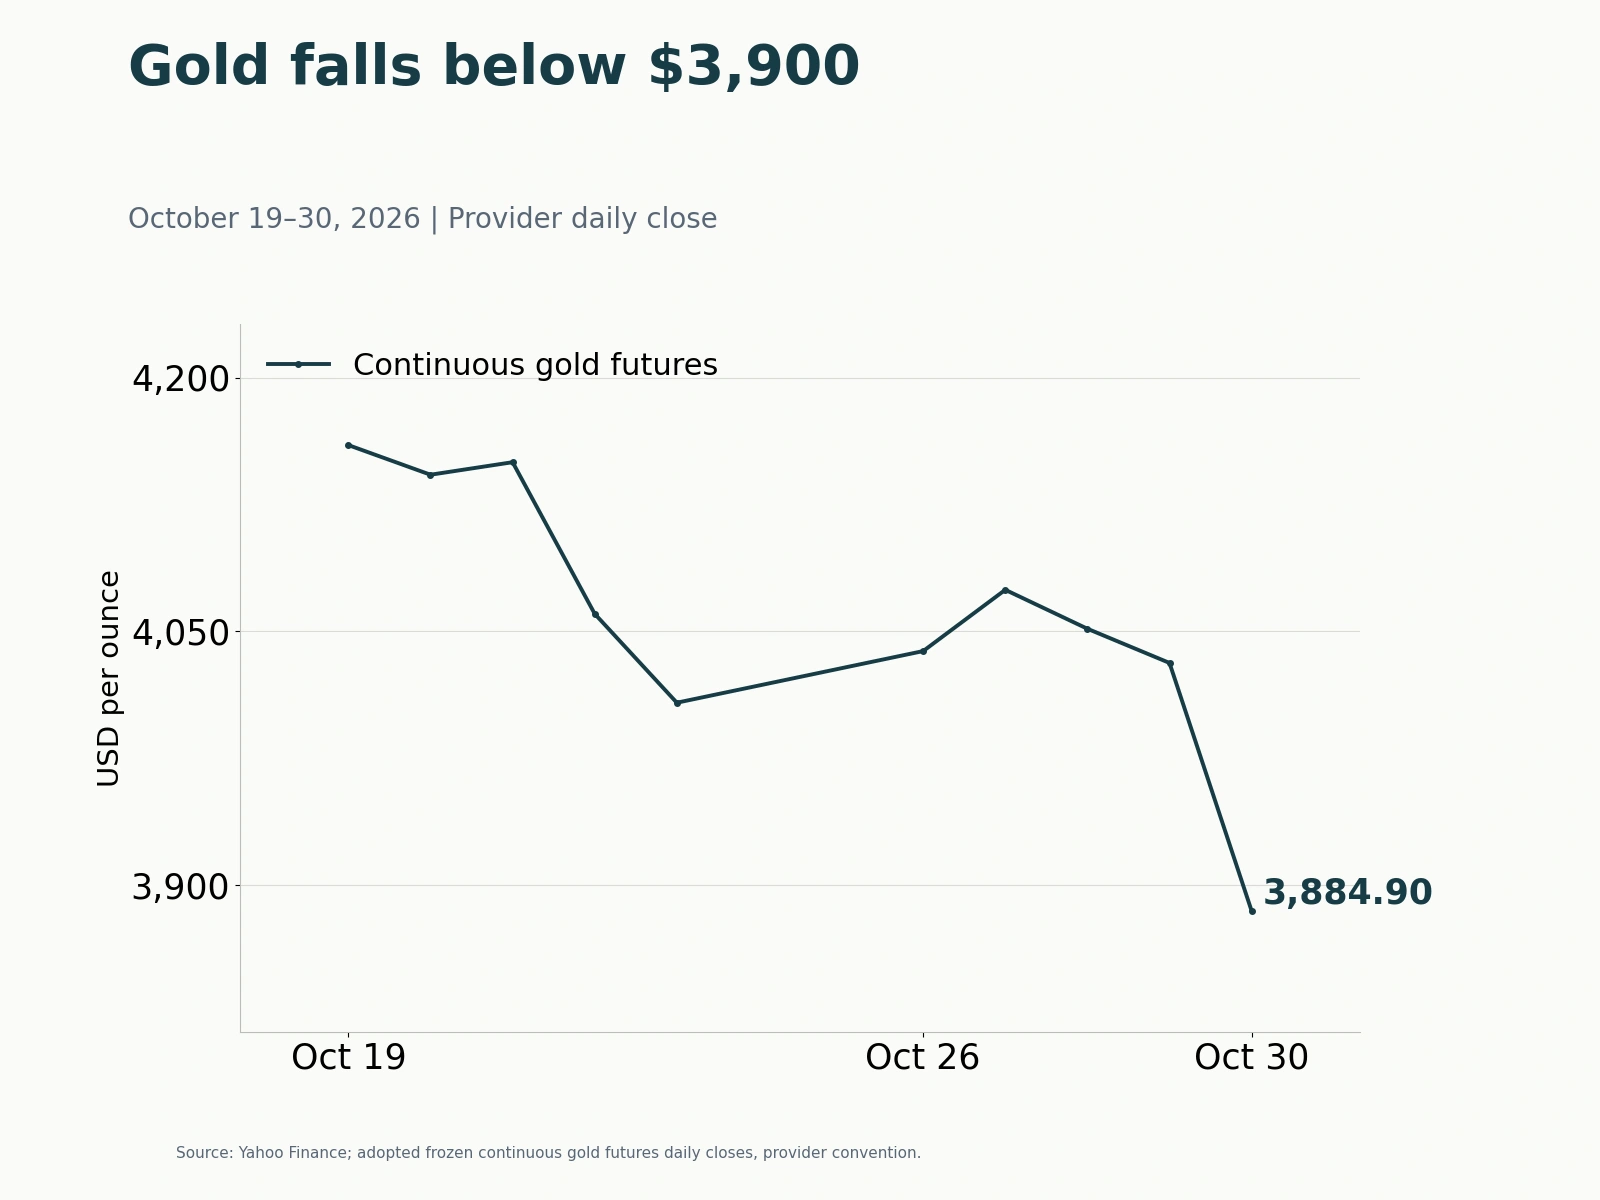
Gold continued to fall sharply despite a roughly 0.07% decline in the dollar index to 101.964 and lower Treasury yields. On the data provider's continuous futures daily-close basis, gold was $3,884.90 an ounce, down $146.50, or 3.63%, from the previous session. It had fallen from $4,160.10 on October 19 to $4,007.90 on October 23, then rebounded to $4,074.60 on October 27 before declining again. The break below $3,900 on October 30 marked a clear acceleration of its earlier weakness.
Commerzbank suggested that the sharp decline in technology stocks could have triggered margin calls, prompting investors to sell liquid assets such as gold to replenish cash. That mechanism was consistent with the simultaneous declines in stocks and gold that day. Analysts quoted by Reuters said Asian demand was currently weak and central bank buying typically strengthened below $4,000. Potential buyers still needed to absorb market selling pressure in the near term.
PBOC introduces daily overnight reverse repos, shifting the short-term operating benchmark to 1.25%
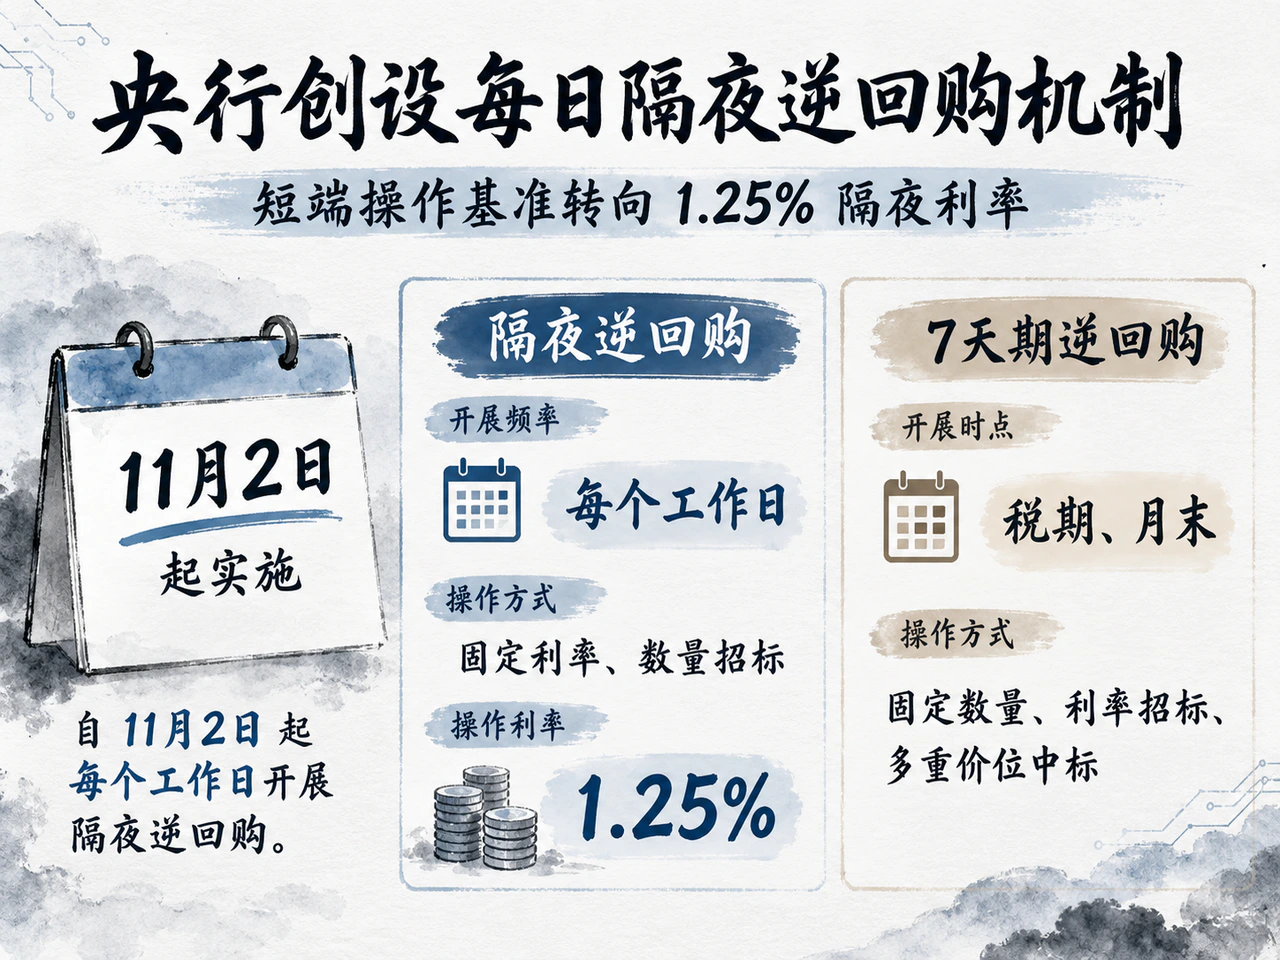
The People's Bank of China announced on October 30 that, from November 2, it would conduct overnight reverse repos every working day through fixed-rate, quantity tenders, with the operating rate currently at 1.25%. Seven-day reverse repos will switch to fixed-quantity, interest-rate tenders with multiple-price allotments, conducted mainly around tax payment periods and month-end. Some instruments previously priced at spreads to the 7-day reverse repo rate will instead use the overnight reverse repo rate as their base, with the spreads unchanged.
The change brings routine liquidity provision closer to the banking system's funding needs on a given day, while focusing the 7-day instrument on adjustments spanning tax payment periods and month-end. Reuters quoted Zhou Hao, chief economist at Guotai Junan International, as saying this indicated a shift toward an operating framework based on the overnight rate. Ming Ming, chief economist at CITIC Securities, said the reform of the short-term mechanism would help improve the benchmark for loan pricing and the transmission of lower interest rates. The actual extent of the improvement in financial conditions will subsequently be reflected in injection volumes, money-market rate volatility and credit pricing.
Following the changes to the short-term mechanism, forthcoming data on real-economy demand and employment will be particularly important. China's October PMI was scheduled for release at 9:30 a.m. Beijing time on October 31; changes in orders and demand will help assess how short-term funding arrangements transmit to business activity. The United States will release job openings, productivity and costs, and October employment data over the following week. Whether the wage slowdown continues and energy input costs feed further into other prices will directly affect current interest-rate pricing.
Japanese and South Korean chip stocks fall with U.S. technology shares, while nontech sectors lift Hong Kong 1.5%
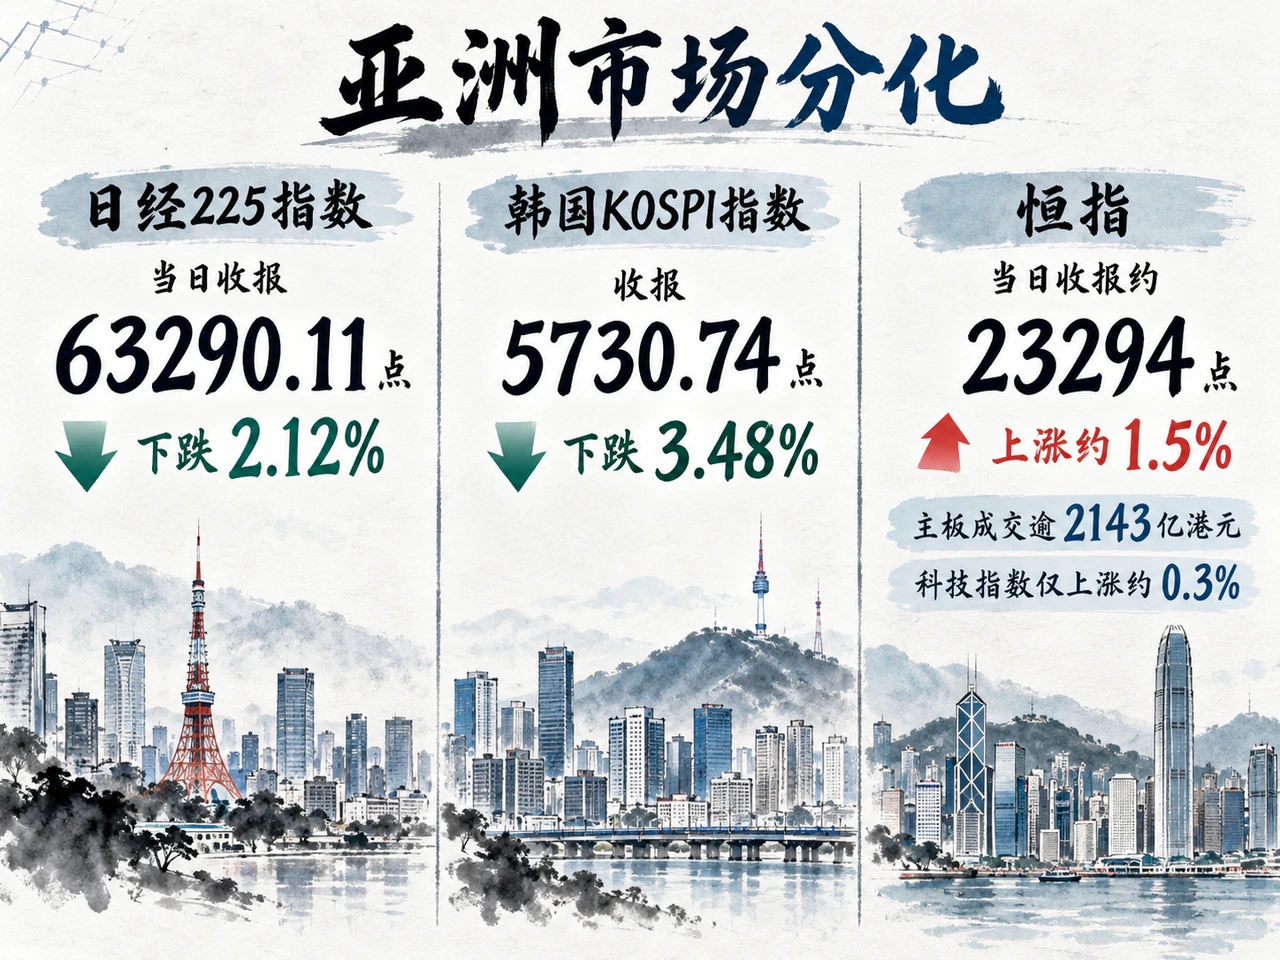
Asian cash markets closed on October 30 before that day's U.S. cash close, but had already begun digesting earnings released after the U.S. market close on October 29, Eastern Time. With equipment, memory and AI hardware accounting for large shares of their industries, Japanese and South Korean markets were more sensitive to changing expectations for capital spending and its earnings returns. The Nikkei 225 closed at 63,290.11, down 2.12%, while South Korea's KOSPI closed at 5,730.74, down 3.48%. Reuters reported broad pressure on Japanese chip equipment and AI-related stocks. In South Korea, Samsung Electronics fell 3.02% and SK Hynix dropped 7.08%.
Hong Kong exhibited a different pattern of sector rotation. According to RTHK, the Hang Seng Index closed at approximately 23,294, up about 1.5%, with Main Board turnover exceeding HK$214.3 billion. The Hang Seng Tech Index gained only around 0.3%. Consumer, oil and mainland bank stocks supported the broader market, while chip and AI-related shares remained under pressure. Over the week, the Hang Seng rose about 0.9% and the Tech Index fell around 3%. For October as a whole, they declined approximately 5.4% and 11.7%, respectively, leaving technology assets' recovery behind the broader market.
Trade policy continued to influence costs and orders. Reuters reported on October 30, citing research by the German Economic Institute, IW, that the U.S. goods trade deficit had reached $130 billion in August. The EU's share of the U.S. goods deficit fell from 20% in August 2024 to 7%, while China's share fell from 29% to 14%. Although trade sourcing had shifted, the overall U.S. deficit remained large. Policy incentives for further tariff adjustments could therefore coexist with pressure from import costs, continuing to affect corporate profits through real investment, supply-chain locations and end-user demand.
Looking ahead to the next Asian trading day, heavy AI investment may continue to support supply-chain orders, but weak end-user demand and pressure to recoup cash will constrain valuations. Consumer, financial and energy companies each have different earnings foundations. The subsequent performance of Asian assets will continue to depend on each market's industrial structure and local demand, while the valuation support from lower U.S. interest rates still needs to be assessed alongside corporate cash flow, credit risk and energy costs.