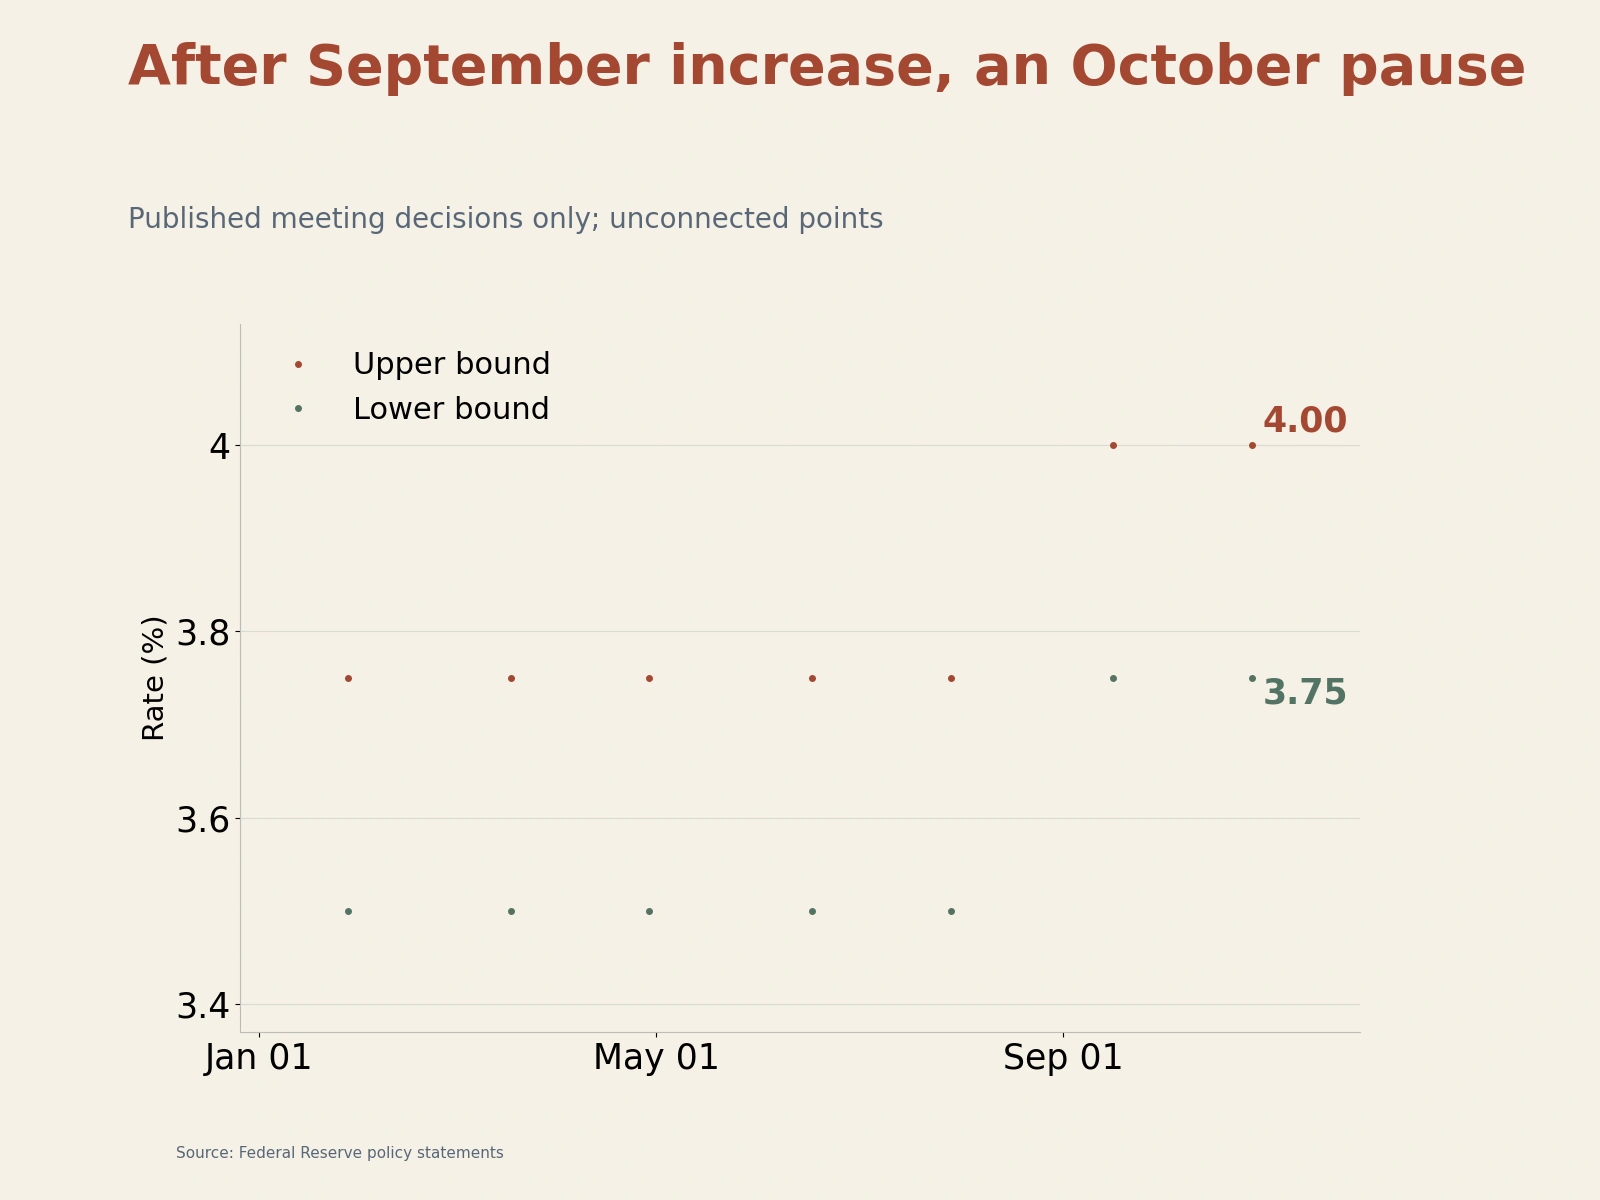
On October 28, 2026, the Federal Reserve held the target range for the federal funds rate at 3.75%–4% at its October policy meeting, but two members dissented in favor of a 25-basis-point increase. U.S. growth and inflation data released the following day further highlighted the complexity of this period of policy observation: economic growth accelerated in the third quarter and price increases picked up in September, while household purchasing power and monthly real consumption were already showing signs of strain.
Throughout the week of October 26–November 1, the central policy question was how long this pause in rate hikes could last. A resilient economy and inflation still well above the 2% target leave a case for further tightening. Yet the stall in monthly real consumption growth also suggests that the effects of previous rate increases and rising prices on final demand need further observation.
Rates Held at 3.75%–4%; Two Members Dissent in Favor of a Hike
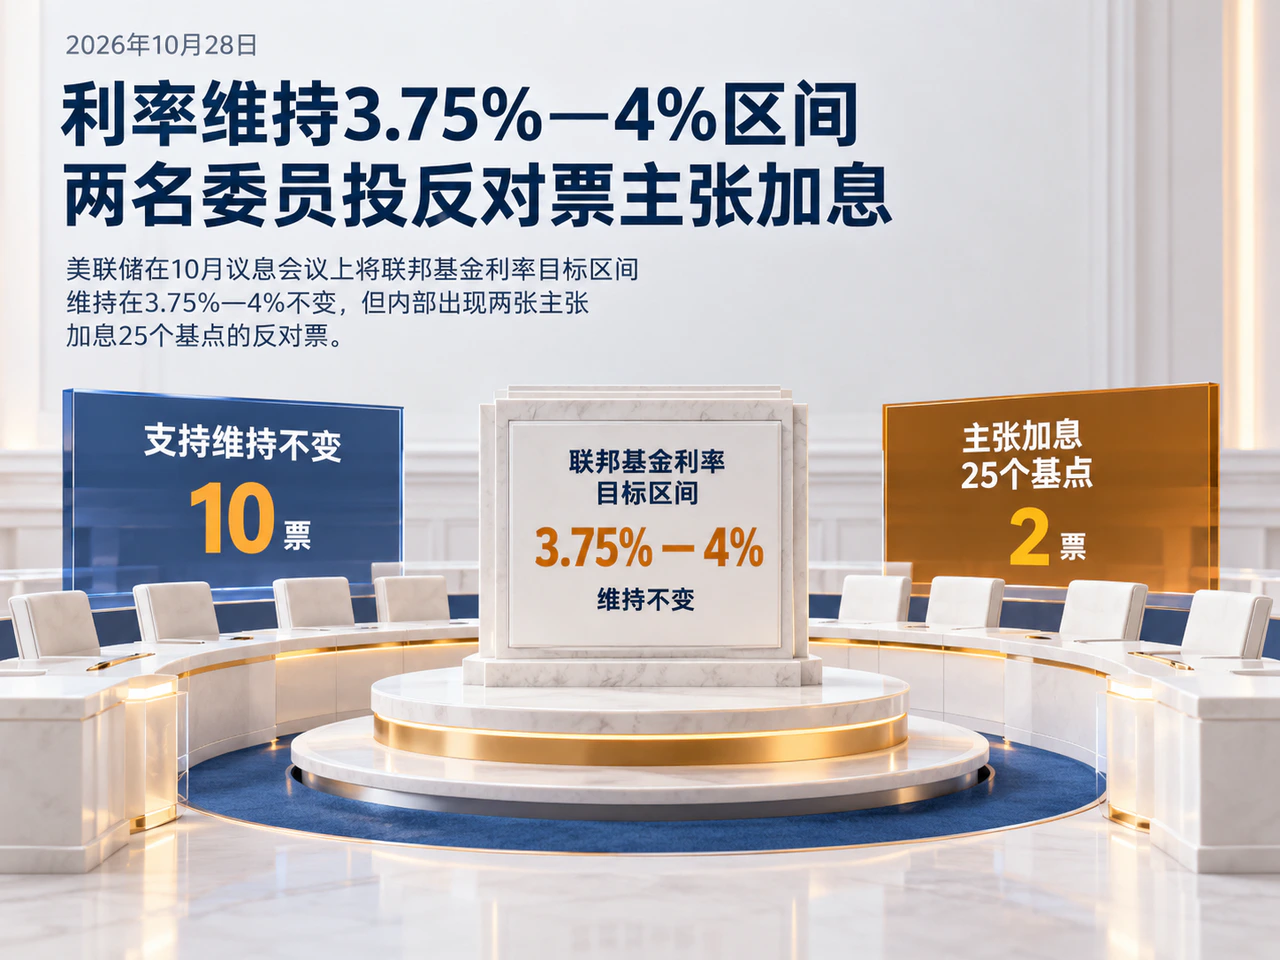
The October 28 rate decision passed by a vote of 10 to 2. Federal Reserve Governor Lisa Cook and Cleveland Fed President Beth Hammack dissented, preferring an additional 25-basis-point increase at that meeting.
The post-meeting statement remained positive about economic fundamentals: economic activity was expanding at a strong pace, domestic spending remained resilient, productivity growth was strong, and capital investment was robust. Job gains were keeping pace with the size of the labor force, while the unemployment rate had changed little. Solid growth and employment allowed the Committee to keep its policy focus on elevated inflation. At the same time, the statement pointed to gathering further information as a basis for judging the appropriate policy stance. Majority support for a pause indicates that the Committee is willing to allow more time for existing policy to work through the economy. The two dissents in favor of a hike, however, show that members differ in their assessment of the cost of waiting.
According to Yahoo Finance’s coverage of the October 28 post-meeting press conference, Fed Chair Kevin Warsh said that financial conditions had tightened compared with earlier, although he was still reluctant to describe them as strained. He also noted that some members believed monetary policy was beginning to have an effect, but that the evidence was not yet sufficient for a firm conclusion. These remarks explain how a pause in rate hikes can coexist with a tightening bias: policy is having an effect, but the Committee still needs to observe the extent to which it is restraining demand and inflation.
Third-Quarter GDP Growth Accelerates to 3.4% and September PCE Inflation Rebounds, While Monthly Real Consumption Stalls
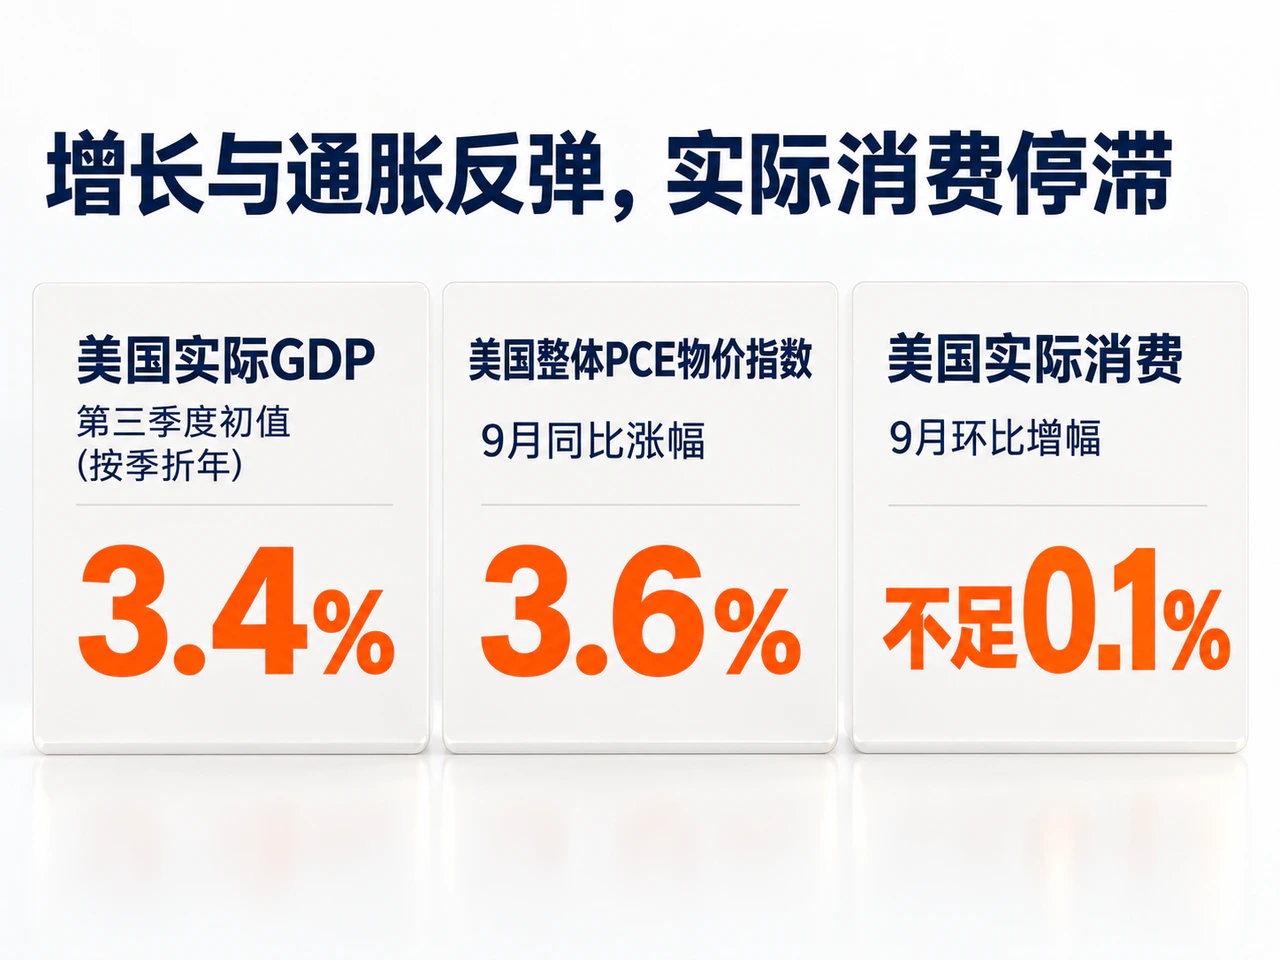
Data released by the U.S. Bureau of Economic Analysis on October 29 showed the twin pressures of economic growth and sticky inflation. The advance estimate put third-quarter U.S. real GDP growth at an annualized quarterly rate of 3.4%, up from 2.2% in the second quarter. Investment, consumption and government spending all contributed to growth, while a decline in exports provided an offset. The acceleration in quarterly growth echoed the Fed’s description of strong economic activity and reduced the urgency of an immediate shift toward monetary easing.
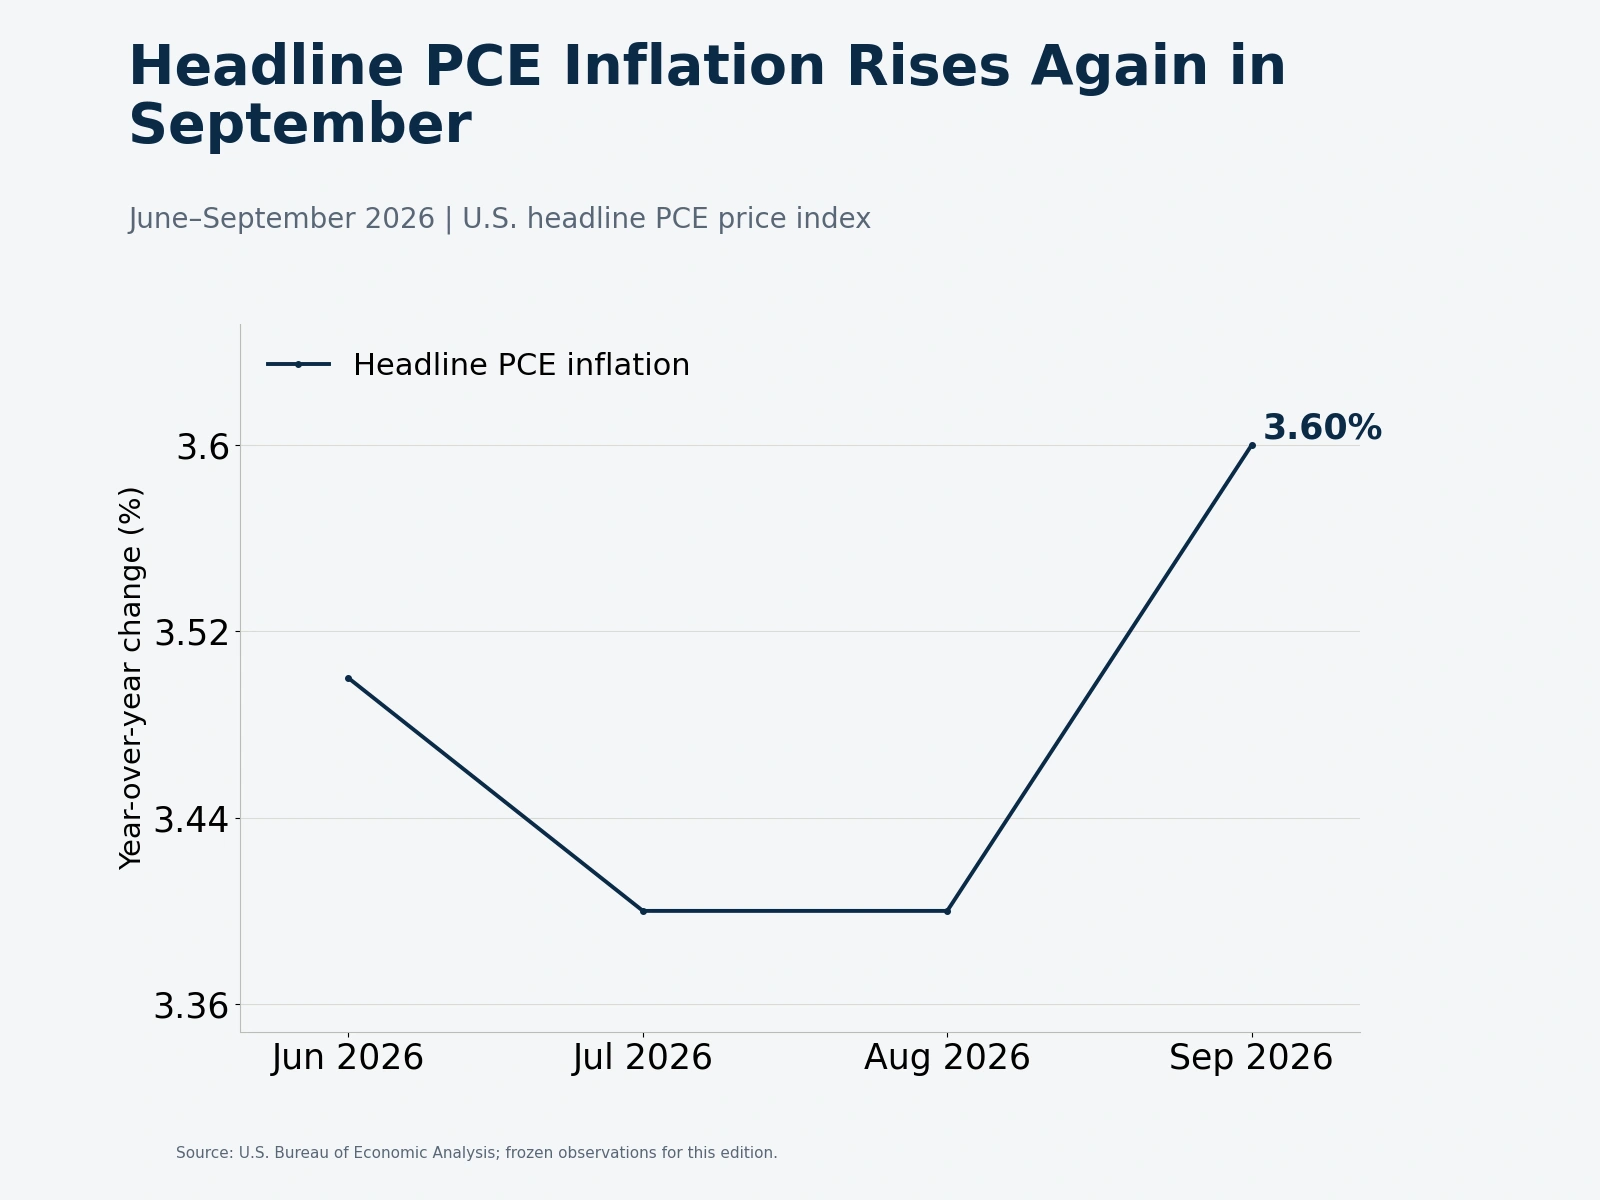
The September PCE price index, released the same day, rose 0.5% month over month, up from 0.3% in August. Its year-over-year increase widened from 3.4% in August to 3.6%. Core PCE, which excludes food and energy, rose 0.3% month over month and 3.1% year over year. From June through September, headline PCE inflation was 3.5%, 3.4%, 3.4% and 3.6% year over year, respectively, showing that the recent decline in inflation had yet to become a stable trend.
The monthly consumption figures, however, revealed another side of demand. Nominal personal consumption expenditures rose 0.5% month over month in September, but real consumption increased by less than 0.1% after adjusting for prices, rounding to 0.0% in the table. That was well below August’s 0.5% increase. Over the same period, real disposable income fell 0.3% month over month, and the personal saving rate was 3.8%. Rising prices absorbed much of the increase in nominal spending, leaving households buying almost no additional goods and services in real terms.
These data pull monetary policy in both directions. Faster quarterly growth and sticky core inflation leave grounds for further rate hikes. Falling monthly real income and stalled real consumption, meanwhile, also make it worthwhile to wait for more demand data. If real consumption continues to weaken and is followed by a slowdown in core price increases, the case for maintaining the pause will strengthen. Conversely, if demand recovers while inflation remains elevated, those favoring tighter policy will gain more support.
November Employment and Income-and-Spending Data Will Test Whether Demand and Prices Can Cool Together

With the October policy meeting over, market attention is turning to forthcoming economic indicators to assess whether employment and price pressures can ease together.
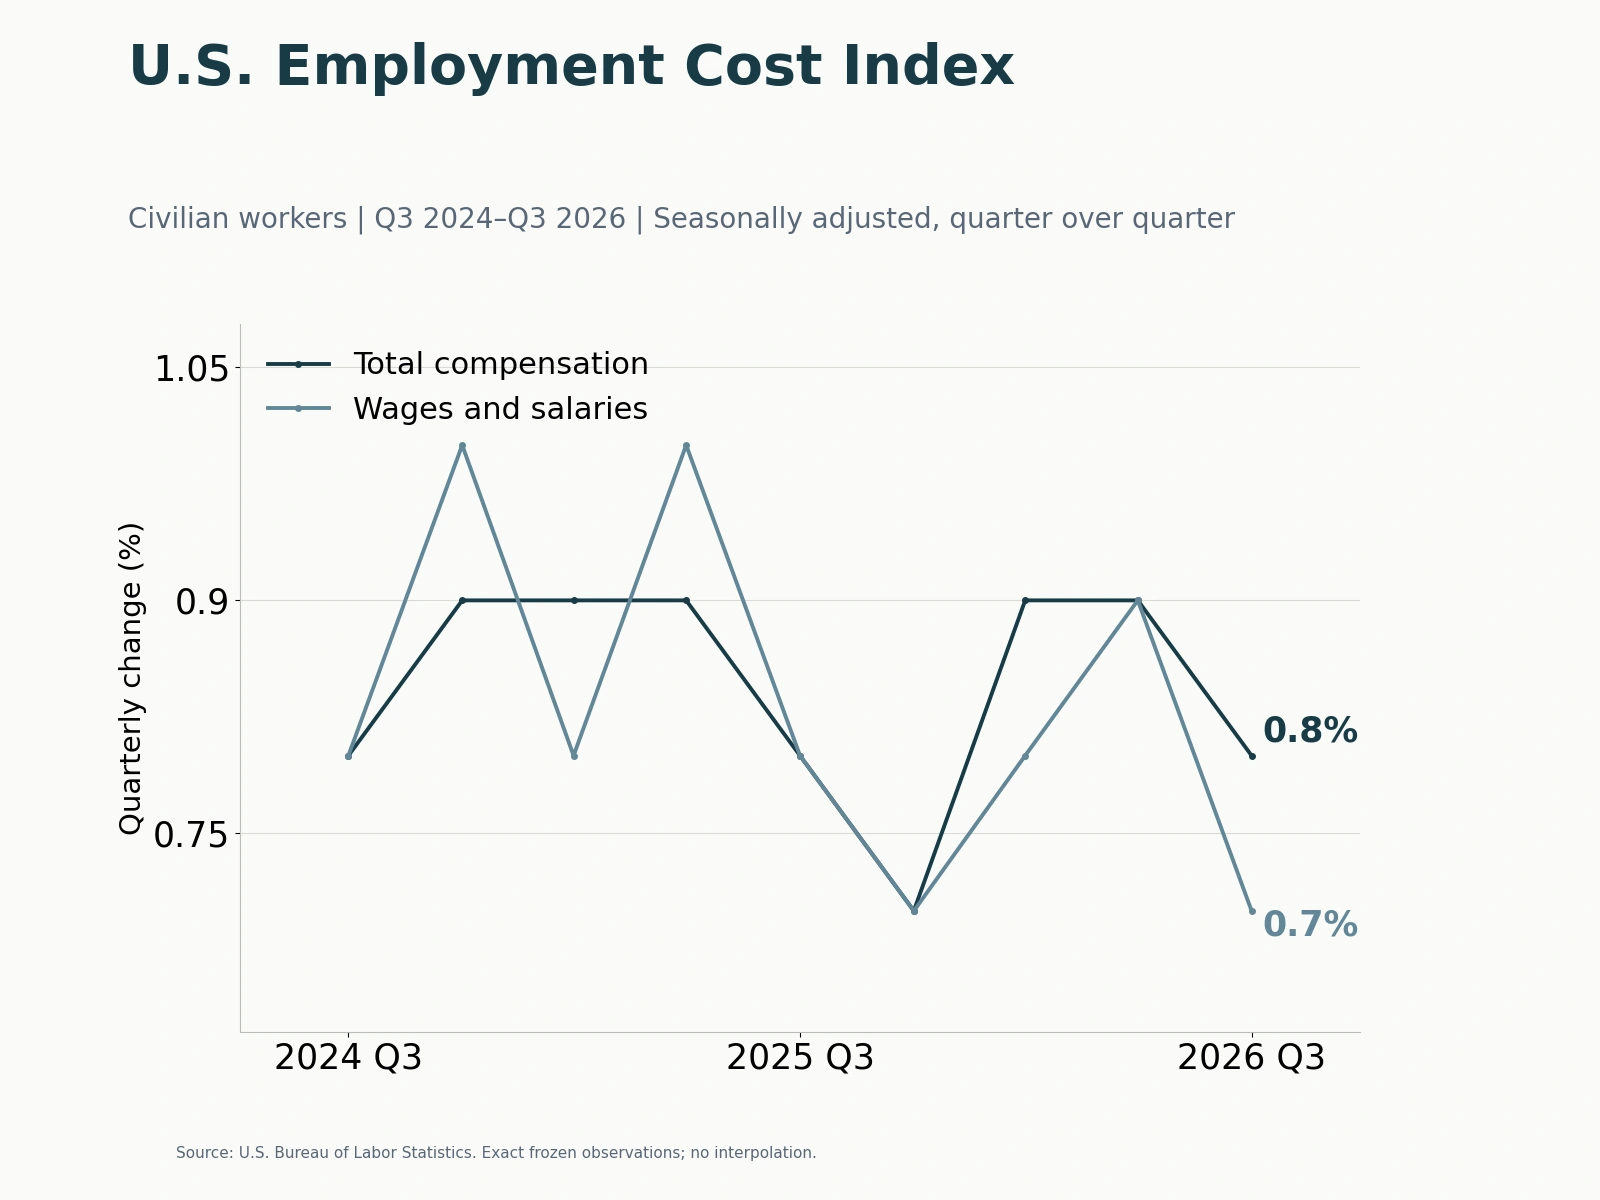
The first major test is the October employment report, scheduled for release by the U.S. Bureau of Labor Statistics on November 6. The focus will be whether job gains, the unemployment rate and wage performance continue to support the Committee’s assessment of a stable labor market. If employment and wages remain resilient, it will be harder for September’s stall in real consumption alone to change the direction of policy. If the labor market also cools noticeably, the Committee will have more evidence with which to assess the effects of its earlier tightening.
In addition, October personal income and outlays data, scheduled for November 25, and the updated third-quarter GDP figures due the same day will provide further tests of consumption and price trends. For the future policy path, the most informative questions are whether core inflation can continue to slow and what changes in employment and real demand accompany that slowdown. The October pause in rate hikes preserved this window for policy observation; subsequent data will determine how long it can remain open.