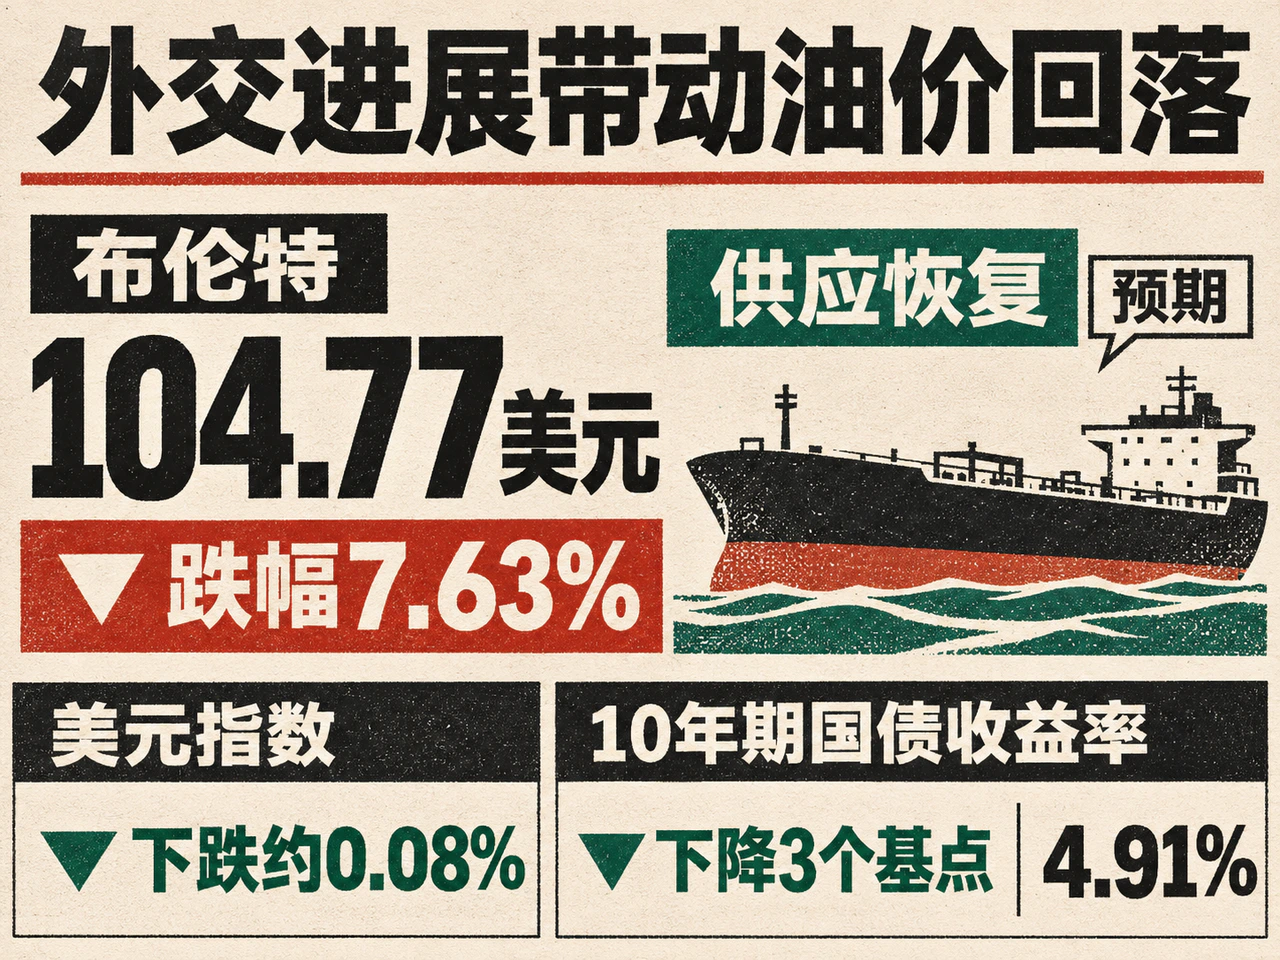
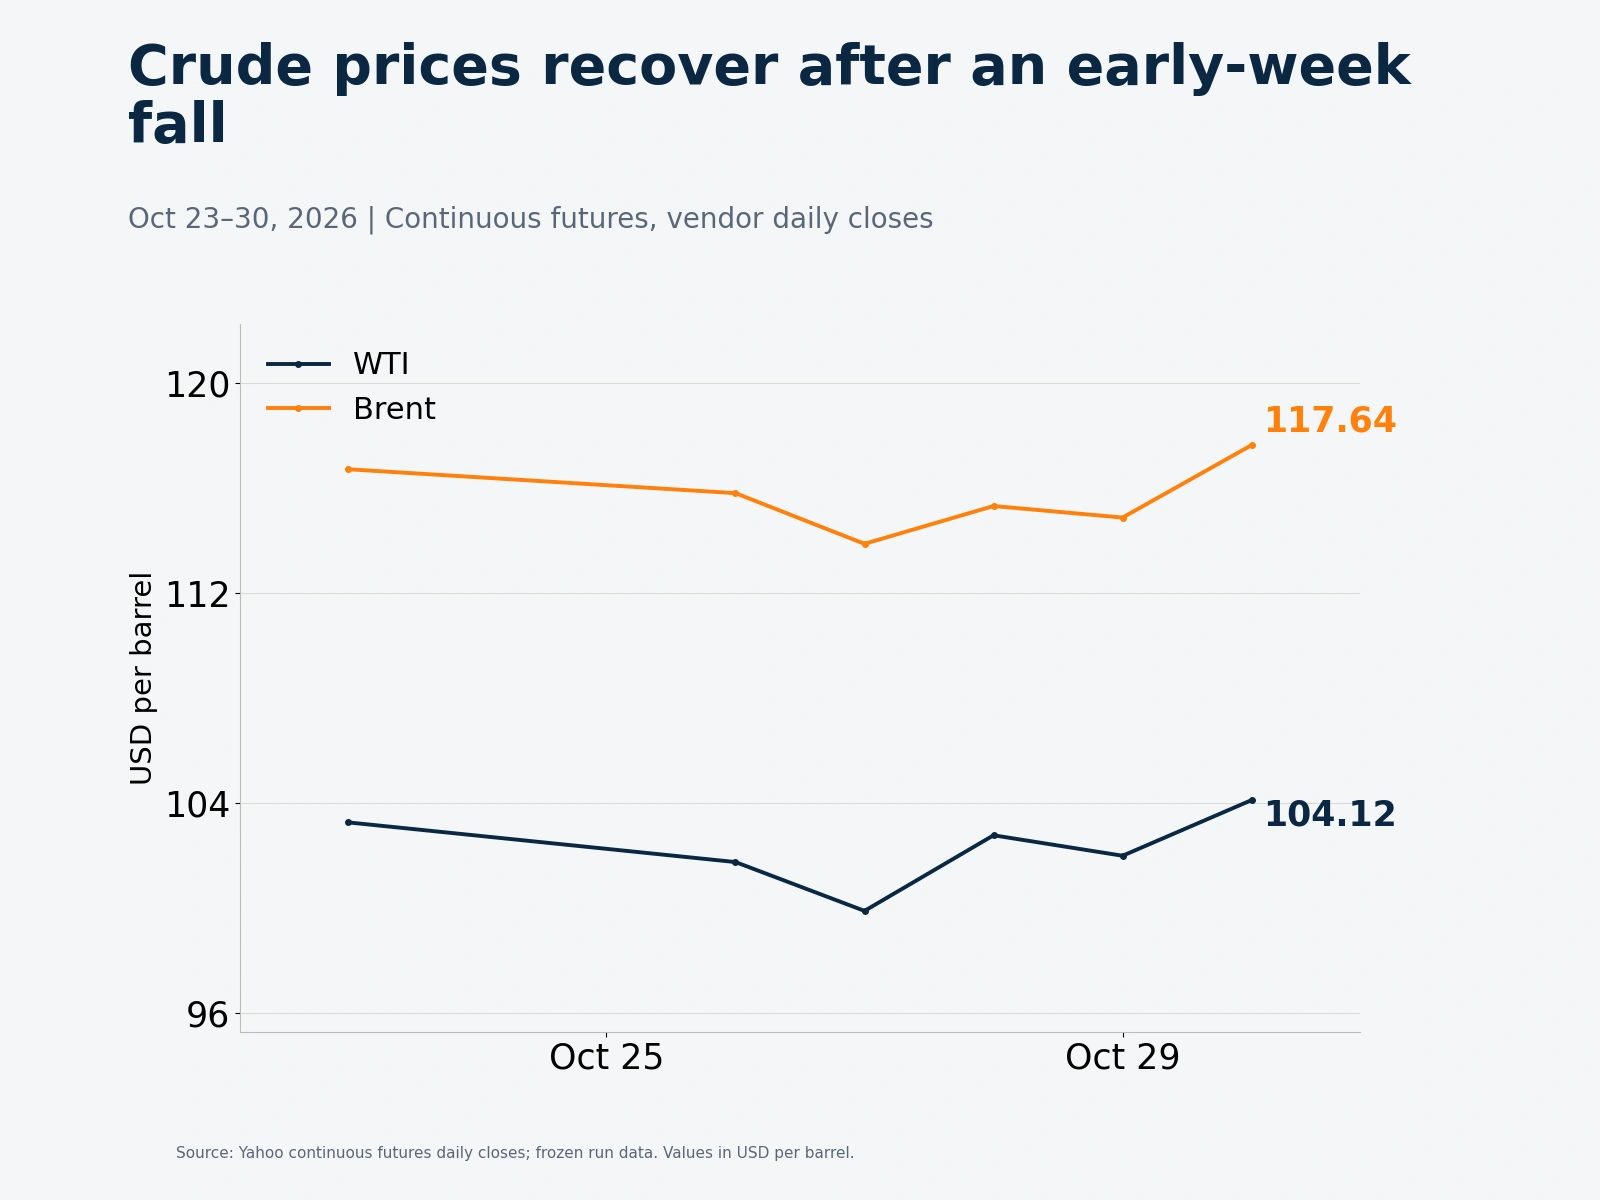
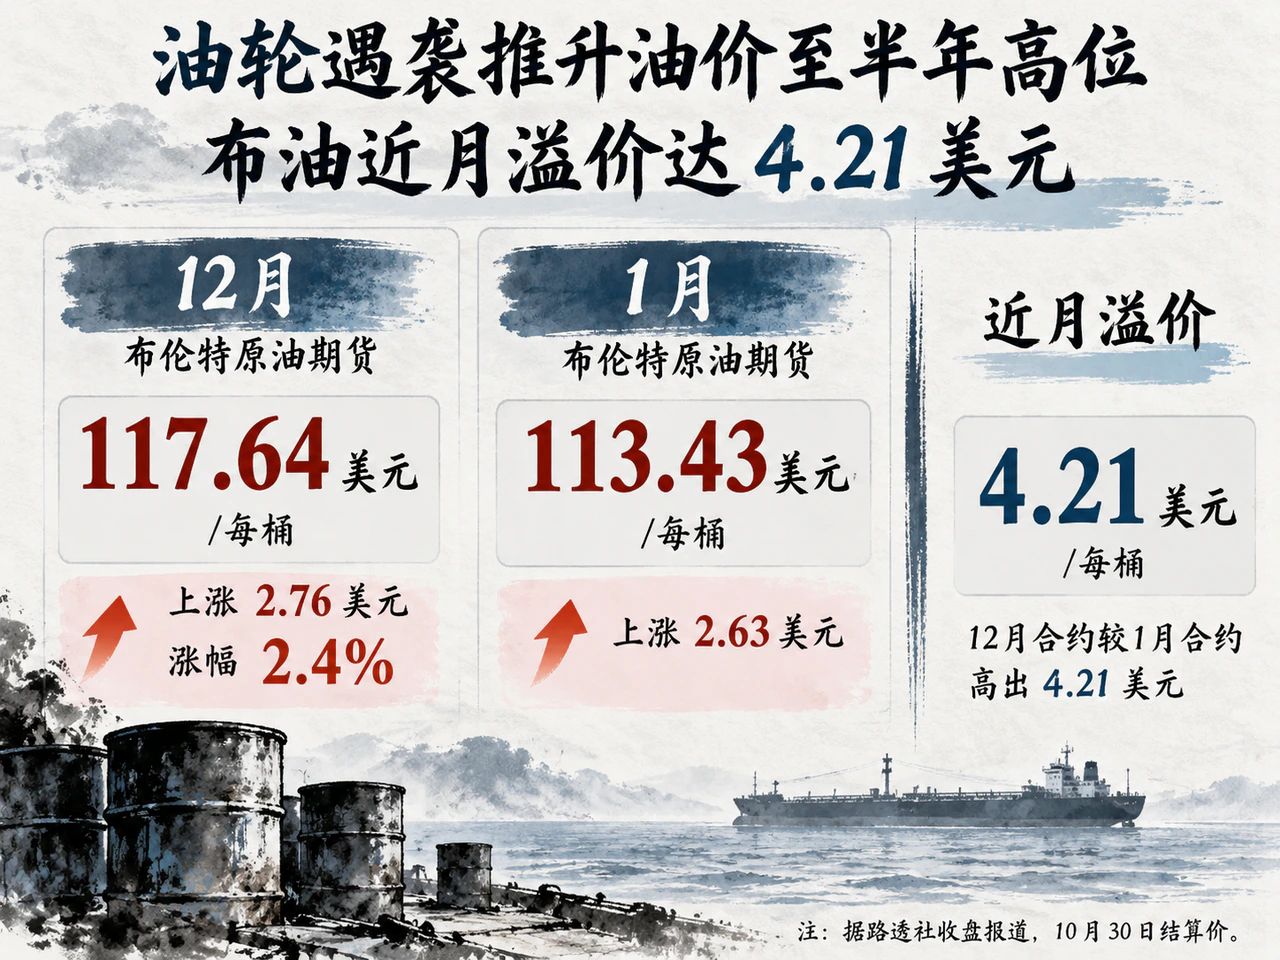
On November 3, 2026, international oil prices extended the previous trading day’s decline. Reuters’ settlement report for the day put Brent futures at $103.60 per barrel, down $1.17, and WTI futures at $96.09 per barrel, down $0.37—their lowest settlements since October 7 and October 14, respectively. Expectations for US–Iran and Russia–Ukraine talks weighed on risk premiums, but the recovery in physical supply was not keeping pace: crude trade was seeking alternative export routes, while global refinery runs had yet to return to year-earlier levels.
Prospects for US–Iran and Russia–Ukraine talks weigh on risk premiums, while near-term delivery risks persist
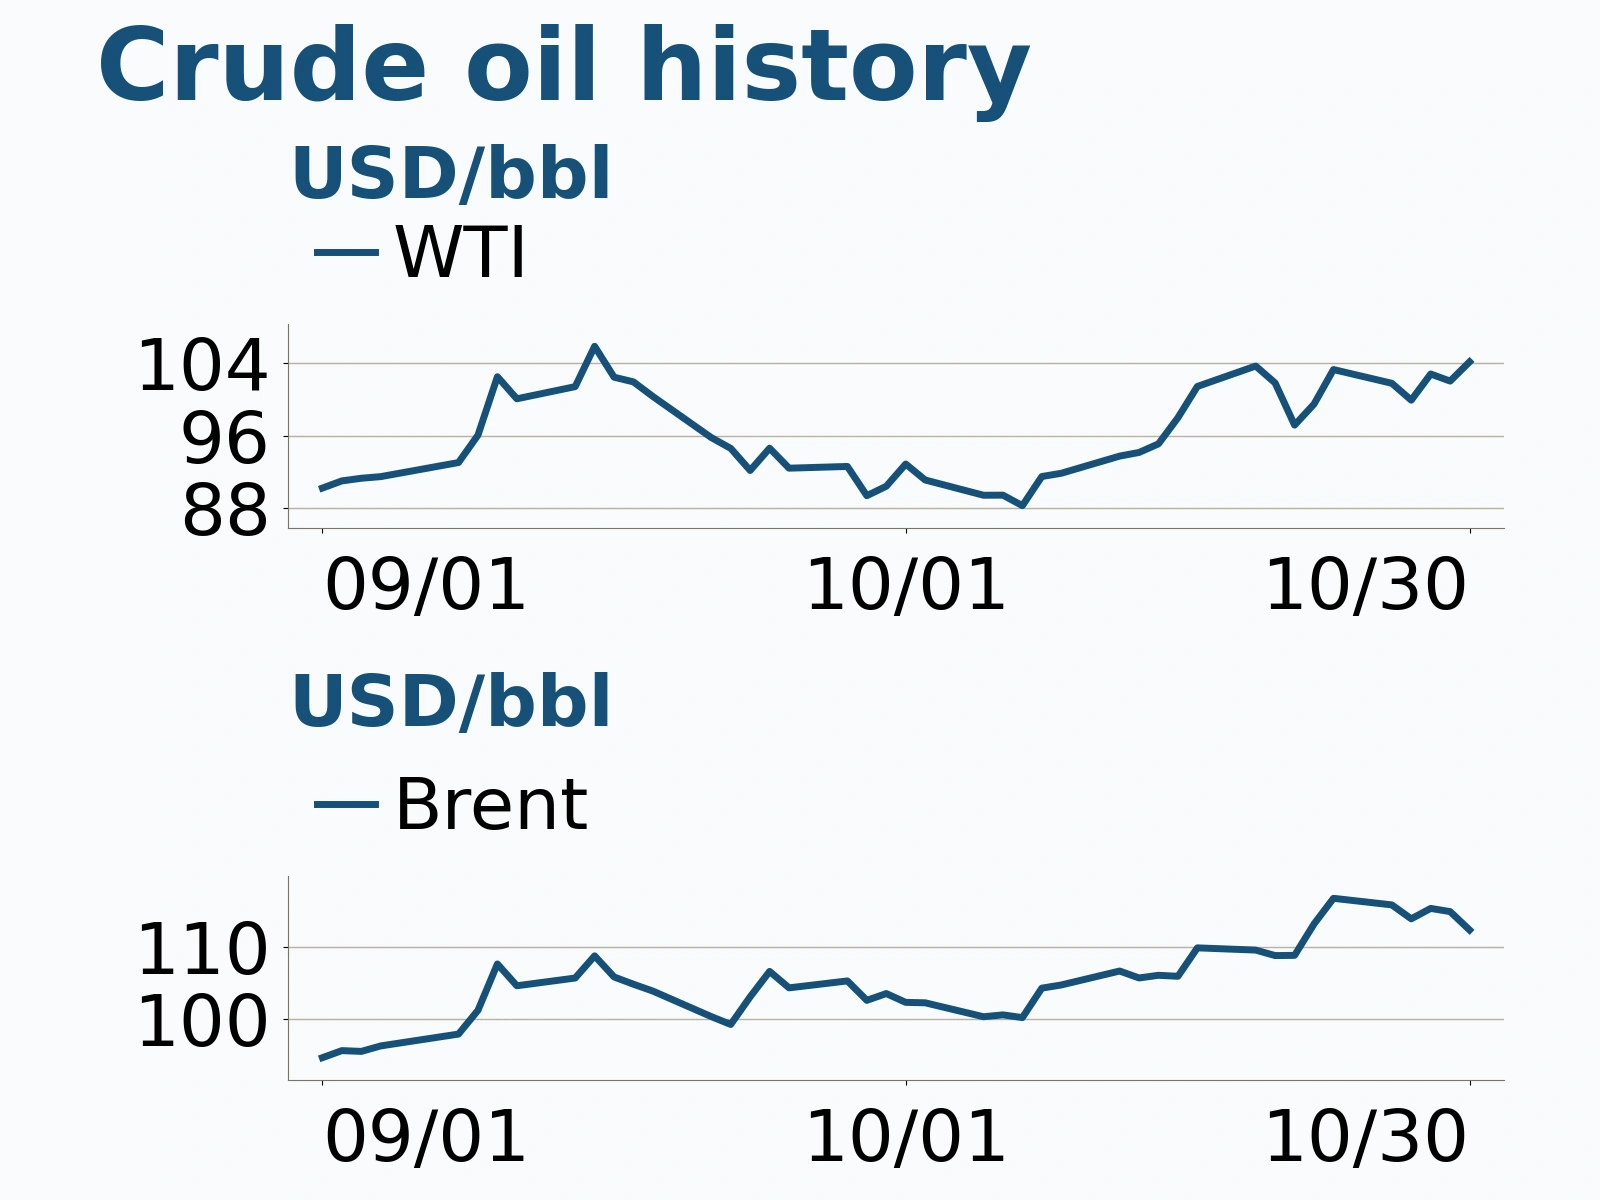
A spokesperson for Qatar’s foreign ministry said on November 3 that the United States and Iran remained committed to mediation and were reviewing proposals to bridge their differences. A senior Iranian official, however, told Reuters that the two sides were still far from an agreement to end the war. In analysis published the same day, ING argued that crude flows from the Persian Gulf were already relatively strong and that prices still incorporated a substantial risk premium. Material progress in the talks would put further downward pressure on prices.
New talks were also scheduled on Russia and Ukraine. The Kremlin confirmed that Russia, Ukraine and the United States would hold trilateral talks in Abu Dhabi on November 10–11. If an eventual agreement improves the conditions for Russian energy exports, supply expectations will adjust accordingly. Meanwhile, Russian refineries and Black Sea shipping continue to face attacks, leaving near-term delivery risks in place.
Oil prices are thus being pulled by two forces: negotiations improve expectations for future supply, while damaged facilities and high transport costs support the price of immediate delivery. Across nearby and deferred contracts, the former determines how long the market is willing to pay a premium for persistent shortages; the latter determines whether prompt cargoes still command an extra payment. A sustained improvement in exports, insurance and transport would make it easier for lower risk premiums to translate into lower actual procurement costs for refineries.
Global refinery runs rebound by 1.8 million b/d quarter on quarter, but remain about 5% below year-earlier levels
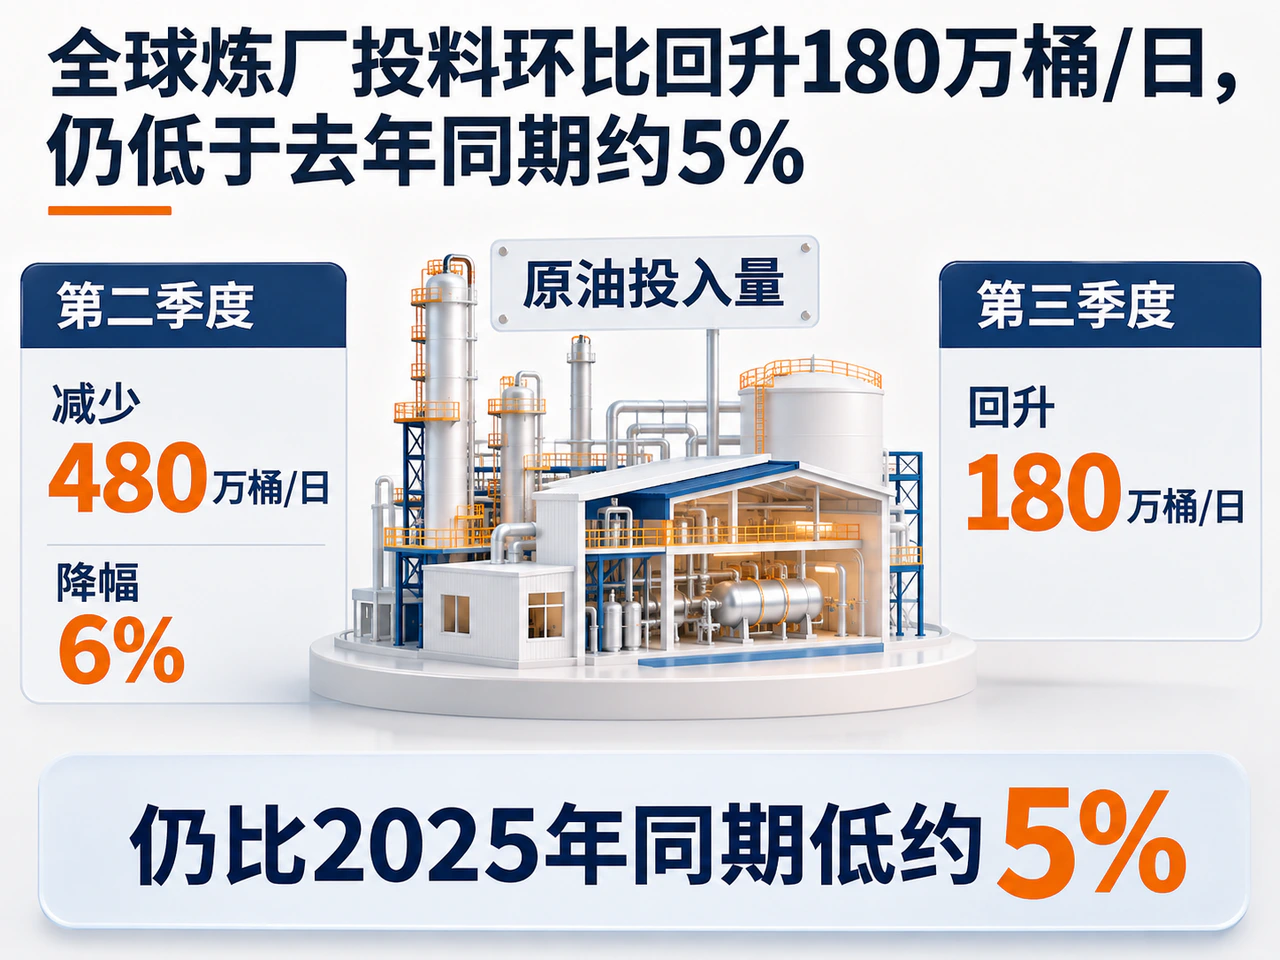
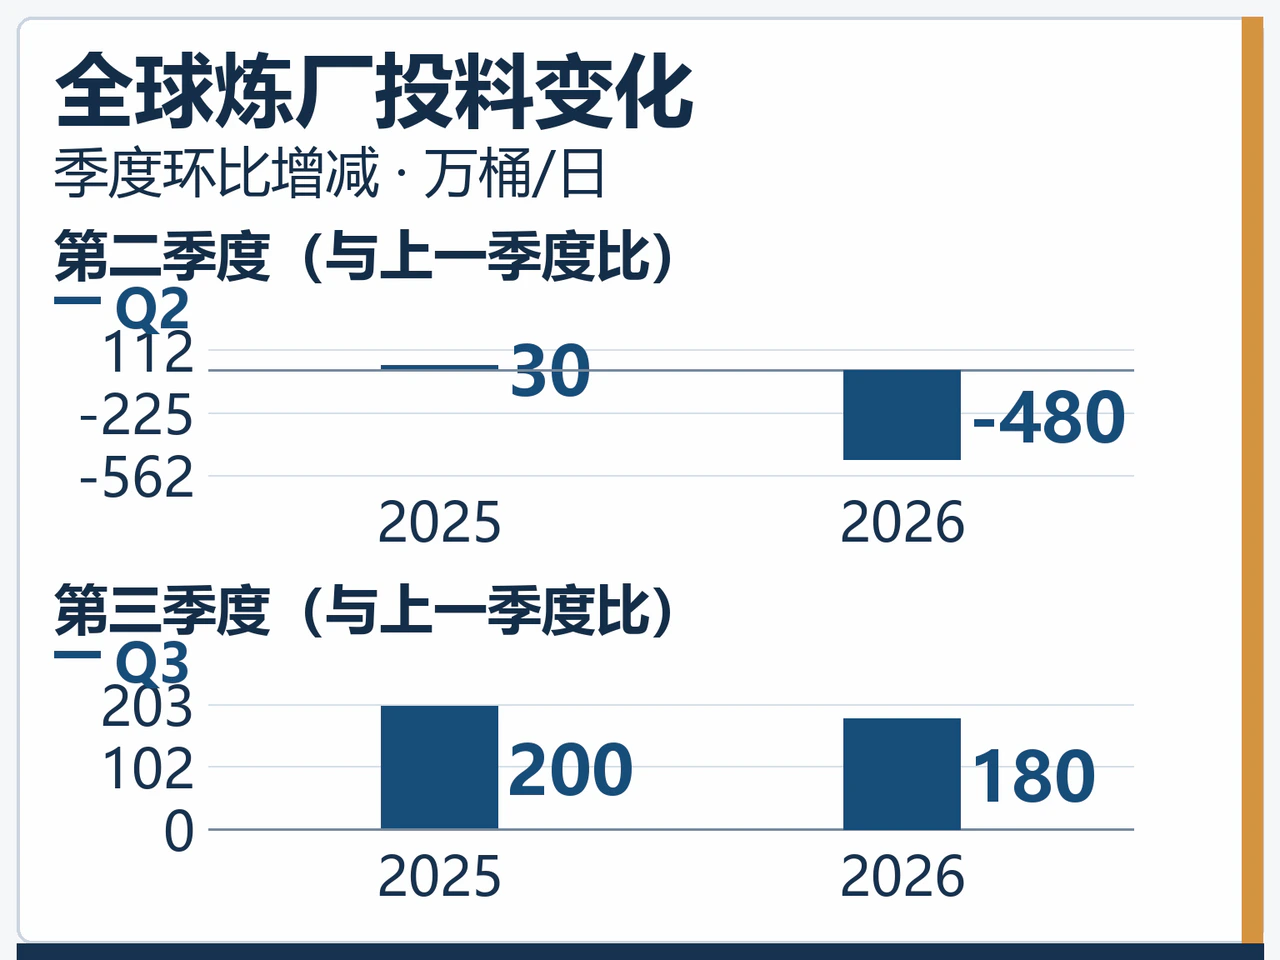
An analysis released by the US Energy Information Administration (EIA) on November 3, citing Kpler data, said global refinery crude inputs fell by 4.8 million barrels per day (b/d), or 6%, quarter on quarter in the second quarter of 2026. Inputs recovered by 1.8 million b/d in the third quarter but remained about 5% below the same period in 2025. As a seasonal comparison, global inputs increased by 0.3 million b/d and 2.0 million b/d quarter on quarter in the second and third quarters of 2025, respectively. This year’s third-quarter recovery still left a substantial shortfall.
The improvement came mainly from new trade routes. The EIA noted that increased traffic through the Strait of Hormuz, greater use of alternative routes and more ship-to-ship transfers allowed more Middle Eastern crude to re-enter global markets. After falling by more than 1 million b/d in aggregate in the second quarter, refinery runs in India, South Korea and Japan rebounded by 0.8 million b/d in the third. US refinery runs rose by 0.5 million b/d in each of the two consecutive quarters, alongside an expansion in refined-product exports.
Russia moved in the opposite direction: refinery crude inputs fell by 0.6 million b/d in the second quarter and another 0.8 million b/d in the third. Russia is a major diesel exporter. The damage to refineries and its impact on diesel supply, combined with constraints on processing in Asia and the Middle East, also explain why pressure in refined-product markets may persist even after crude prices fall. End-user fuel supply will improve fully only when both crude deliveries and refinery processing recover.
Saudi Aramco begins pipeline expansion, as transport bottlenecks continue to constrain additional supply

Saudi Aramco CEO Amin Nasser said on November 3 that work had begun on expanding the East–West crude pipeline and adding new networks. The pipeline can currently carry up to 7 million b/d of crude. Last month, Saudi Arabia proposed raising pipeline crude export capacity to as much as 10 million b/d by repurposing domestic natural gas pipelines and investing in the existing network. Additional export routes remain under engineering study.
The plan puts transport infrastructure at the center of the longer-term supply recovery. The crude available to refineries today, however, still depends on existing pipelines, Red Sea exports and passage through the strait. OPEC+’s November 1 decision to leave December production targets unchanged also makes transport bottlenecks an important factor in assessing additional supply.
Four sets of developments will be particularly important over the next few trading days.
- If US–Iran mediation produces arrangements on navigation and sanctions, it would support a further decline in risk premiums. A renewed escalation would instead heighten near-term delivery risks.
- Sustained improvements in actual throughput and exports through Saudi Arabia’s bypass pipelines are needed to turn expectations for expansion into additional supply.
- The next weekly US inventory report needs to be read alongside refinery utilization and imports and exports. A Reuters poll forecast a 0.9 million-barrel increase in US crude inventories for the week ended October 30. An inventory build caused by lower refinery inputs would carry a different meaning from one driven by rising supply.
- A recovery in Russian refineries and an improvement in diesel supply would help ease the impediments to passing lower crude prices through to end-user fuels.