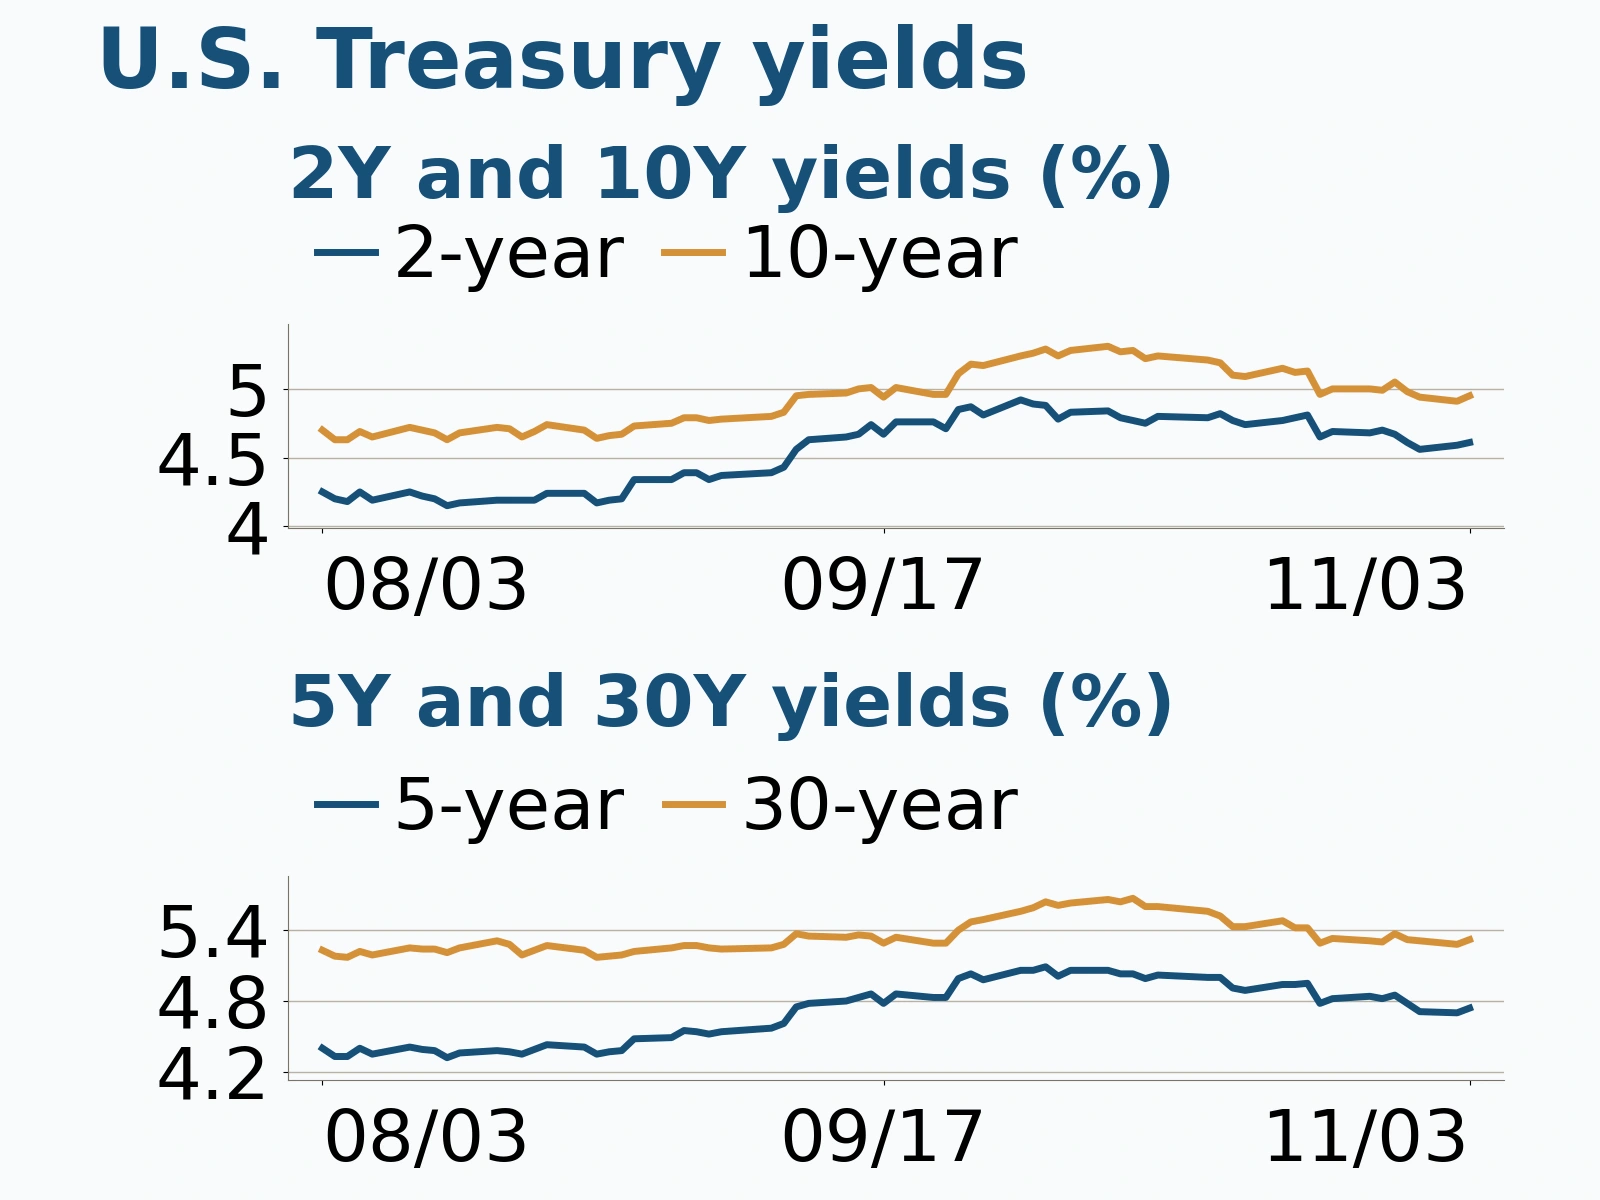
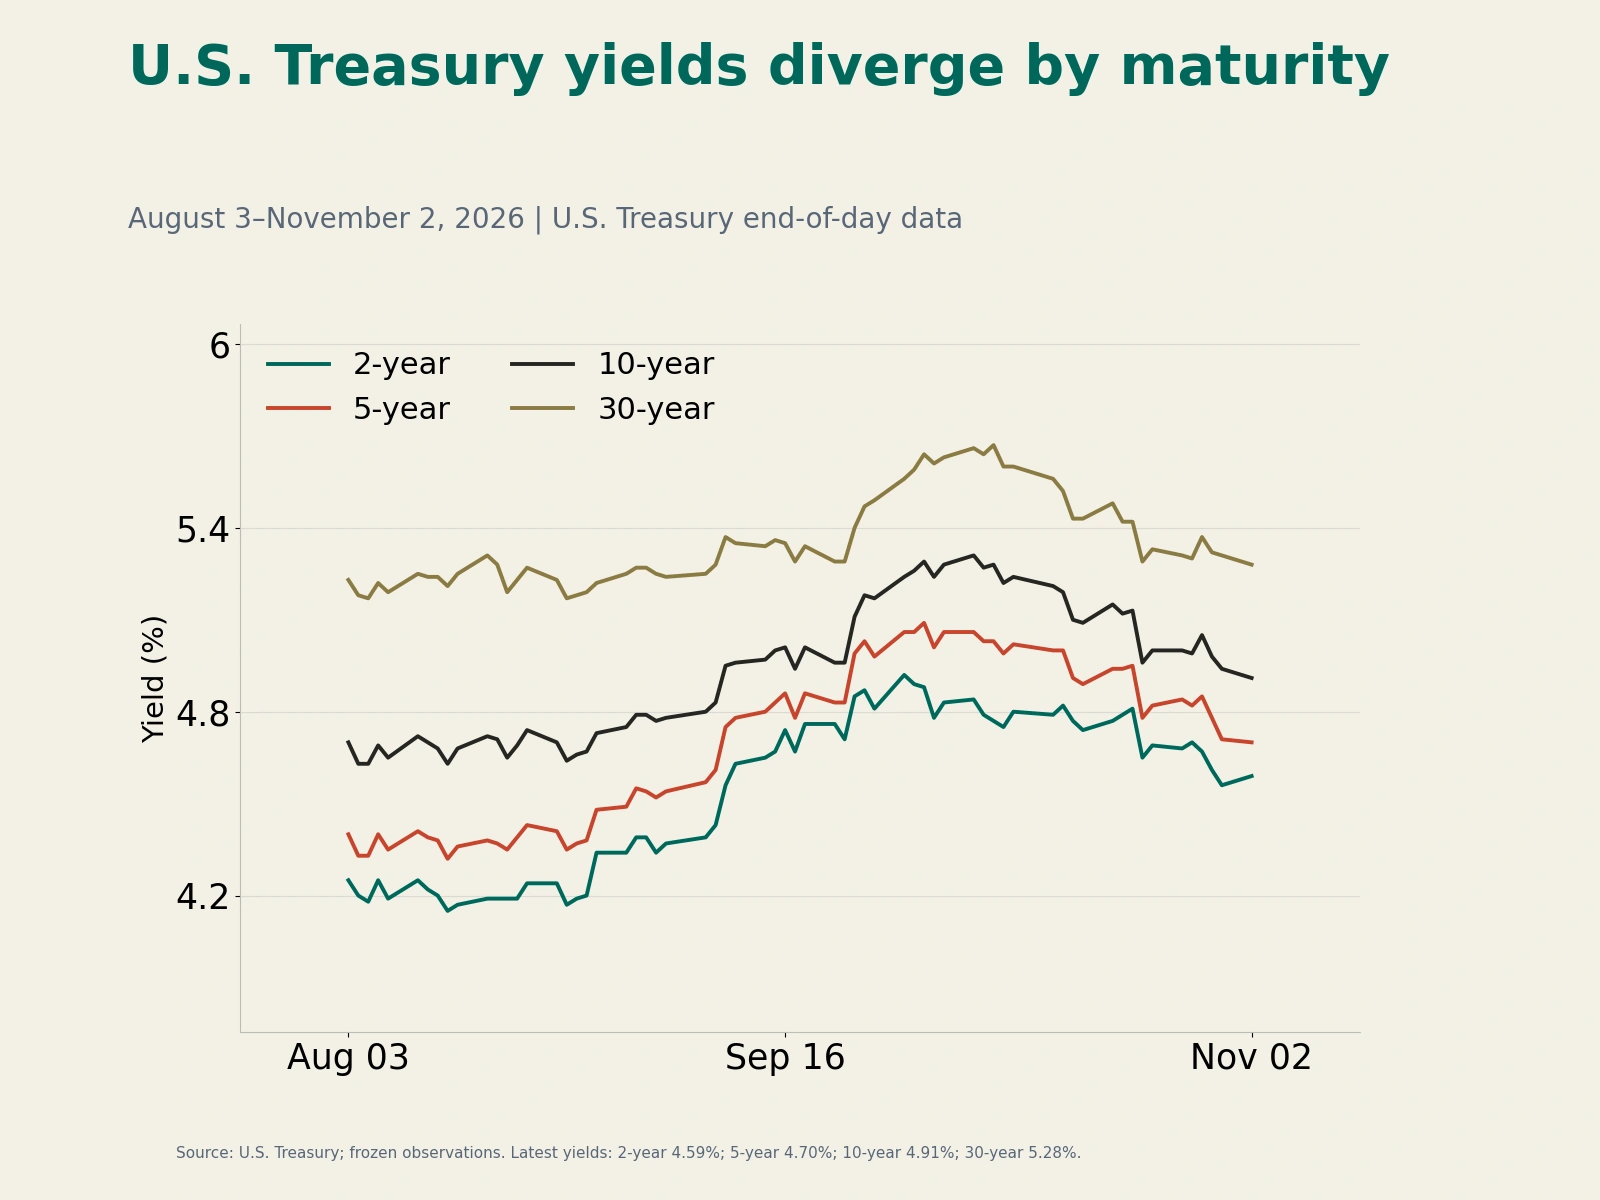
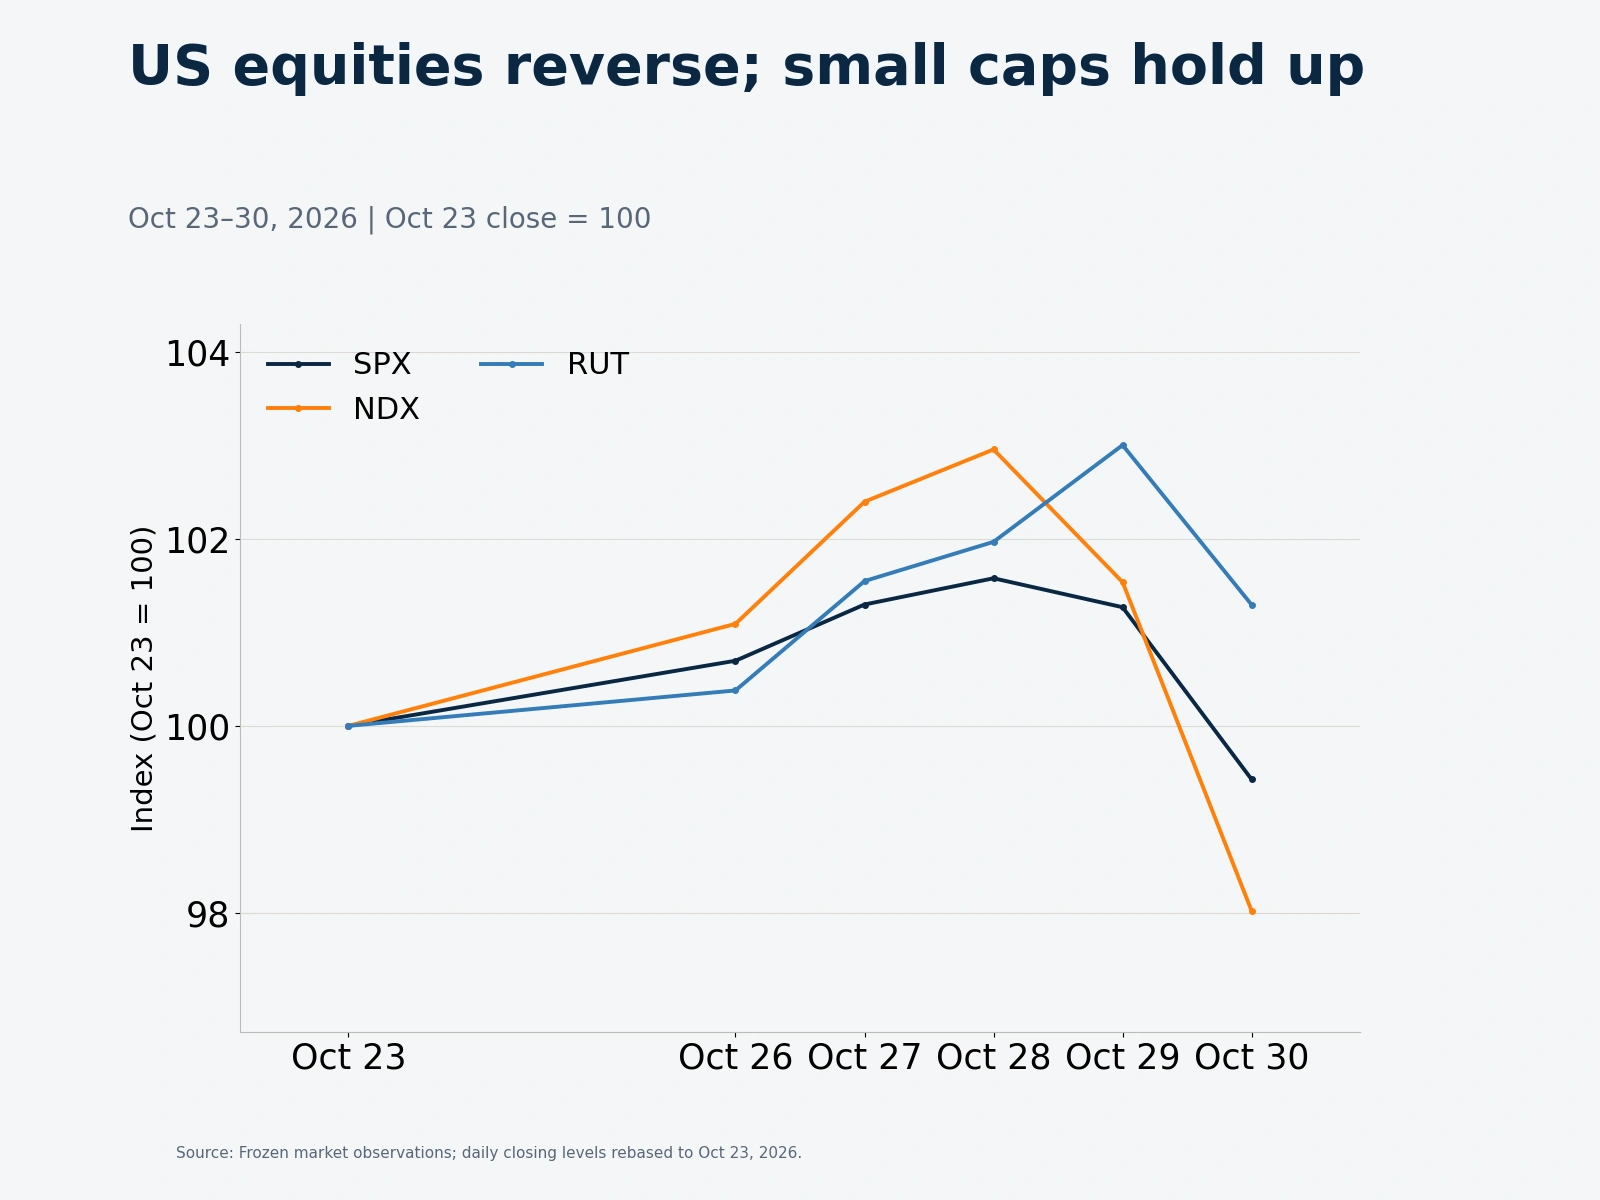
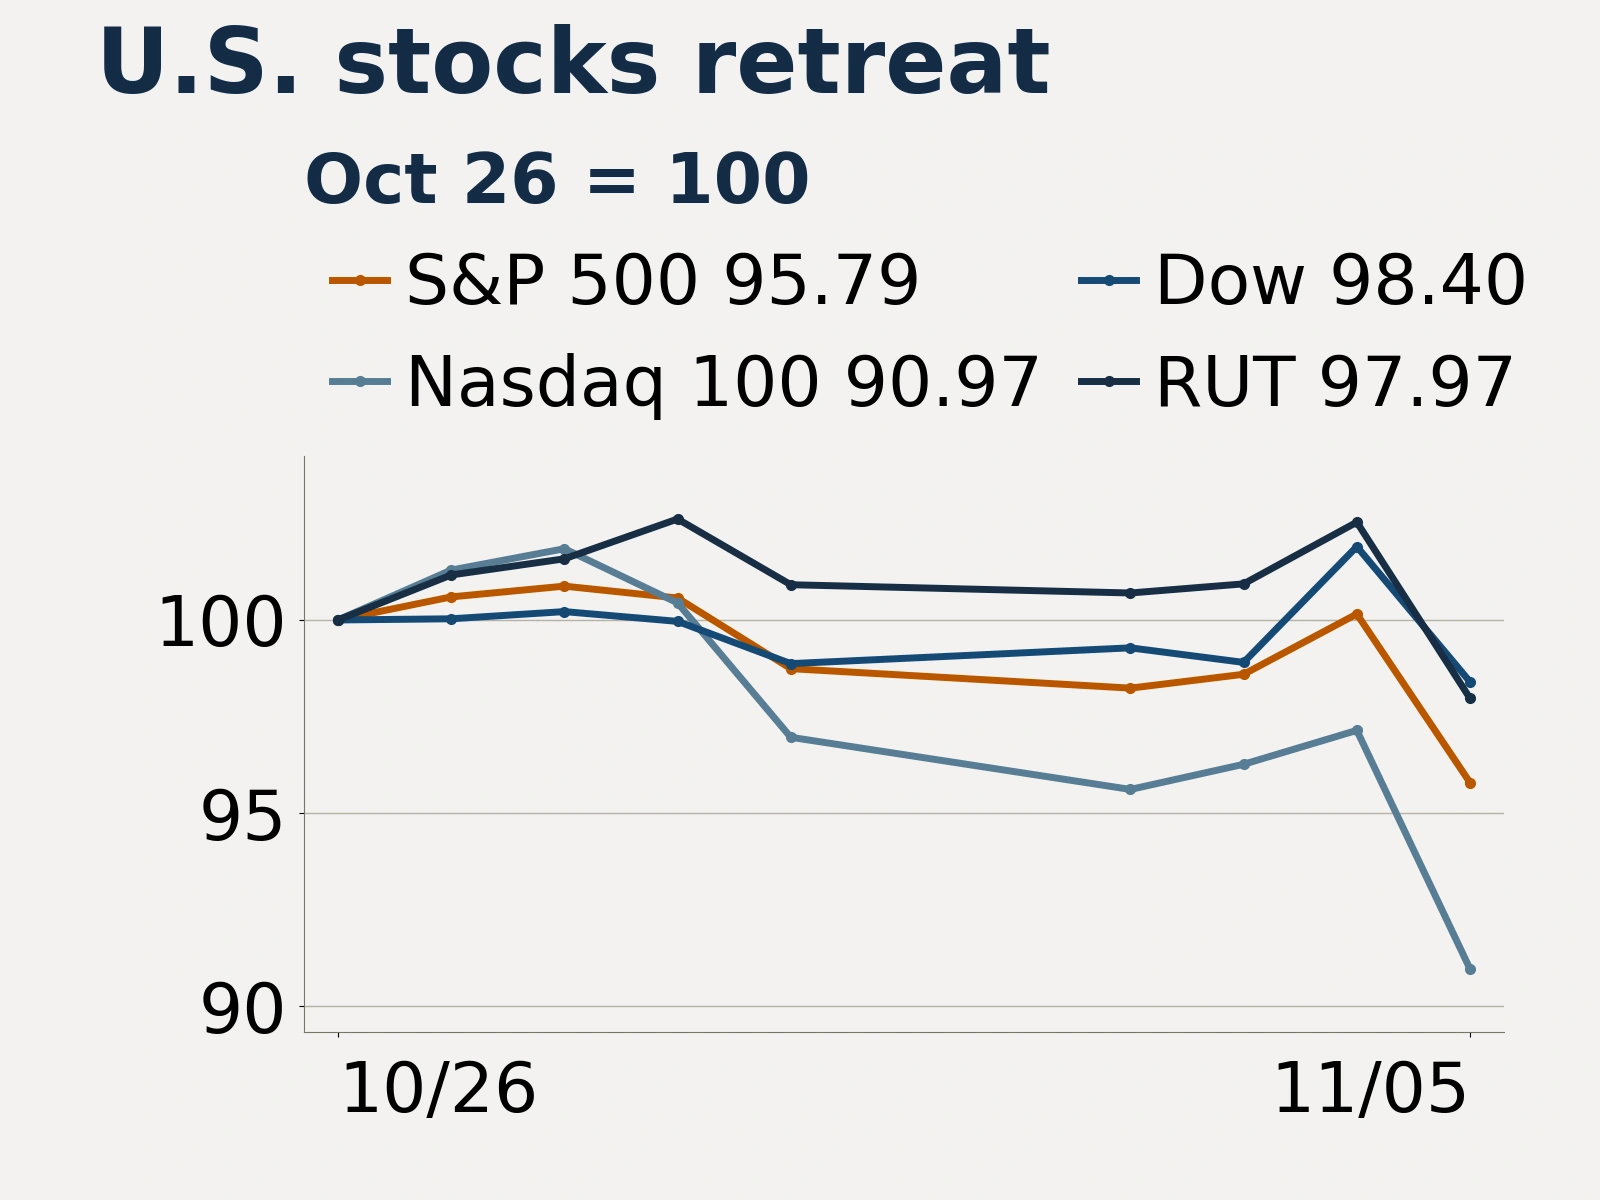
On November 5, 2026, U.S. stocks reversed the previous day's sharp rebound and tumbled. Tighter local permitting raised concerns that data center construction could slow. Selling hit the AI supply chain hardest and drove investors into U.S. Treasuries. The S&P 500 fell 4.36% and the Nasdaq 100 sank 6.36%. Two-year and 10-year Treasury yields fell 12 and 6 basis points, respectively. In commodities, oil rebounded as shipping security risks resurfaced, while lower yields helped gold end higher. U.S. initial jobless claims and productivity data released that day remained solid, offering some support to the economy.
Tighter local permitting exposes construction bottlenecks as AI stocks sell off
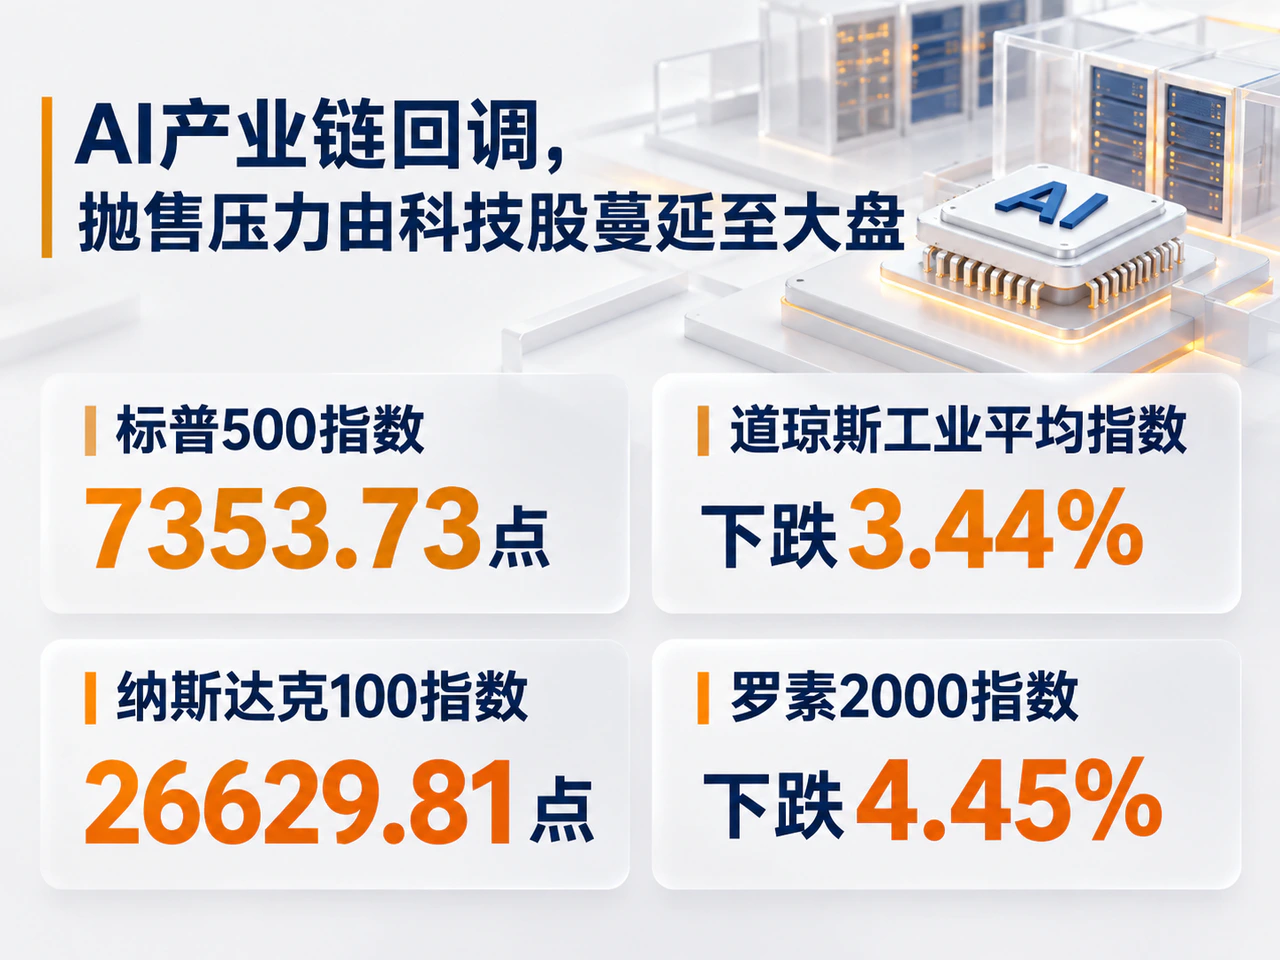
Major U.S. stock indexes fell sharply across the board. The S&P 500 closed at 7,353.73 and the Nasdaq 100 at 26,629.81. The Dow Jones Industrial Average dropped 3.44% to 51,523.06, and the Russell 2000 fell 4.45% to 2,729.89. The VIX jumped 11.57 points to 28.18 from 16.61 as the options market priced in substantially higher equity volatility. The technology sector ETF (XLK) plunged 8.00%, while the financials ETF (XLF) fell 2.87% and the energy ETF (XLE) lost 2.98%. Selling had spread beyond technology to the broader market.
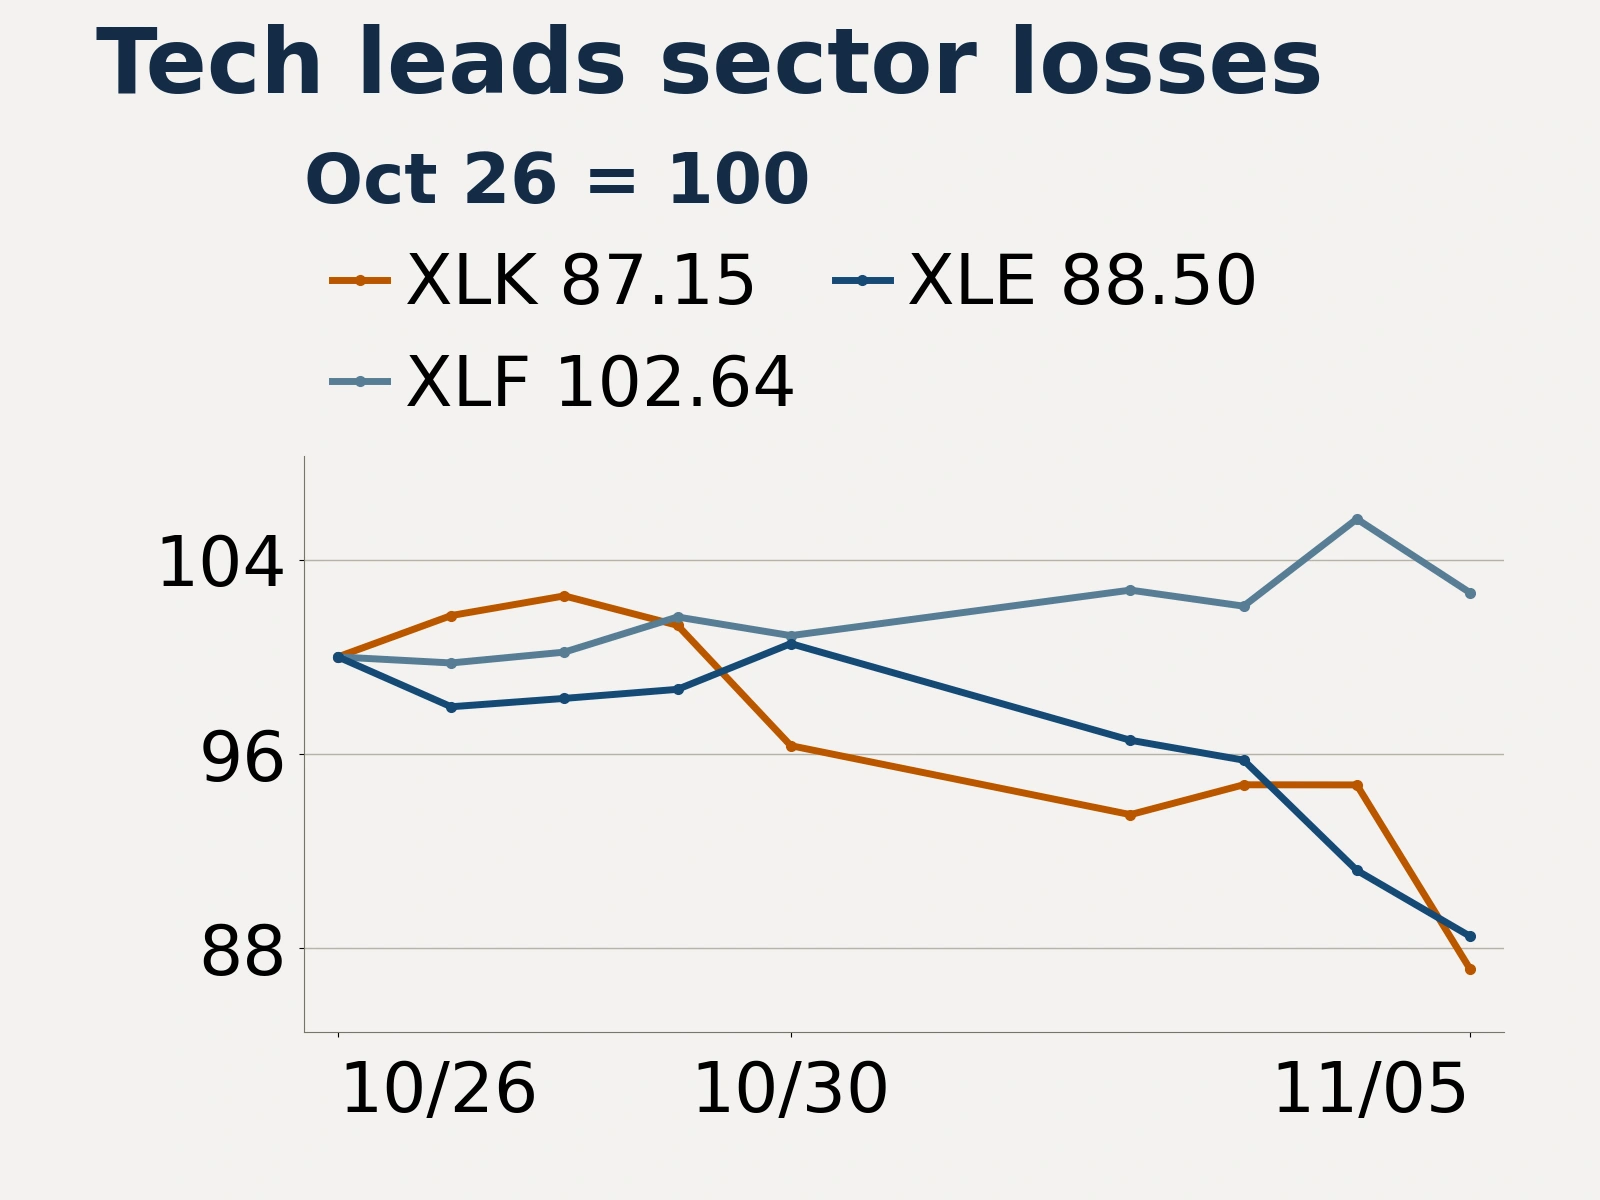
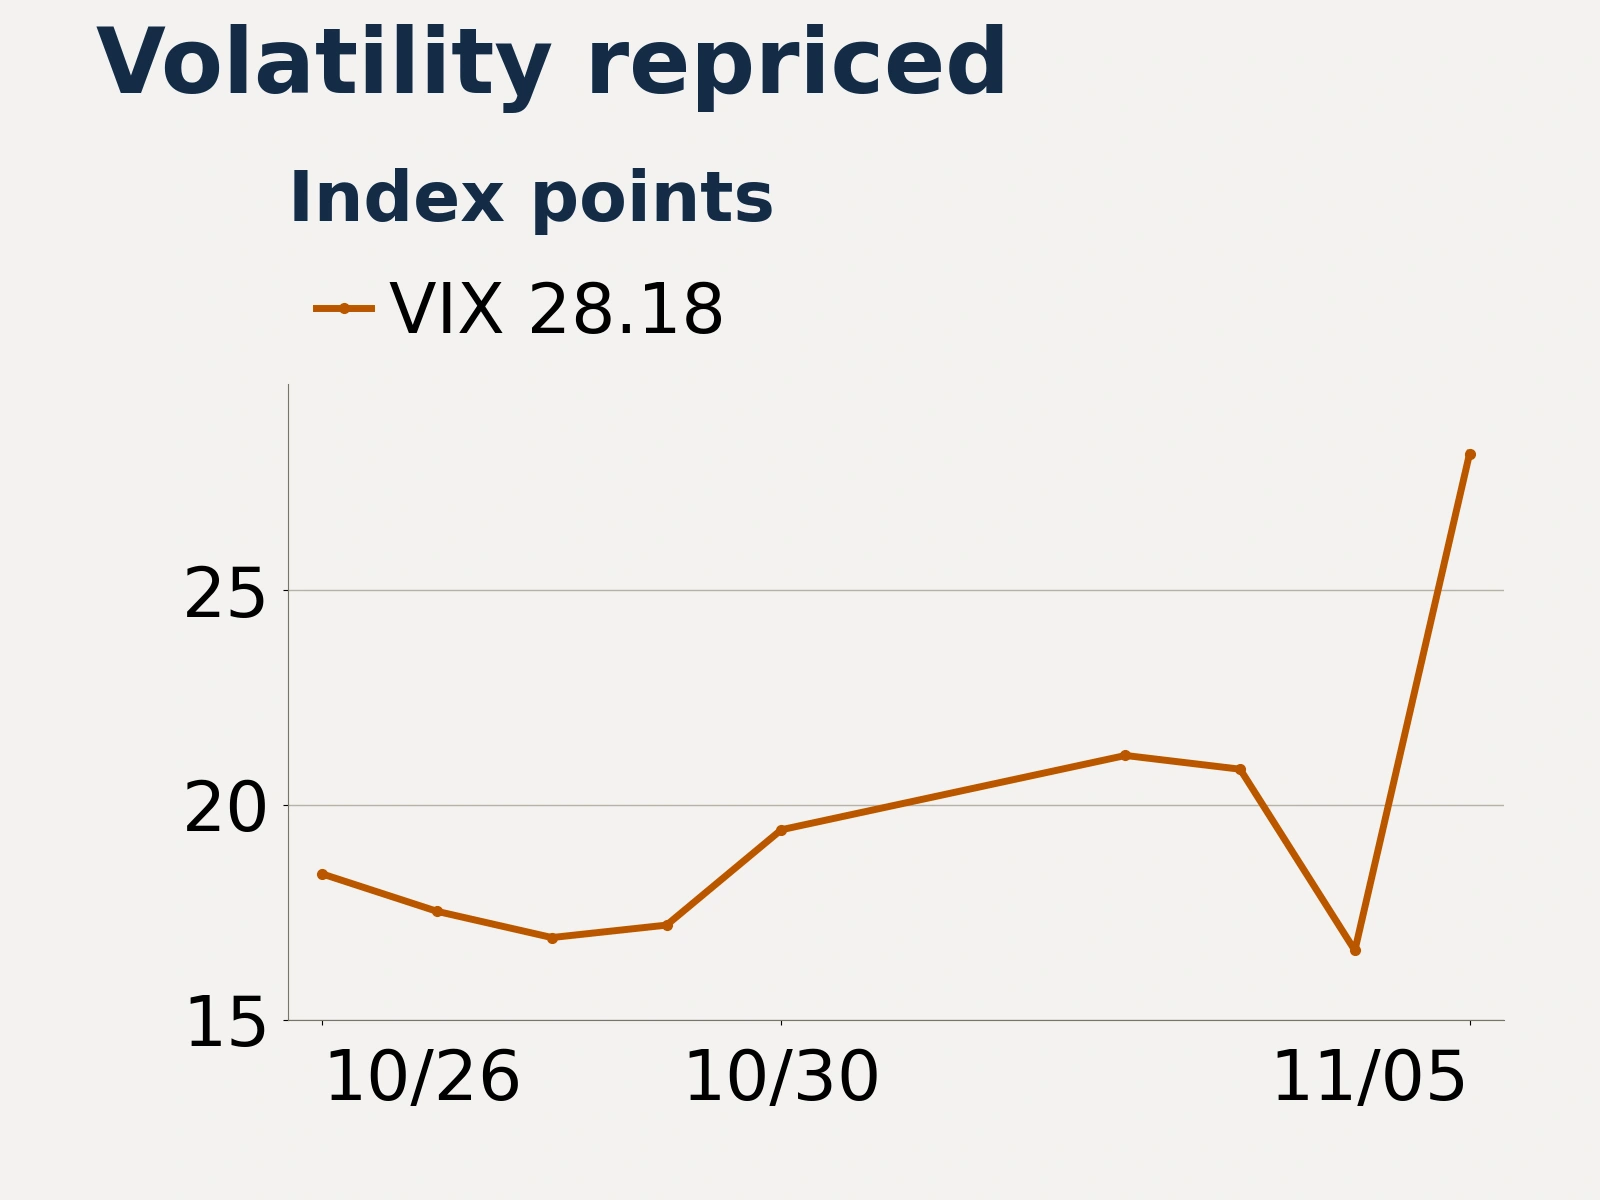
Local permitting hurdles for data centers and the prospect of higher costs set off the sell-off. Fox Business, citing local election results, reported that Ohio communities including Defiance, Pataskala and Granville had passed charter amendments restricting data center construction. The governors-elect of Texas and Ohio have also called for pauses on new projects or tougher oversight. With local restrictions already in place and state-level proposals still to play out, investors are reassessing how quickly projects can move ahead.
The timing of data center openings depends heavily on local permits, power availability and supporting community infrastructure. Longer construction schedules push back chip purchases, data center leases and orders for electrical equipment, extending the gap between upfront financing outlays and positive operating cash flow. Shares in chipmakers, cloud computing providers and power equipment manufacturers fell in tandem. The Associated Press reported that AMD plunged 17.3%, CoreWeave fell 9.8%, Nvidia dropped 9.3% and GE Vernova lost 7.5%. The moves suggest investors are reassessing when spending across the AI supply chain will turn into revenue.
The sell-off also came amid mounting pressure from financing costs and an ongoing debate about valuations. The Nasdaq 100 had retreated from 29,813.16 on October 28. It rebounded to 28,437.17 on November 4, then fell sharply again the next day. Views differ on the impact of the new policy constraints. Barclays Private Bank said additional infrastructure requirements and compensation for local communities could raise development costs. Tema ETFs argued that the market had overreacted, saying changes in officeholders and rules would take time and long-term demand for computing capacity, grid infrastructure and cooling equipment remained strong. Investors are weighing whether tighter rules will raise costs and delay construction or materially reduce total investment.
As risk appetite weakened, earnings guidance continued to drive differences between individual stocks. CNBC reported that Qualcomm's earnings beat expectations, but weak profit guidance for the next fiscal quarter sent shares down about 9%. The Associated Press reported that AppLovin surged 31% after beating both revenue and profit expectations, while Tapestry gained 7.1% after beating profit estimates and raising its revenue and earnings guidance for the fiscal year. Airbnb's results, released after the U.S. market close, pointed to continued strength in demand for consumer services. Third-quarter revenue rose 19% year over year to $4.87 billion, diluted earnings per share of $3.16 beat analysts' $2.85 estimate, and the company raised its full-year revenue growth outlook to nearly 20%.
Equity sell-off draws buyers into Treasuries as yields fall and the curve steepens

Demand for safe assets during the equity sell-off lifted Treasury prices. The U.S. Treasury's official daily yield curve for November 5 showed the 2-year yield down 12 basis points to 4.46%, the 5-year down 10 basis points to 4.59%, the 10-year down 6 basis points to 4.84% and the 30-year down 3 basis points to 5.25%. Short-term yields fell more than long-term yields, widening the 10-year minus 2-year spread from 32 to 38 basis points in a bull steepening.
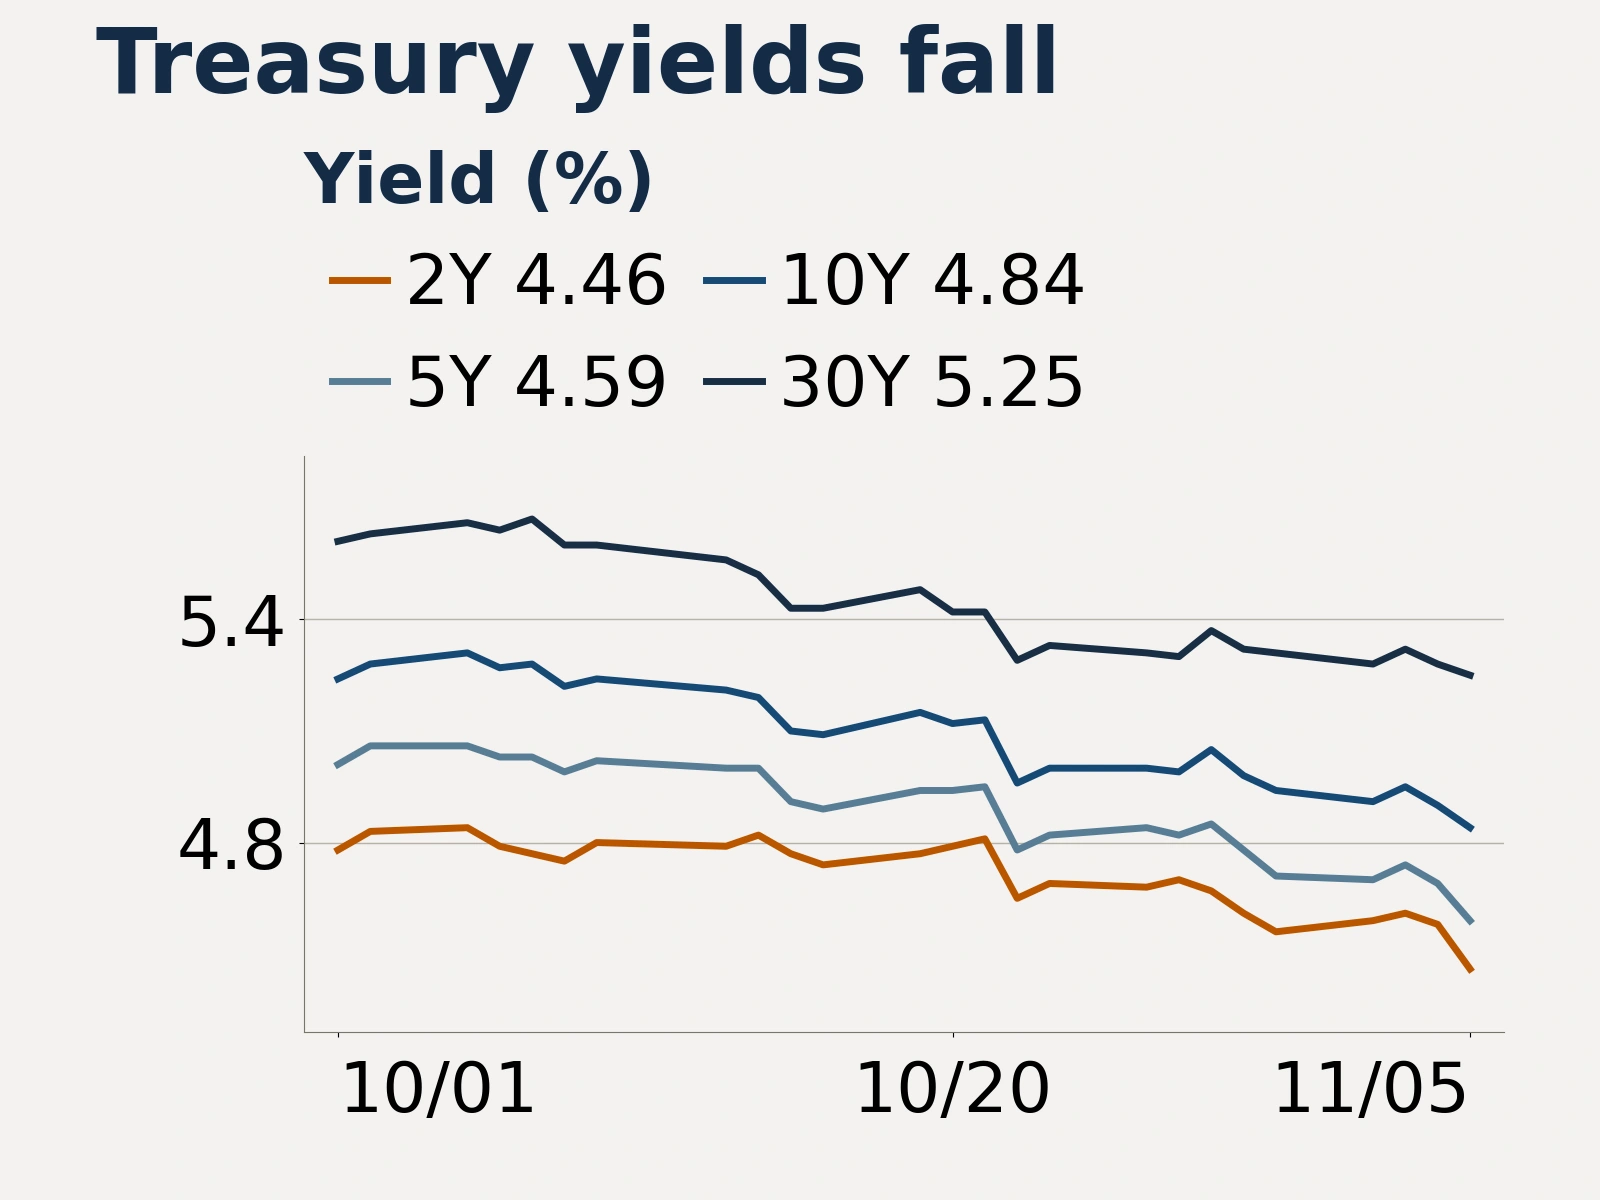
The intraday moves showed stocks and bonds moving in opposite directions. In a commentary at 2 p.m. Eastern time, New York Stock Exchange market strategist Eric Criscuolo said Treasury yields had risen early and moved higher after strong labor-market data. As the equity sell-off intensified, a rush into Treasuries drove yields back down. With the economic data holding up, the bond rally mainly reflected stronger demand for safety and a modest adjustment in monetary policy expectations.
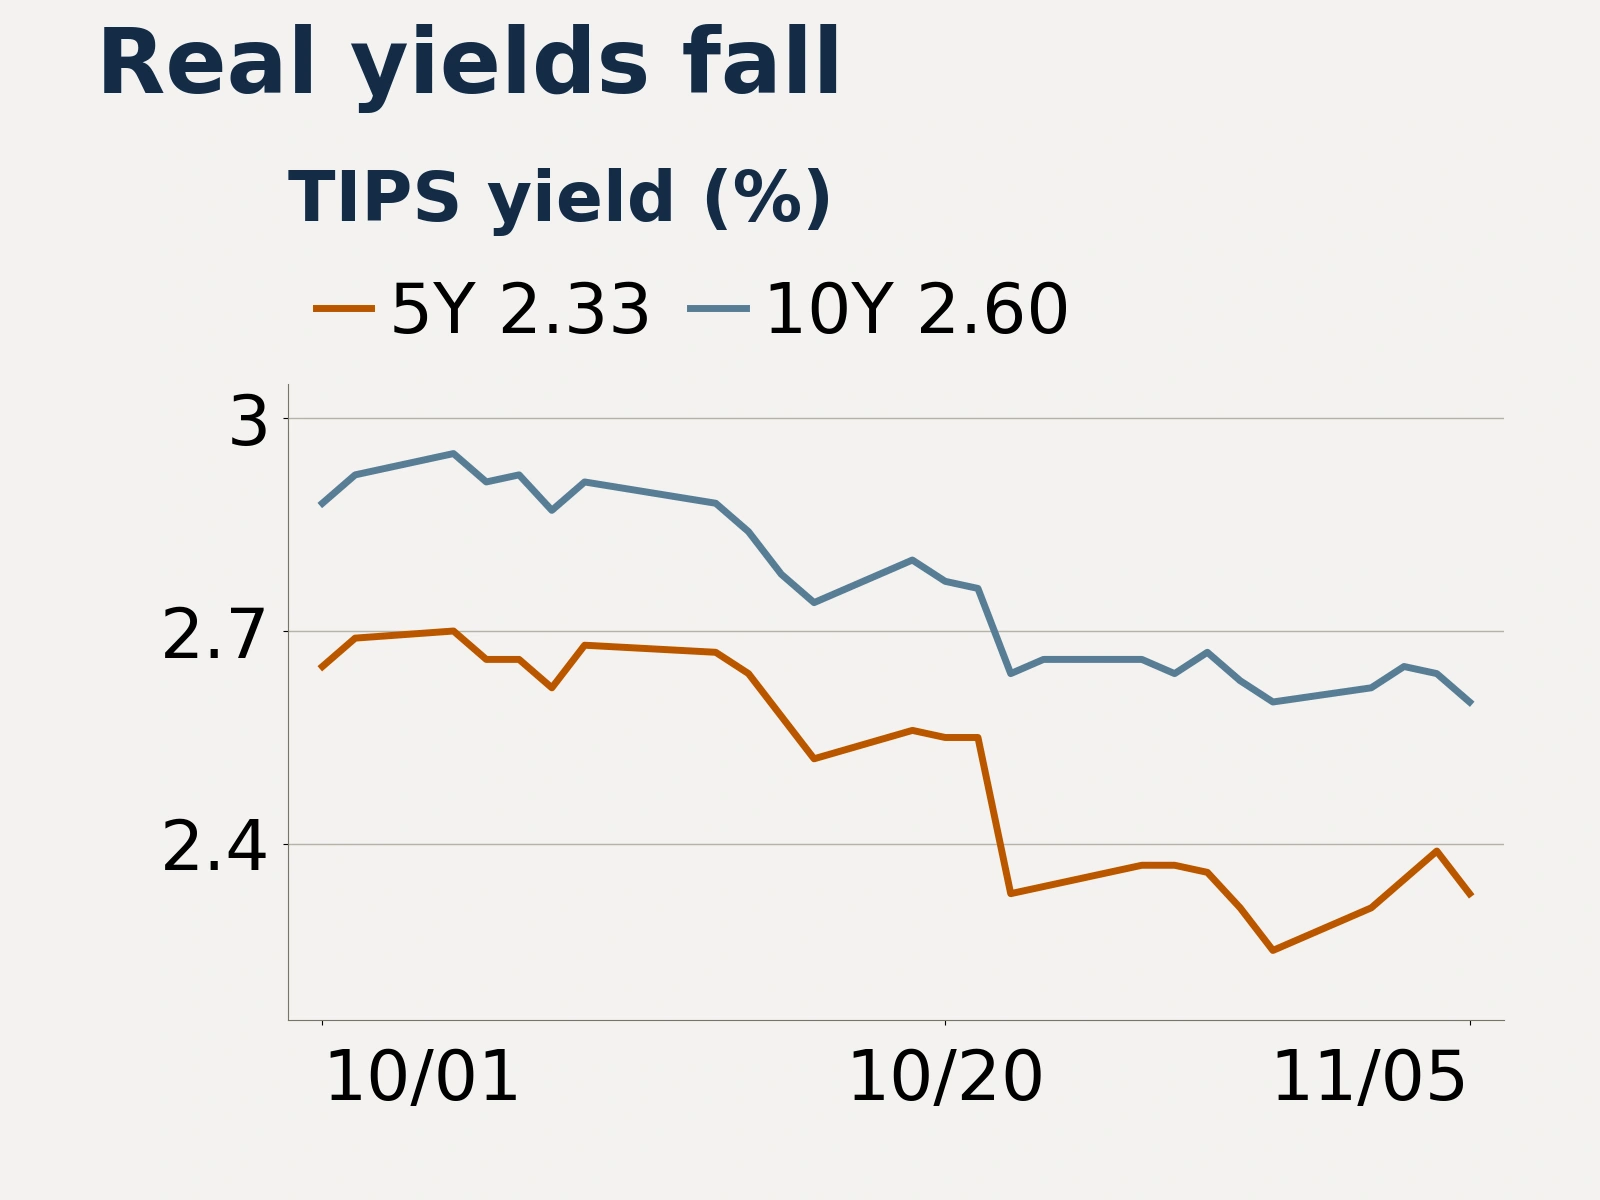
Real yields also fell. Yields on 5-year and 10-year Treasury Inflation-Protected Securities (TIPS) dropped 6 and 4 basis points to 2.33% and 2.60%, respectively. Reuters reported during the session that traders were pricing in about a 70% chance of a Federal Reserve rate increase in December, down from more than 80% the previous day. Cleveland Fed President Hammack and Richmond Fed President Barkin still voiced support for gradual rate increases that day. Markets had scaled back their expectations for the extent of tightening, while inflation pressure and the path of policy continued to limit how far long-term borrowing costs could fall.
The fiscal outlook and issuance plans also shaped the backdrop for long-term yields. Barclays said the divided government that emerged from the election would make it harder to advance new unfunded fiscal expansion plans, reducing the risk of a larger-than-expected increase in Treasury supply. Outstanding debt and heavy issuance needs remain. Materials submitted by the U.S. Treasury to its Borrowing Advisory Committee on November 4 showed that nearly all primary dealers expected November issuance sizes for nominal coupon securities, TIPS and floating-rate notes to stay the same.
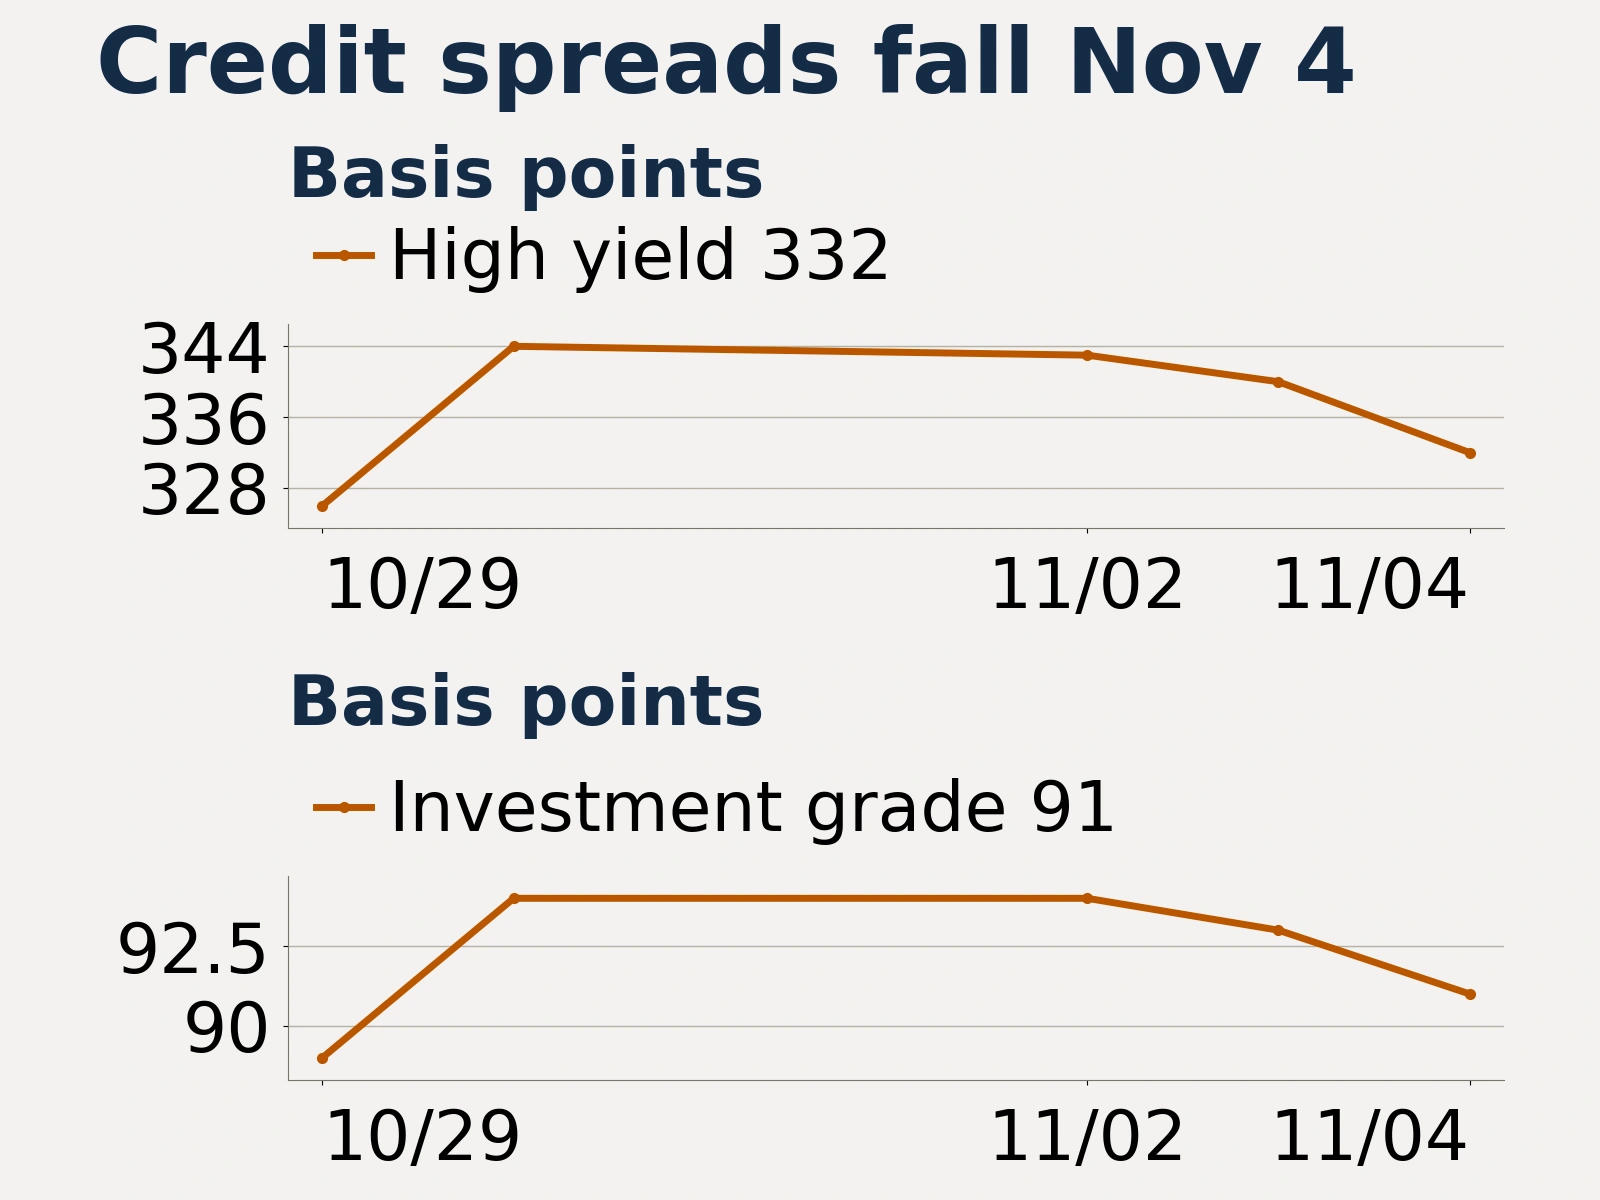
In credit markets, data updated November 5 showed that at the November 4 close, the U.S. high-yield bond option-adjusted spread (OAS) had narrowed by 8 basis points from November 3 to 332 basis points, while the investment-grade corporate bond spread had narrowed by 2 basis points to 91 basis points. The sharp drop in benchmark Treasury yields on November 5 supported dollar bonds through the rates channel. The direction of all-in funding costs for Hong Kong issuers of dollar bonds still depends on how credit spreads and liquidity premiums move.
Initial jobless claims fall and stronger third-quarter productivity eases labor cost pressure

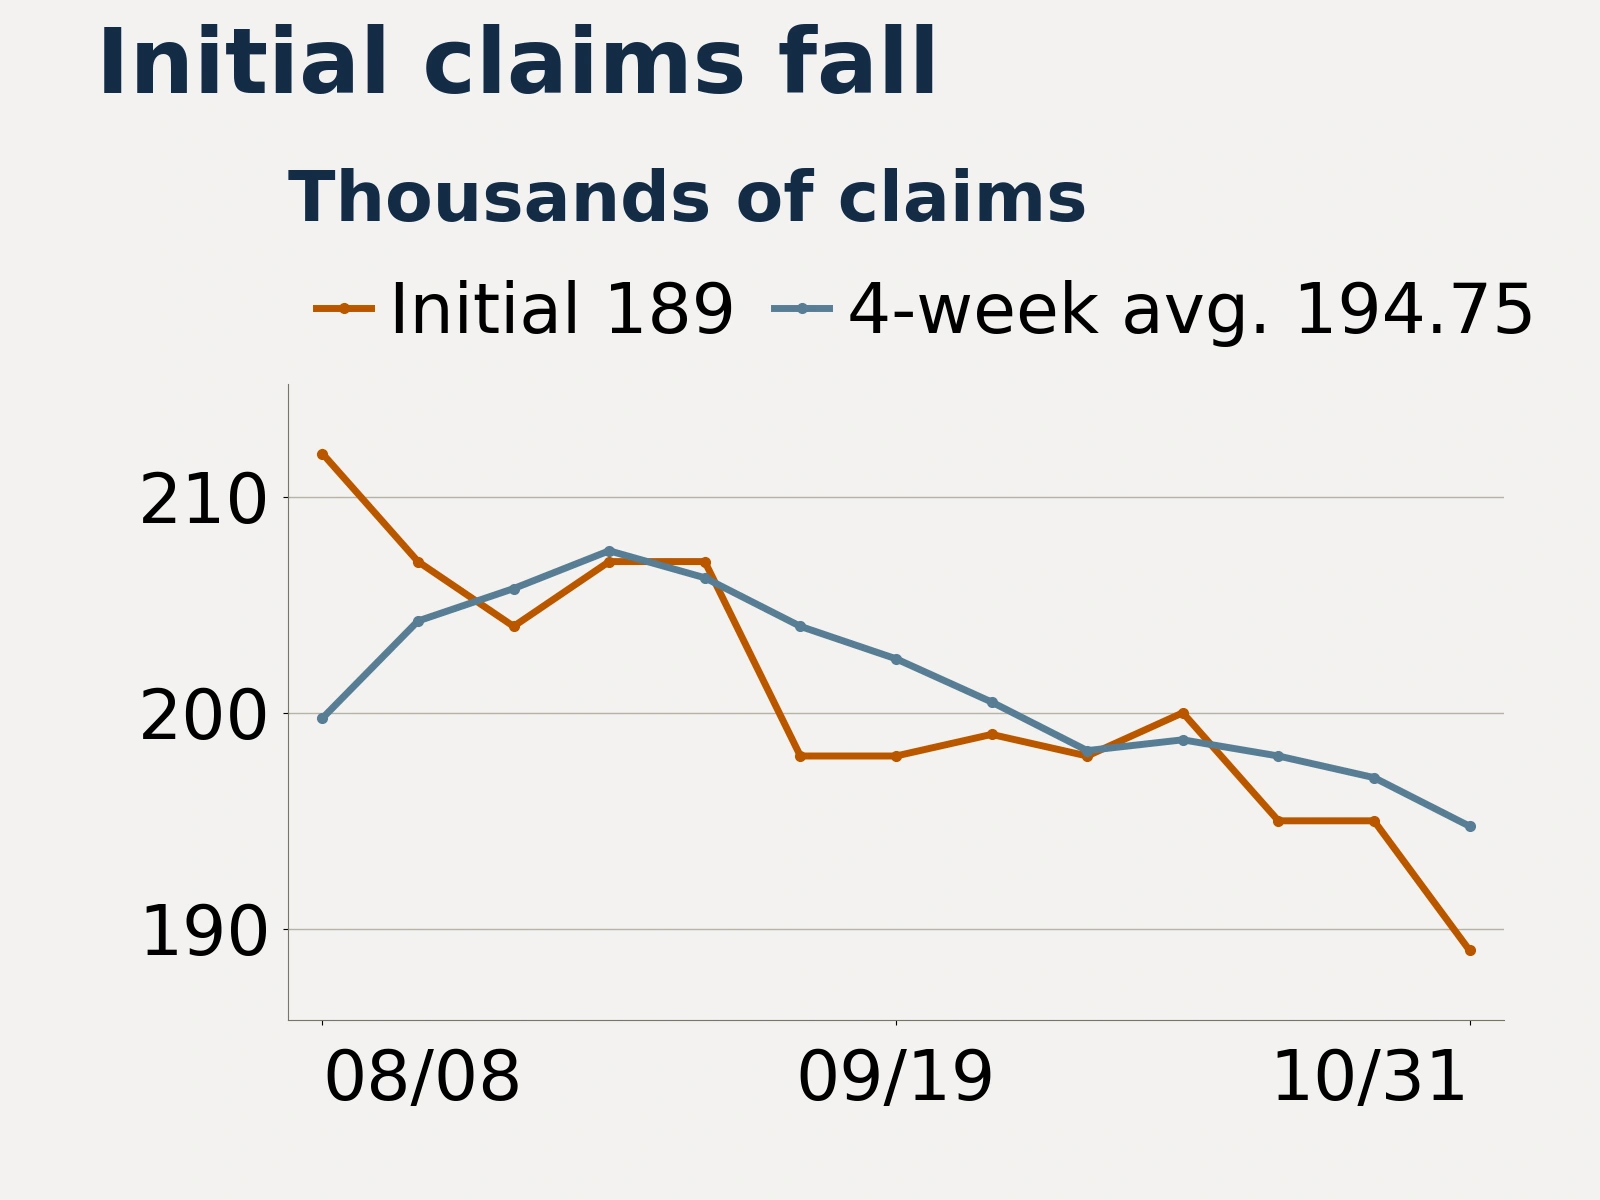
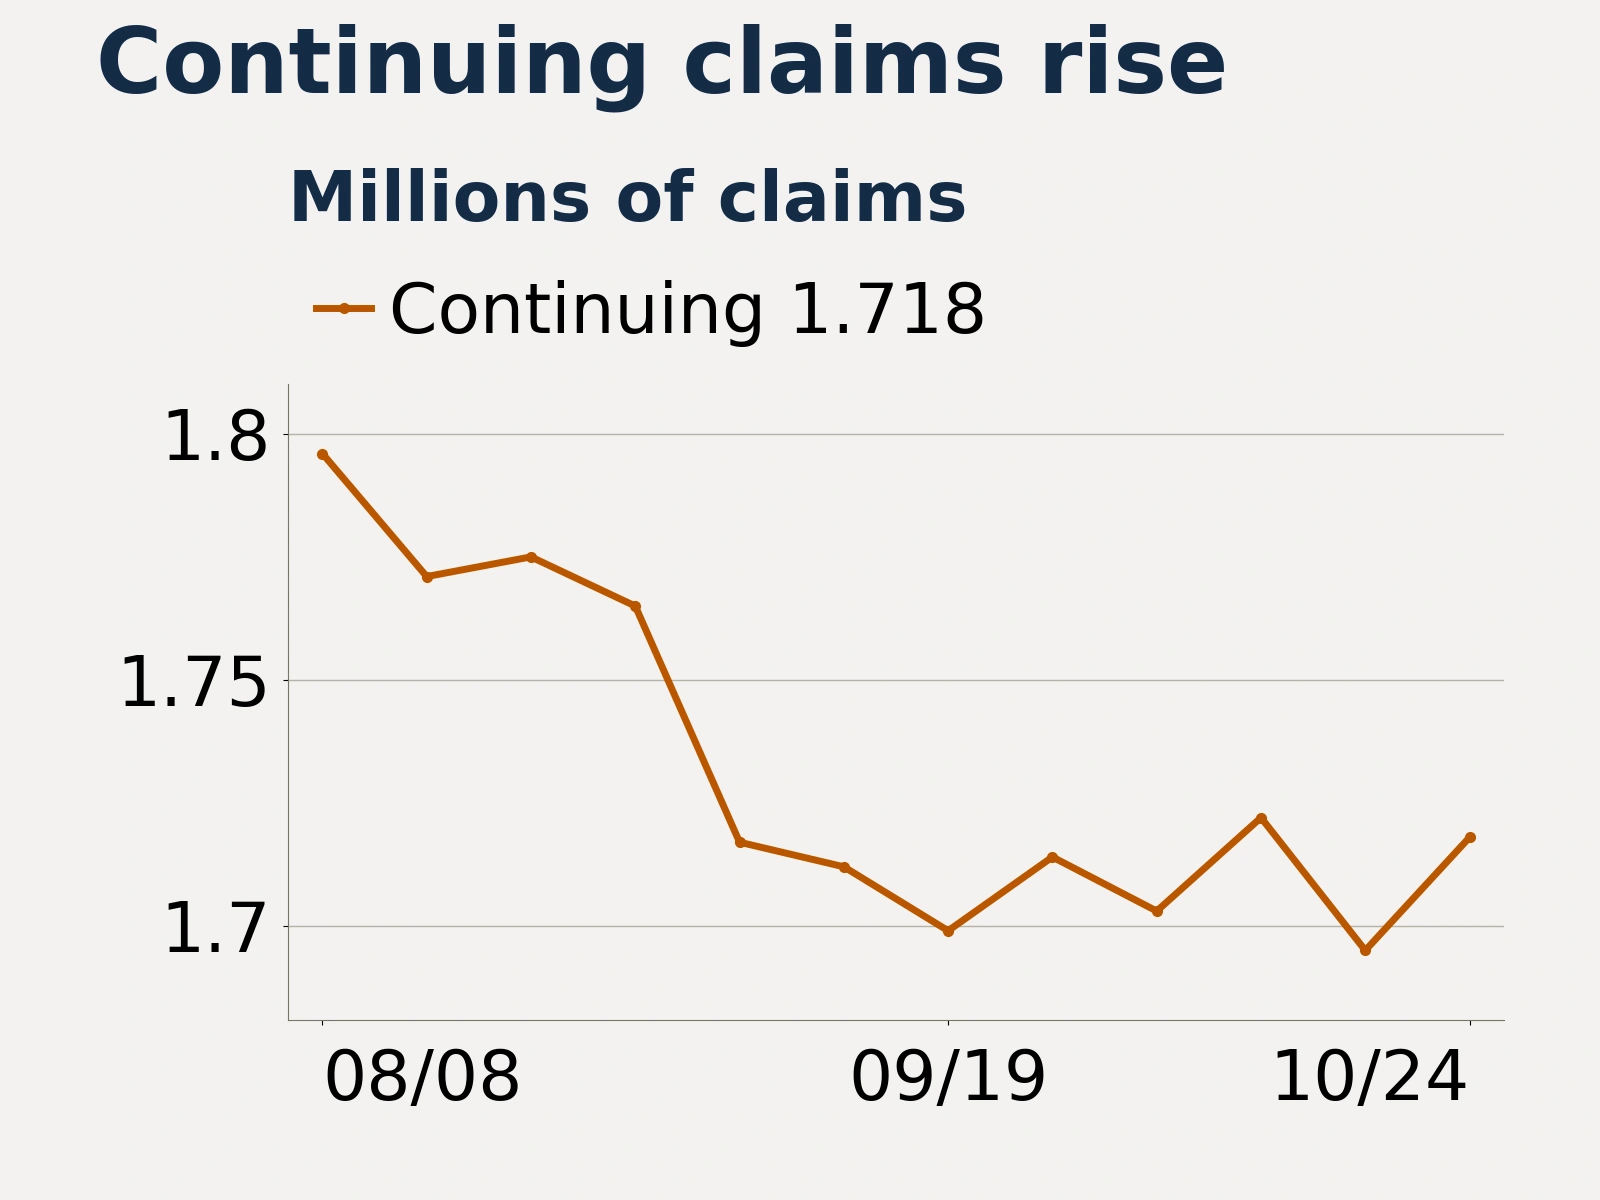
The U.S. Department of Labor reported on November 5 that seasonally adjusted initial jobless claims fell by 6,000 from the revised prior week to 189,000 in the week ended October 31, below the 196,000 expected in a Reuters poll. The four-week moving average fell to 194,750, indicating that layoffs remained low and existing jobs were relatively stable. Continuing claims, meanwhile, rose by 23,000 to 1.718 million in the week ended October 24, suggesting that unemployed workers still faced friction finding new jobs.
Companies remained cautious about adding permanent positions. Reuters, citing a report from Challenger, said U.S. employers announced plans to hire 444,692 workers in October, up 57% year over year, mostly for short-term seasonal jobs ahead of the holidays. Low layoffs supported household income, while hiring mainly for temporary positions gave companies flexibility to adjust staffing as demand changed.
Productivity data released the same day further eased concerns about costs. U.S. nonfarm business labor productivity grew at a seasonally adjusted annual rate of 3.6% from the previous quarter in the third quarter, up from a revised 2.1% in the second quarter. On the same basis, output grew 3.7% and hours worked edged up just 0.1%. Hourly compensation rose 2.9%, slower than productivity, bringing unit labor costs down 0.7%. Higher productivity allowed firms to absorb some of the increase in compensation while expanding output, helping to cushion profit margins and support price stability.
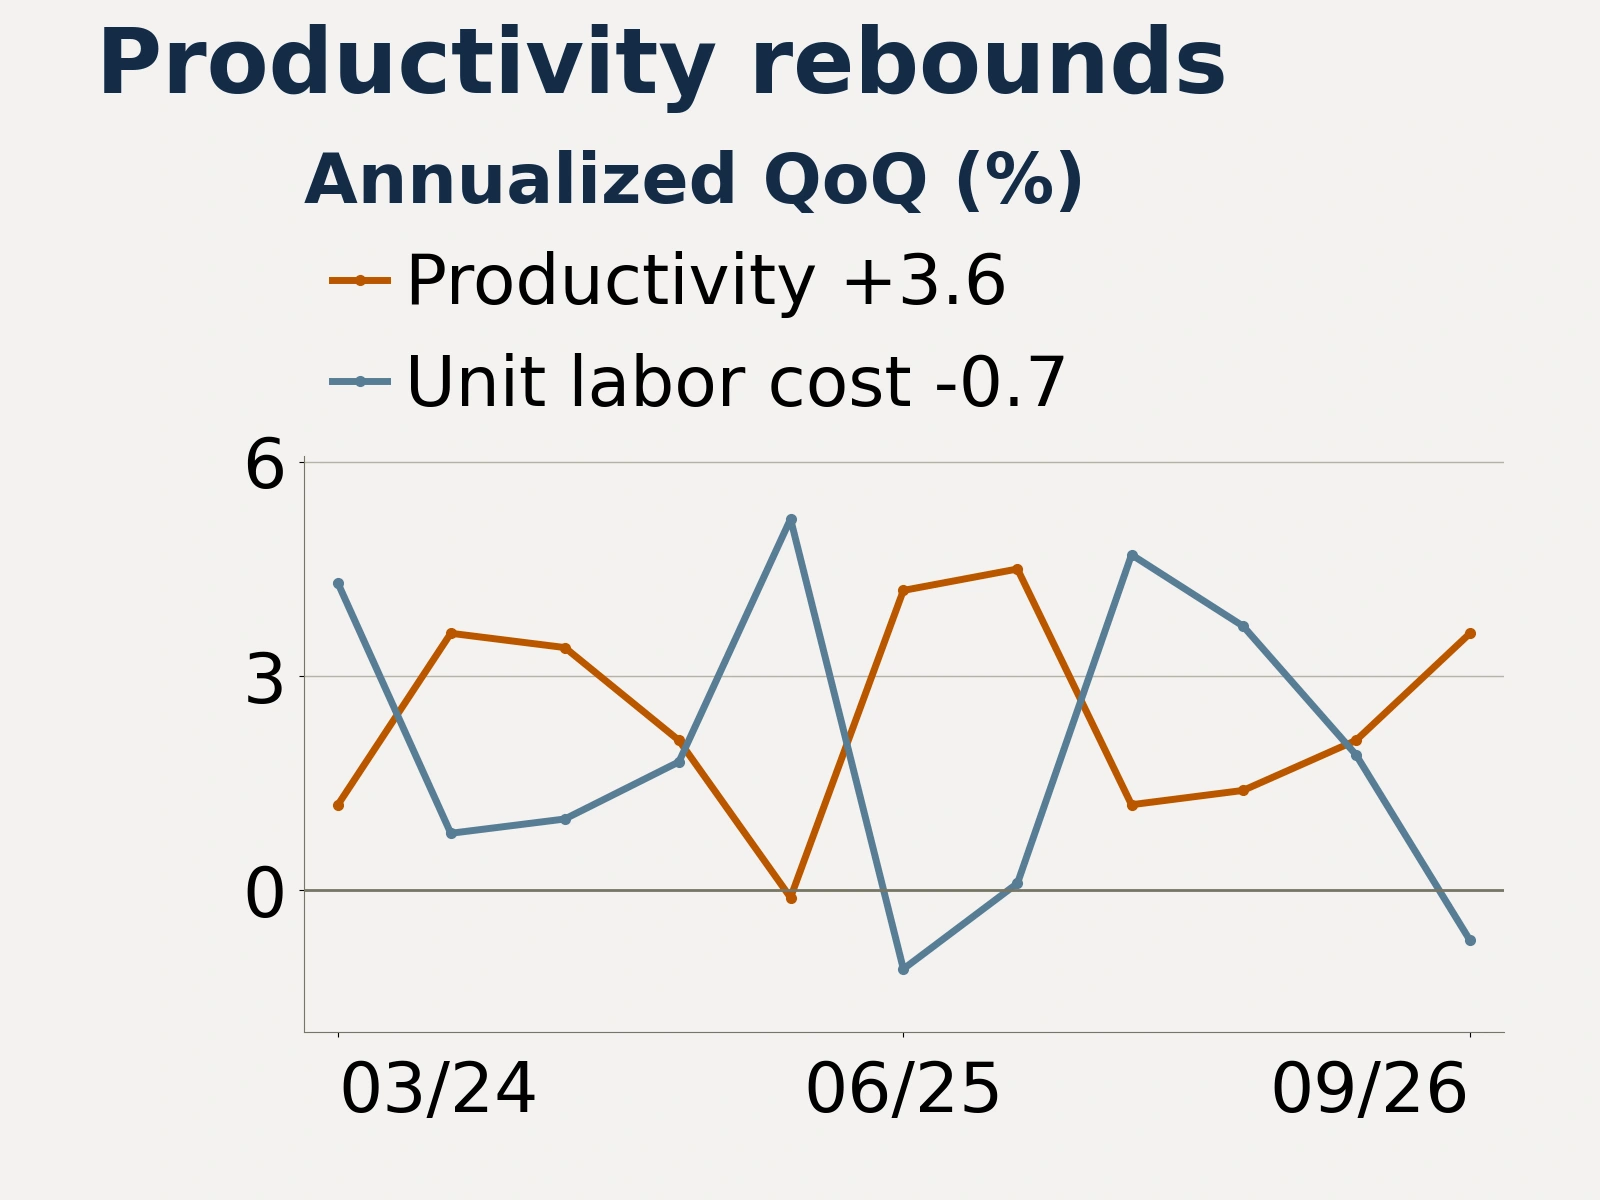
The productivity improvement varied across industries and time horizons. Nonfarm business unit labor costs were still up 2.4% from a year earlier in the third quarter. Manufacturing productivity grew at a seasonally adjusted annual rate of just 0.3% from the previous quarter, while unit labor costs rose 2.7% on the same basis. Manufacturing fared considerably worse than the nonfarm business sector overall.
Market attention was turning to the U.S. October nonfarm payrolls report, due at 21:30 Beijing time on November 6. Economists polled by Reuters expected payroll growth to pick up from 29,000 in September to 65,000 in October, with the unemployment rate holding at 4.2%. Whether hiring broadens beyond seasonal jobs to more industries will shape the outlook for household labor income and test whether the market's reduced expectations for rate increases hold.
Shipping incidents lift oil while lower yields help gold finish higher

Oil rebounded after plunging more than 8% the day before. Reuters reported that on November 5, Brent crude futures settled $3.67, or 3.88%, higher at $98.29 a barrel. West Texas Intermediate crude futures gained $2.40, or 2.72%, to settle at $90.52 a barrel.
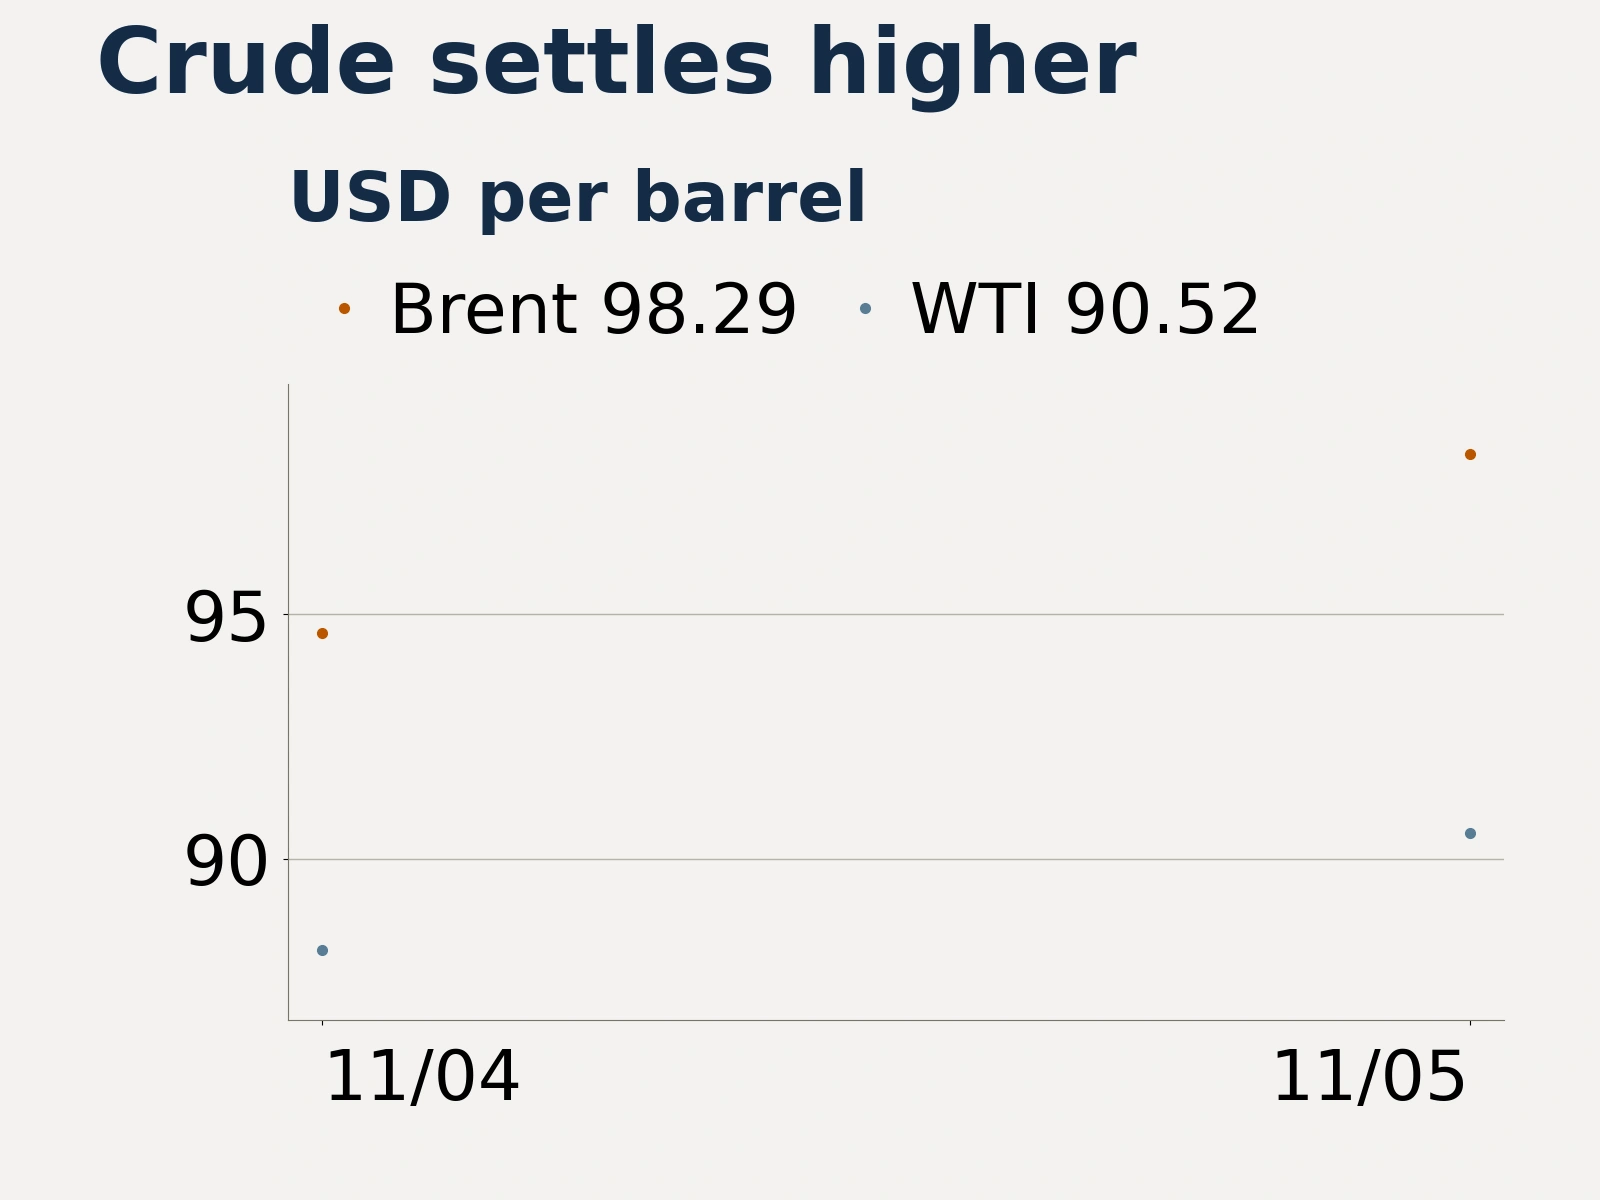
Renewed risks to shipping prompted traders to reassess how hard it would be to restore seaborne traffic. Reuters, citing United Kingdom Maritime Trade Operations, reported that at least five vessels had reported incidents since Sunday. Consultancy Gelber and Associates said traders had grown wary of pricing in a rapid return to normal oil shipments before diplomatic progress translated into reliable transport and deliveries. Risks involving Iran continued to affect markets through energy supply security and expectations for potential wartime spending. The lag in policy changes after the U.S. election made it unlikely that immediate shipping risks would fade quickly. The renewed shipping risk premium behind the oil rebound could slow the decline in energy costs, offsetting some of the relief from lower labor costs as productivity improves. How long these competing forces last will help determine corporate margins and the course of monetary policy.
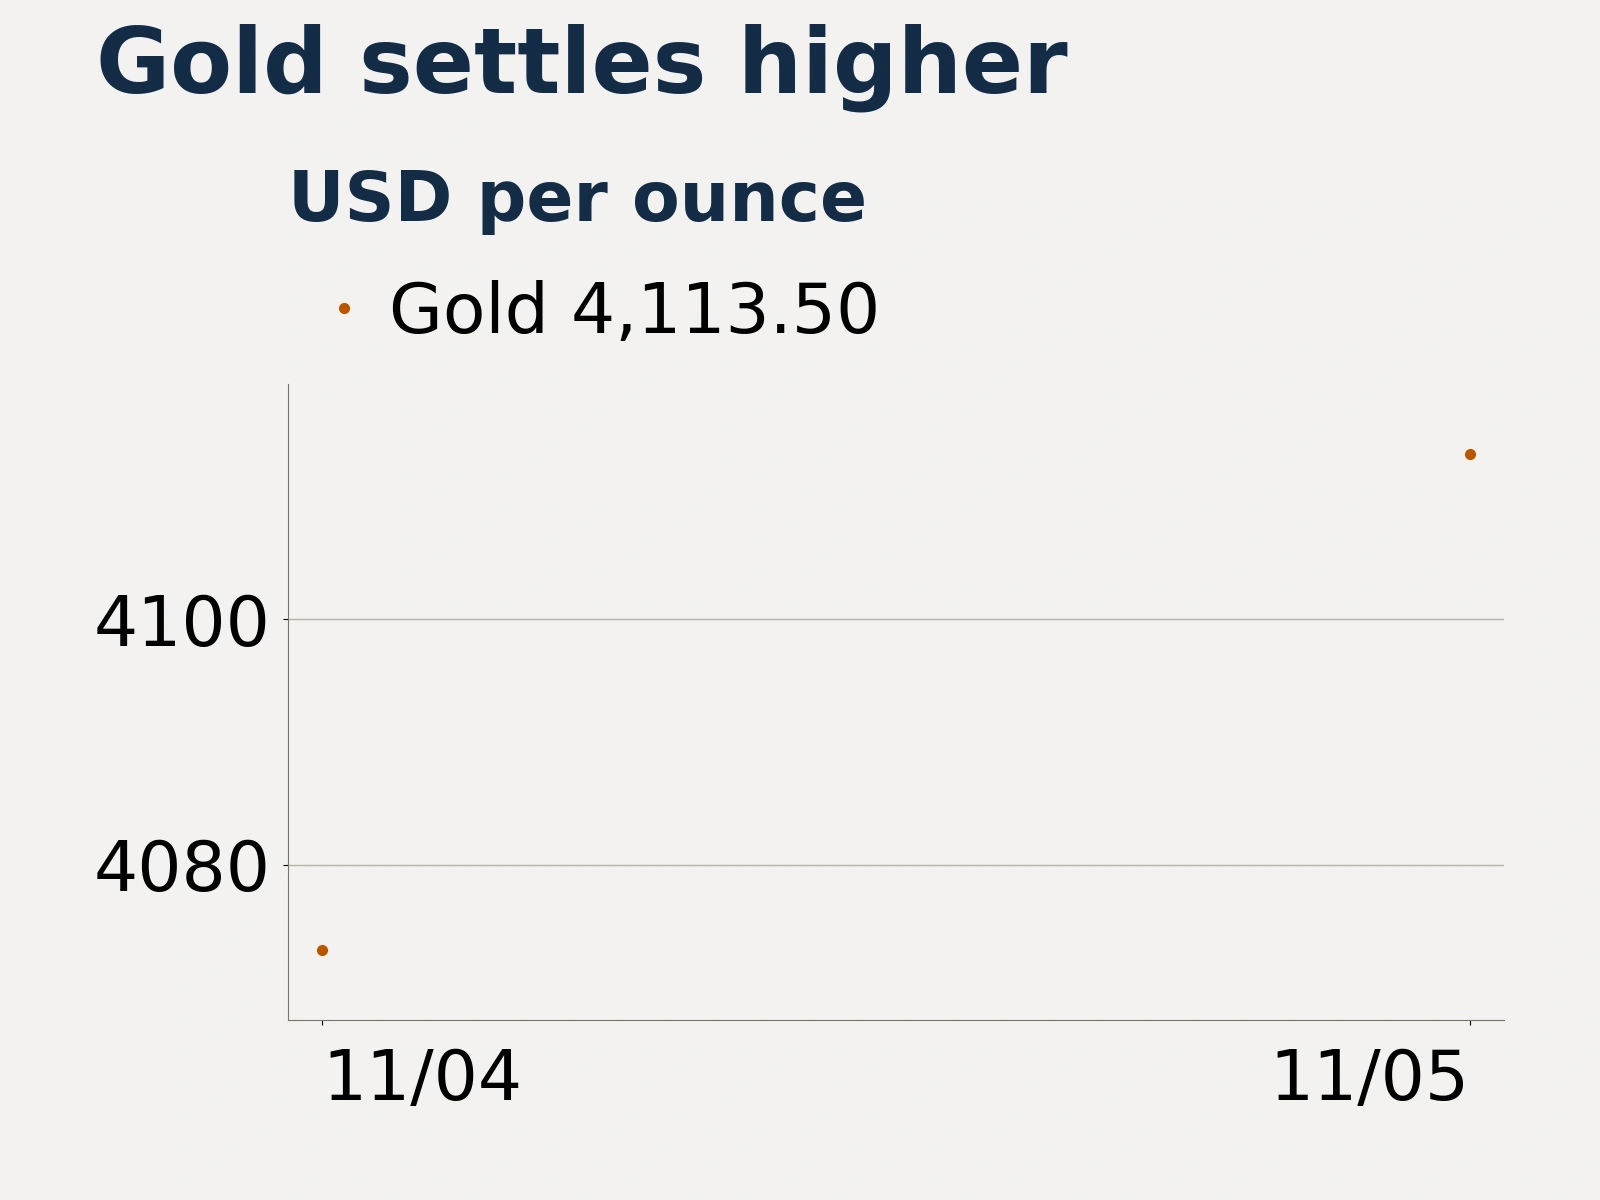
In precious metals, lower Treasury yields supported gold. December COMEX gold futures settled $40.50 higher, up about 0.99%, at $4,113.50 an ounce. Spot gold reached $4,146.63 intraday, its highest since October 20. Reuters reported after the U.S. equity close that spot gold had eased to $4,087.62, trimming its daily gain to 0.69%. A weaker dollar and lower Treasury yields initially boosted gold, but the metal retreated from its intraday high as oil rebounded and the dollar recovered its early losses.
Asia-Pacific stocks diverge by sector exposure as trade and sanctions measures move at different speeds
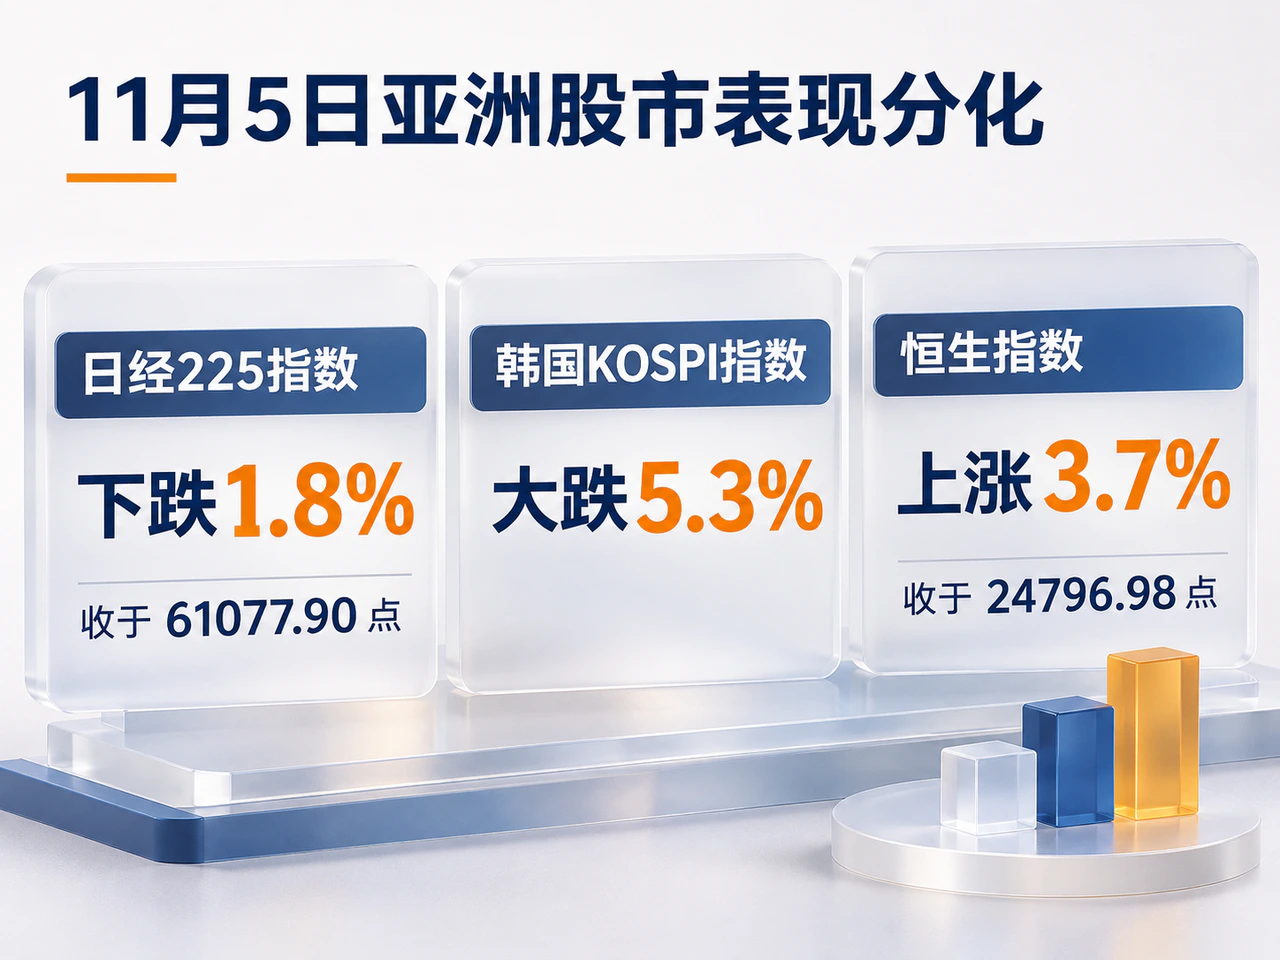
In the Asian session that ended before the U.S. equity sell-off on November 5, differences in sector exposure were already evident across major indexes. Pressure on technology and the AI supply chain sent Japan's Nikkei 225 down 1.8% to 61,077.90 and South Korea's KOSPI down 5.3%. Hong Kong's Hang Seng Index bucked the trend, rising 3.7% to 24,796.98. The subsequent slide in U.S. chip and data center stocks could reach upstream suppliers in Japan and South Korea through weaker expectations for orders. The outlook for Hong Kong stocks also depends on local corporate earnings and investors' appetite for risk.
In trade and foreign policy, investors were watching both the conditions attached to several measures and the executive branch's authority to carry them out. China's Ministry of Commerce said on November 5 that it was open to buying more U.S. agricultural products, provided the reciprocal tariff reductions agreed by the two sides were implemented. Import costs and purchasing expectations will only change materially once the tariff relief and market access terms take effect. In the United States, Barclays noted that the president retains significant executive authority over tariffs, sanctions and export controls, giving trade policy considerable continuity. Changes in the balance of power in Congress matter more through negotiating leverage and budget constraints.
That same day, the United States stepped up sanctions on Cuba, making its electronics, manufacturing, maritime and technology sectors eligible for sanctions. The U.S. State Department also announced sanctions designations for eight entities and two individuals and identified five vessels as blocked property. For shipping, insurance, payments and trade finance providers operating in the region, the measures mean more stringent counterparty compliance checks and reduced availability of services.