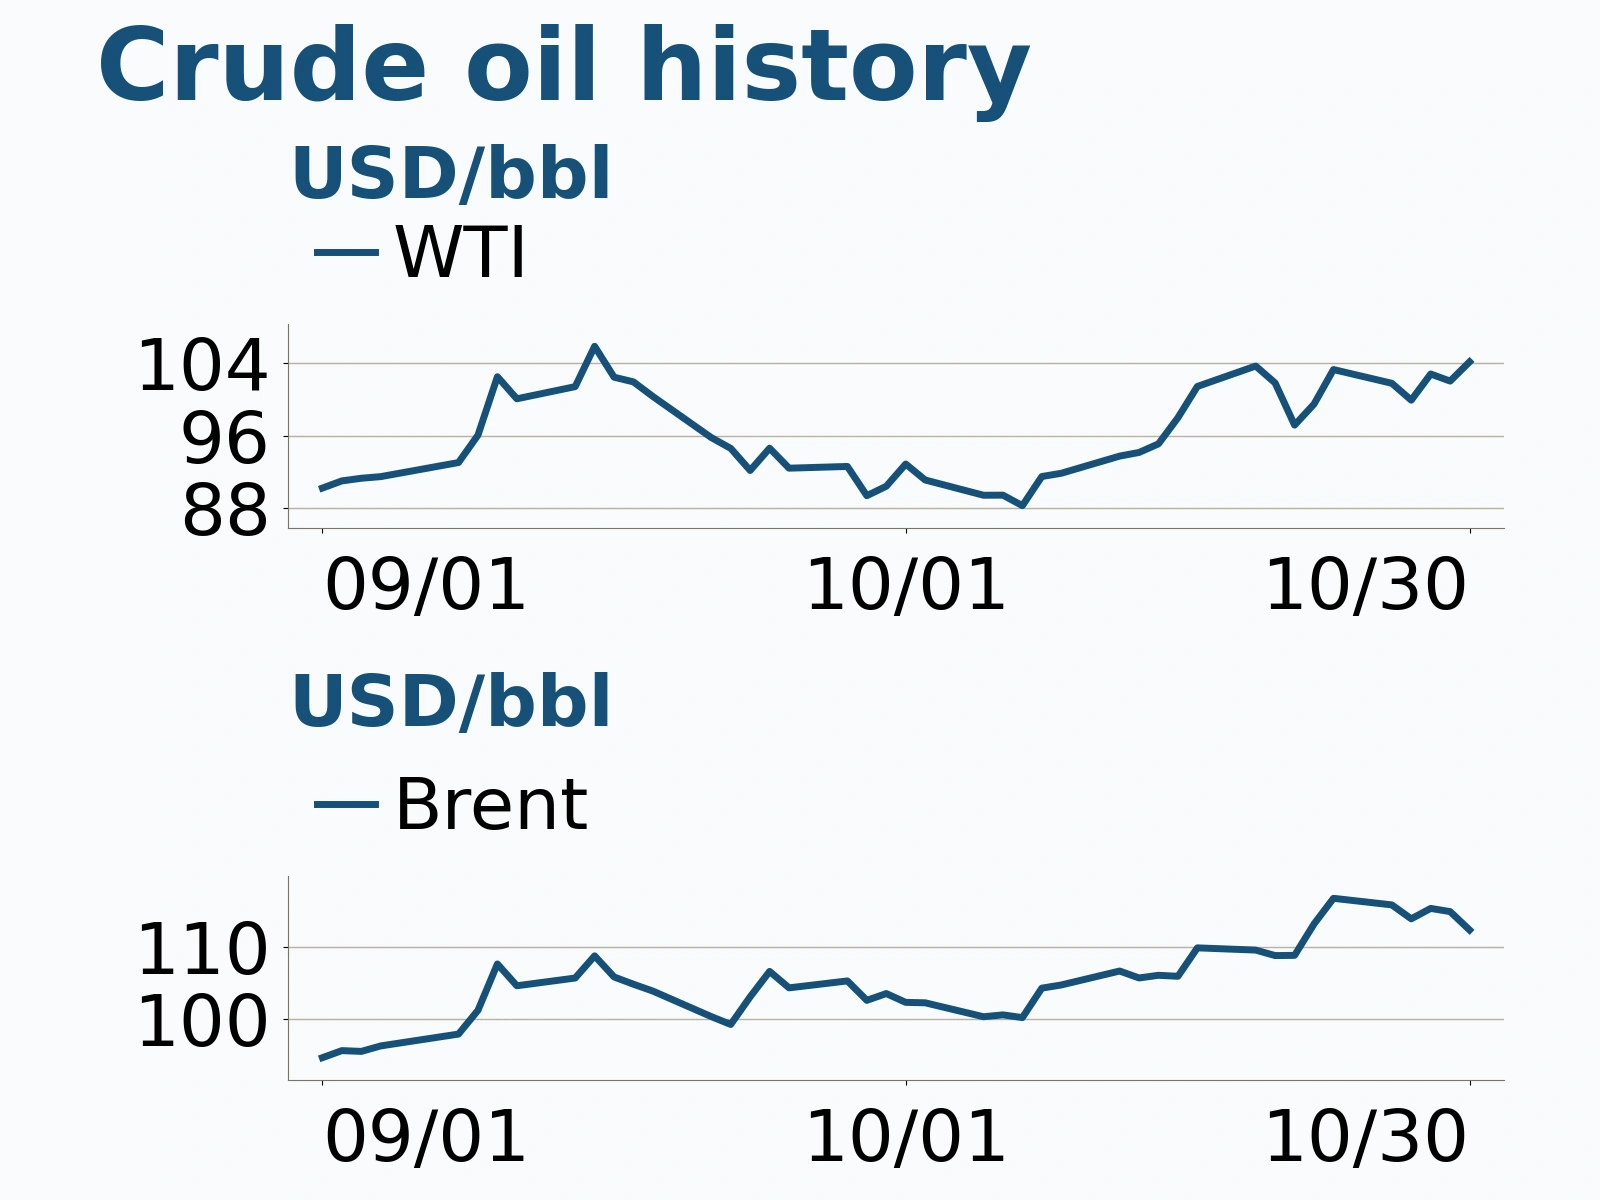
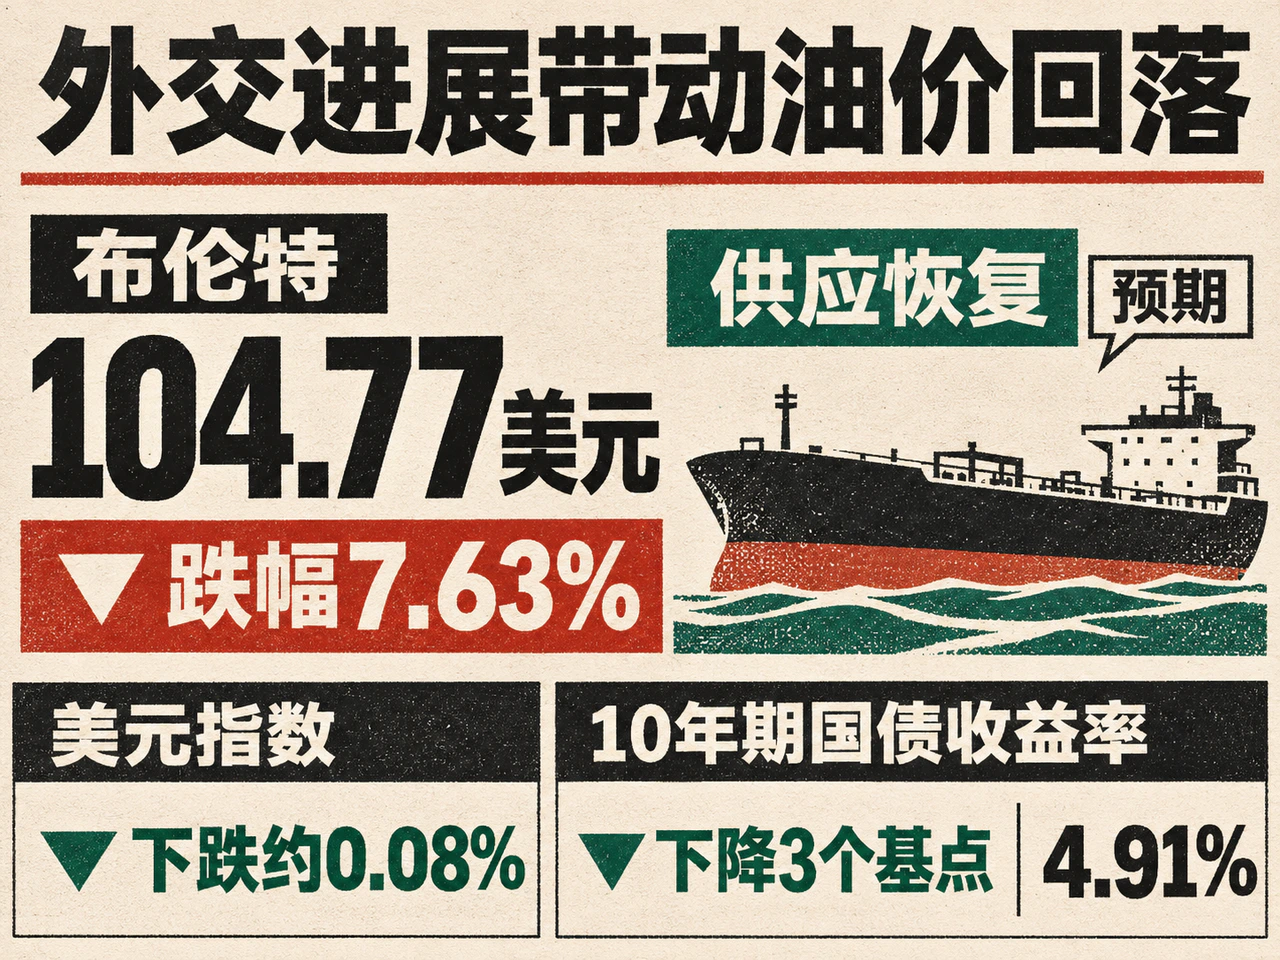
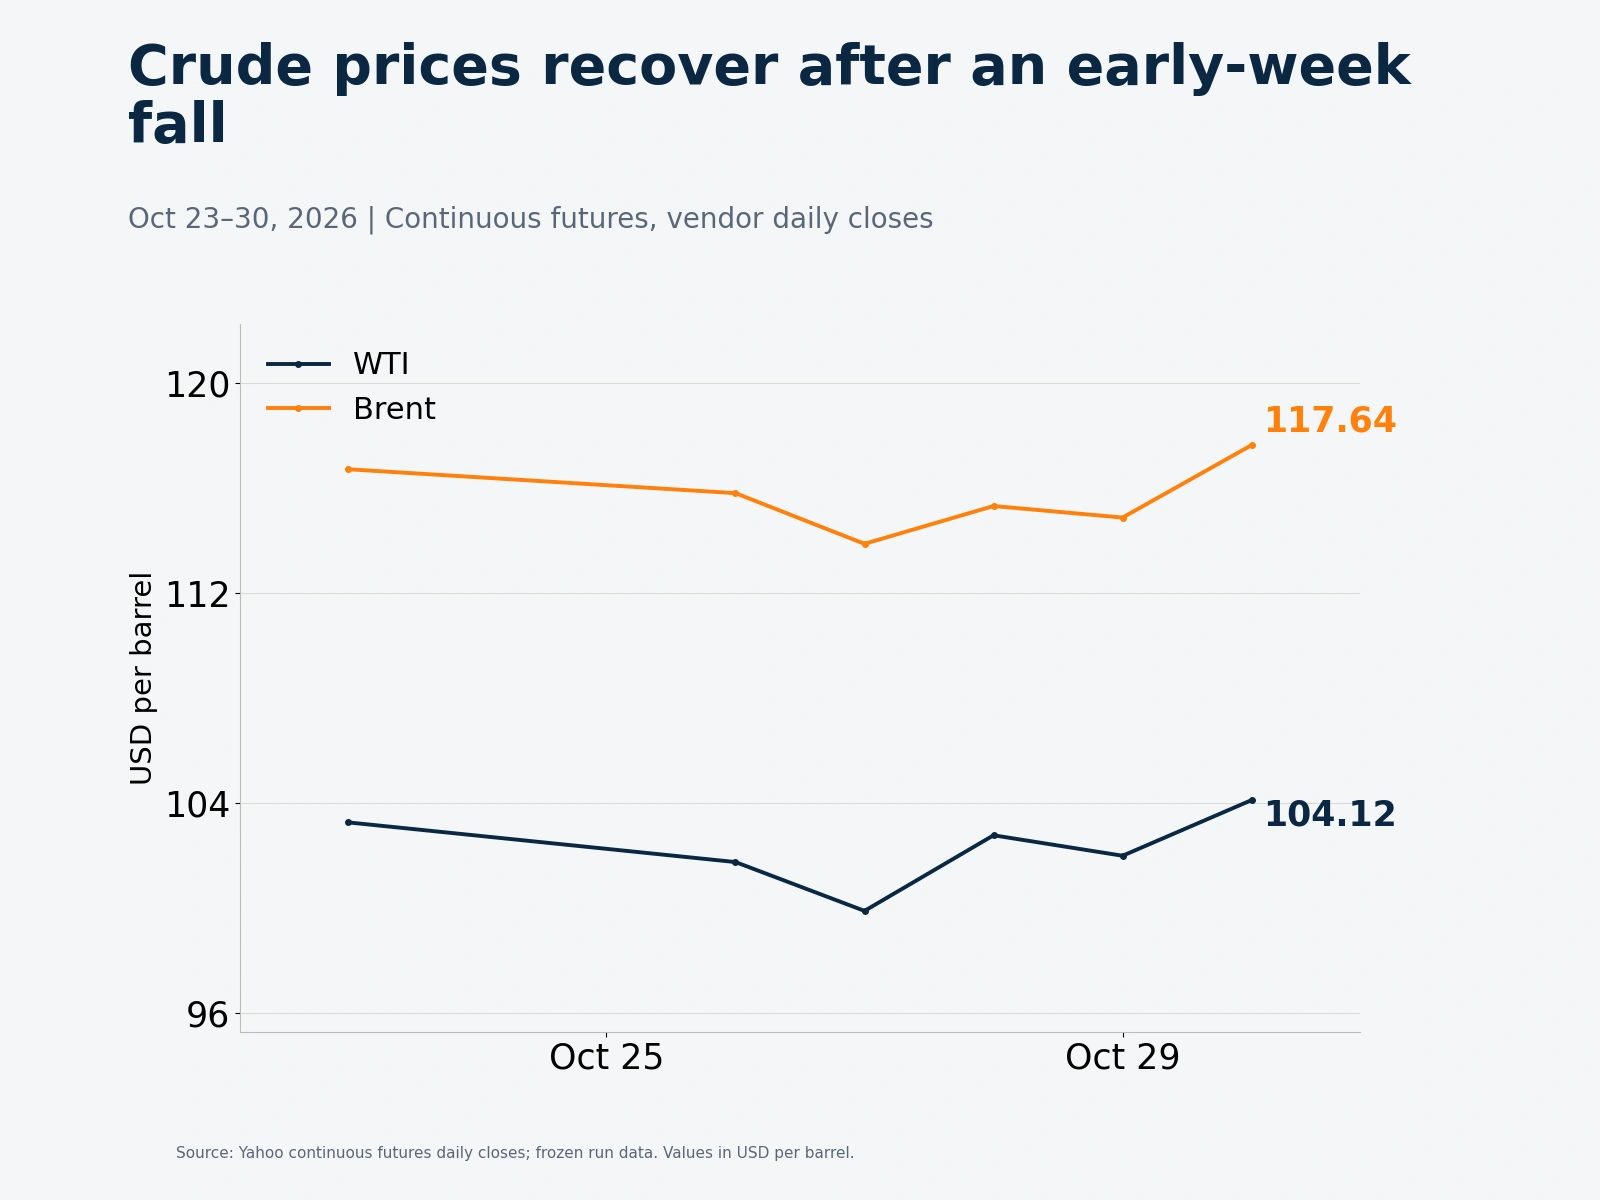
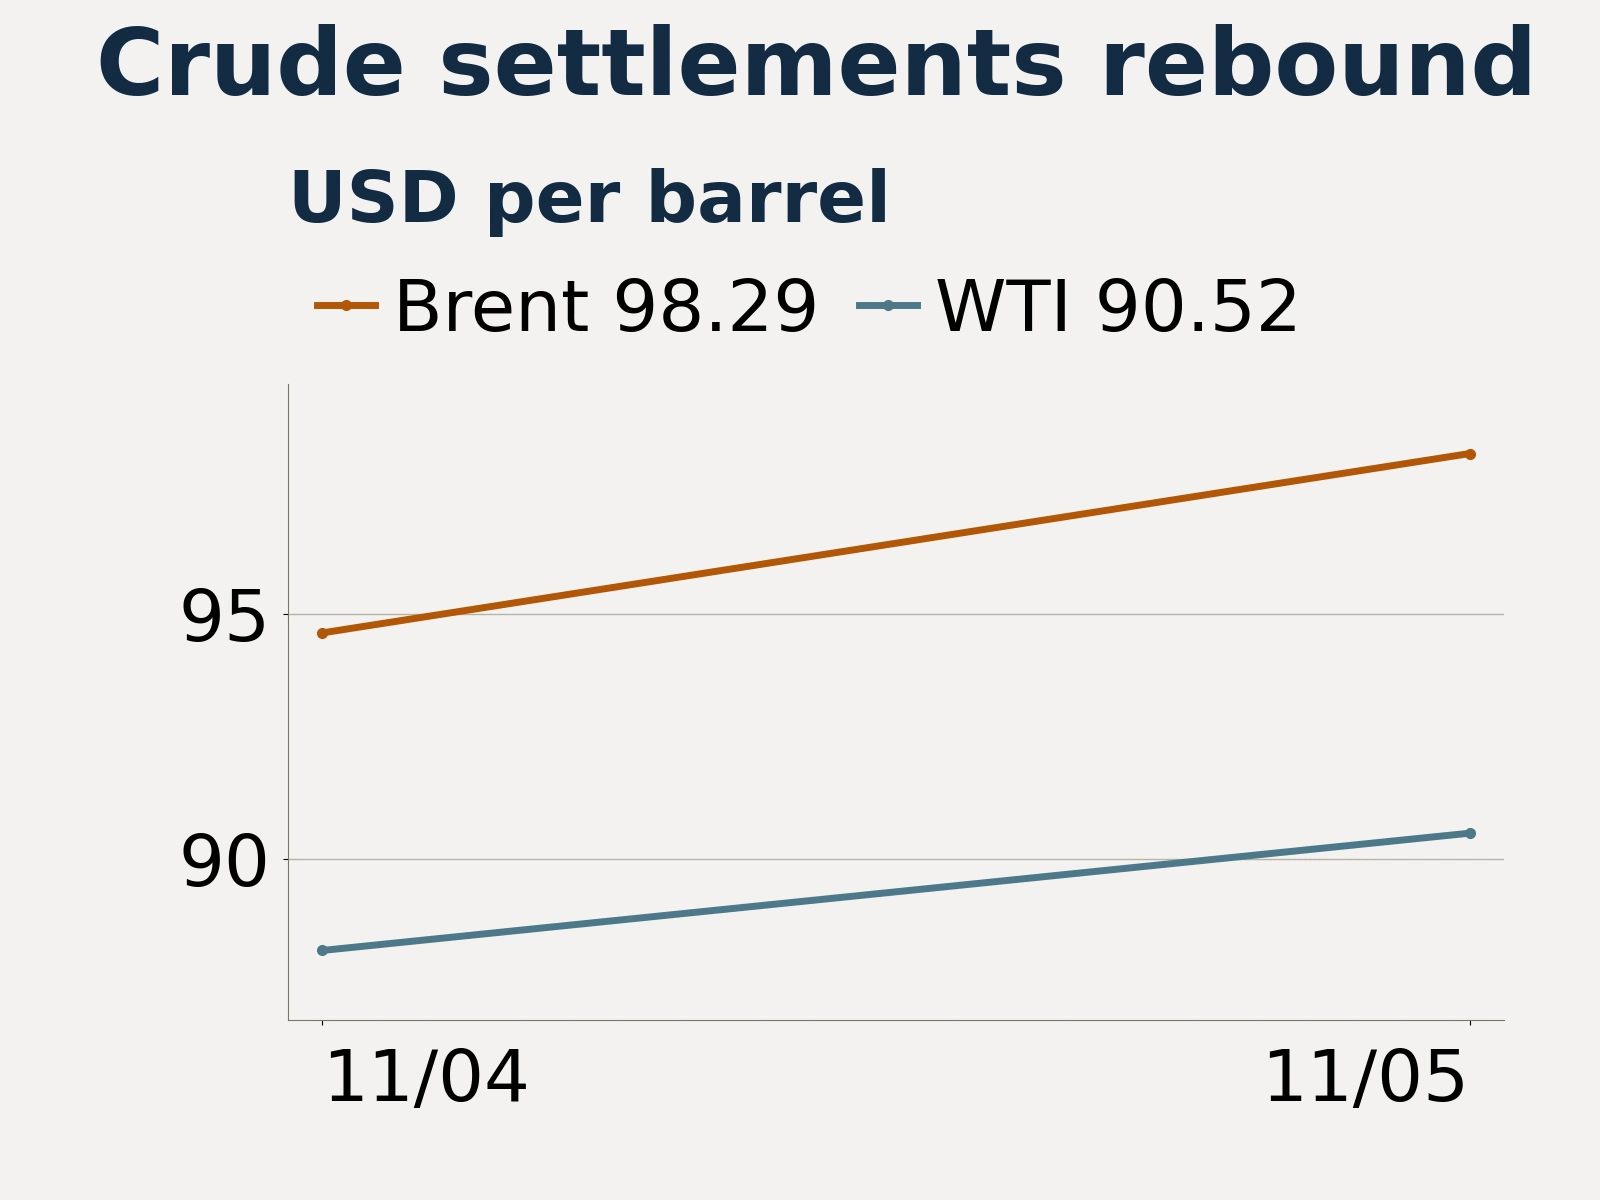
On November 5, 2026, global oil prices rebounded after the previous day's sharp selloff. Reuters reported that Brent crude futures settled at $98.29 a barrel, up $3.67, or 3.88%, and West Texas Intermediate (WTI) futures settled at $90.52 a barrel, up $2.40, or 2.72%. The market is weighing two signals. Hopes for a diplomatic end to the conflict can quickly bring down the risk premium, while tanker attacks are a reminder that securing reliable deliveries still comes at a cost.
Hormuz traffic recovers, but attacks continue and the Yanbu alert remains in effect

On November 4, both crude futures benchmarks fell more than 8%, settling at their lowest levels since August 31. The next day's rebound recouped some of those losses, while tanker attacks in the Gulf continued. Reuters, citing United Kingdom Maritime Trade Operations, reported that at least five vessels had reported attacks since Sunday, close to the pace seen in October, when the agency recorded attacks on 35 vessels.
The risk extends to alternative routes. On November 5, Saudi authorities issued a warning of potential danger at Yanbu, a Red Sea oil export hub. Yanbu provides an export route that bypasses the Strait of Hormuz, and its security directly affects how much Gulf oil can reach buyers and at what cost. The warning put the market on alert, but its economic impact will depend on whether subsequent shipments are disrupted.
In an earlier report that day, Reuters cited analysts who said crude shipments through the Strait of Hormuz had recovered to near prewar levels, but at a higher cost. That helps explain why oil prices plunged before rebounding on fresh attacks. The recovery in shipments eased expectations of widespread shortages, while insurance, freight costs and delivery uncertainty continued to support the risk premium. Gelber and Associates said the rebound reflected market caution about pricing in a return to normal supply too quickly, before diplomatic progress translates into reliable shipping and delivery.
Front-month backwardation persists as U.S. crude and distillate stocks fall

The futures curve offers another way to gauge the market. A delayed ICE trade snapshot at 01:48 GMT on November 5 showed the January 2027 Brent contract at $93.57 a barrel and the February contract at $91.17. The front month traded at a $2.40 premium to the next month, a structure known as backwardation. The snapshot preceded that day's settlement and shows the shape of the curve at the time. The premium on near-term deliveries was consistent with lingering shipping risks.
U.S. inventories offer a read on the physical market. EIA data cited by Trading Economics showed U.S. commercial crude inventories fell by 865,000 barrels in the week ended October 30, their fifth consecutive weekly decline. Distillate stocks dropped by 3.565 million barrels, and gasoline stocks fell by 222,000 barrels. The larger distillate draw puts the supply cushion for diesel and heating oil in focus.
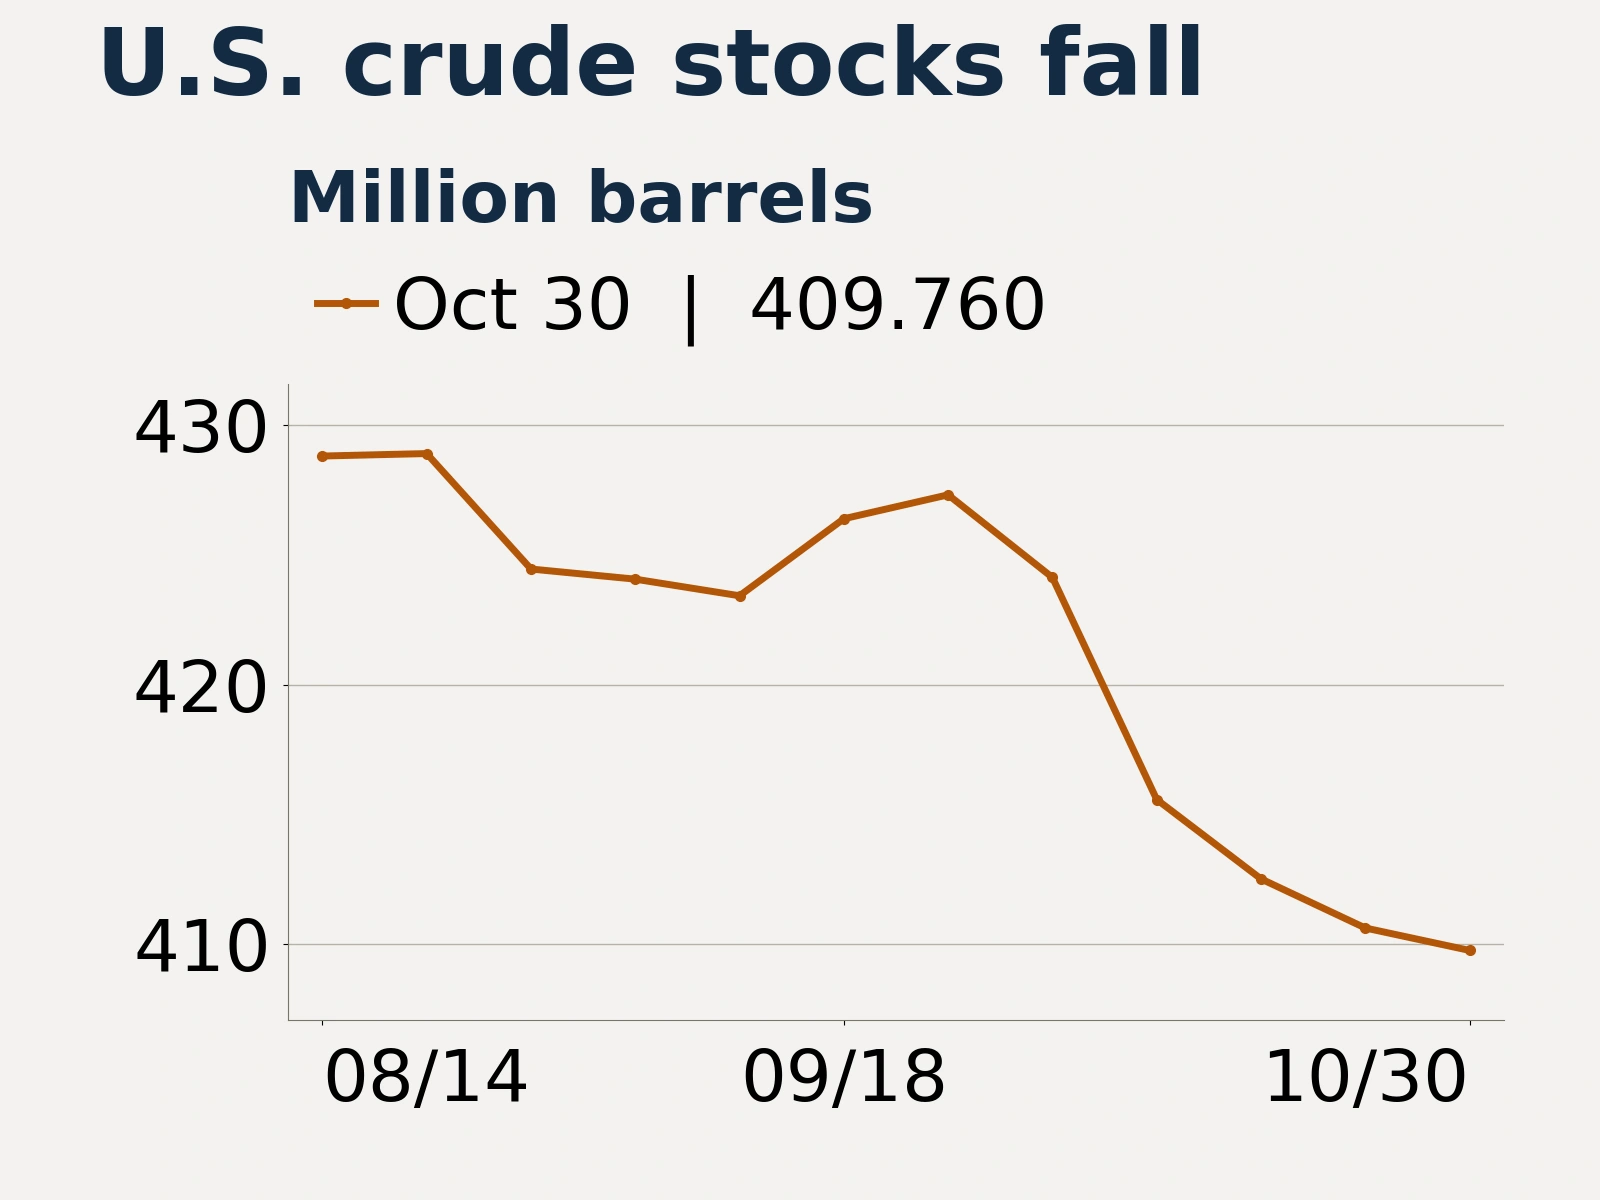
In the same week, refinery crude runs rose by 199,000 barrels per day, and net crude imports increased by 1.179 million barrels per day. Crude stocks fell even as net imports rebounded, underscoring the need to read inventory moves alongside refinery runs and trade flows. Crude stocks at Cushing, by contrast, rose by 280,000 barrels, showing that supply tightness varied across U.S. regions and petroleum products.
Supply policy remains steady for now. On November 1, seven participating OPEC+ countries decided to keep required December output at September levels and scheduled their next monthly meeting for November 29. With quotas unchanged, the amount of crude reaching the market in the near term will depend more on how production plans are implemented, which export routes are available and what shipping costs.
The EIA forecast released on October 6 still assumed that Middle Eastern oil flows would face constraints in the fourth quarter. It projected production outages averaging 4.5 million barrels per day and global inventory draws averaging 700,000 barrels per day over the quarter. Those projections were based on constrained shipping. The EIA's next outlook, due November 10, will reassess the recent recovery in shipments.
Deliveries, spreads and the November 10 EIA outlook will test the rebound

The dollar and interest rates sent mixed signals. Vendor data showed the dollar index closed about 0.06% higher on November 5, while the official U.S. 10-year Treasury yield fell 6 basis points to 4.84%. Oil rebounded despite the slightly stronger dollar. Shipping risk and repricing after the previous day's selloff better explain the move.
Three developments bear watching. First, look for fewer tanker incidents, smoother loadings at Yanbu and more reliable deliveries. Higher shipping volumes and lower costs would erode the risk premium. Second, watch the front-month Brent spread. If outright prices fall while backwardation persists, near-term supply may still be tight. Falling prices alongside narrowing backwardation would offer stronger evidence that supply is normalizing. Third, the November 10 EIA outlook and the weekly inventory reports that follow will help show whether the agency lowers its production outage assumptions and whether the draws in crude and distillate stocks slow. The next move in oil will depend on whether hopes for diplomacy translate into more reliable deliveries at lower cost.