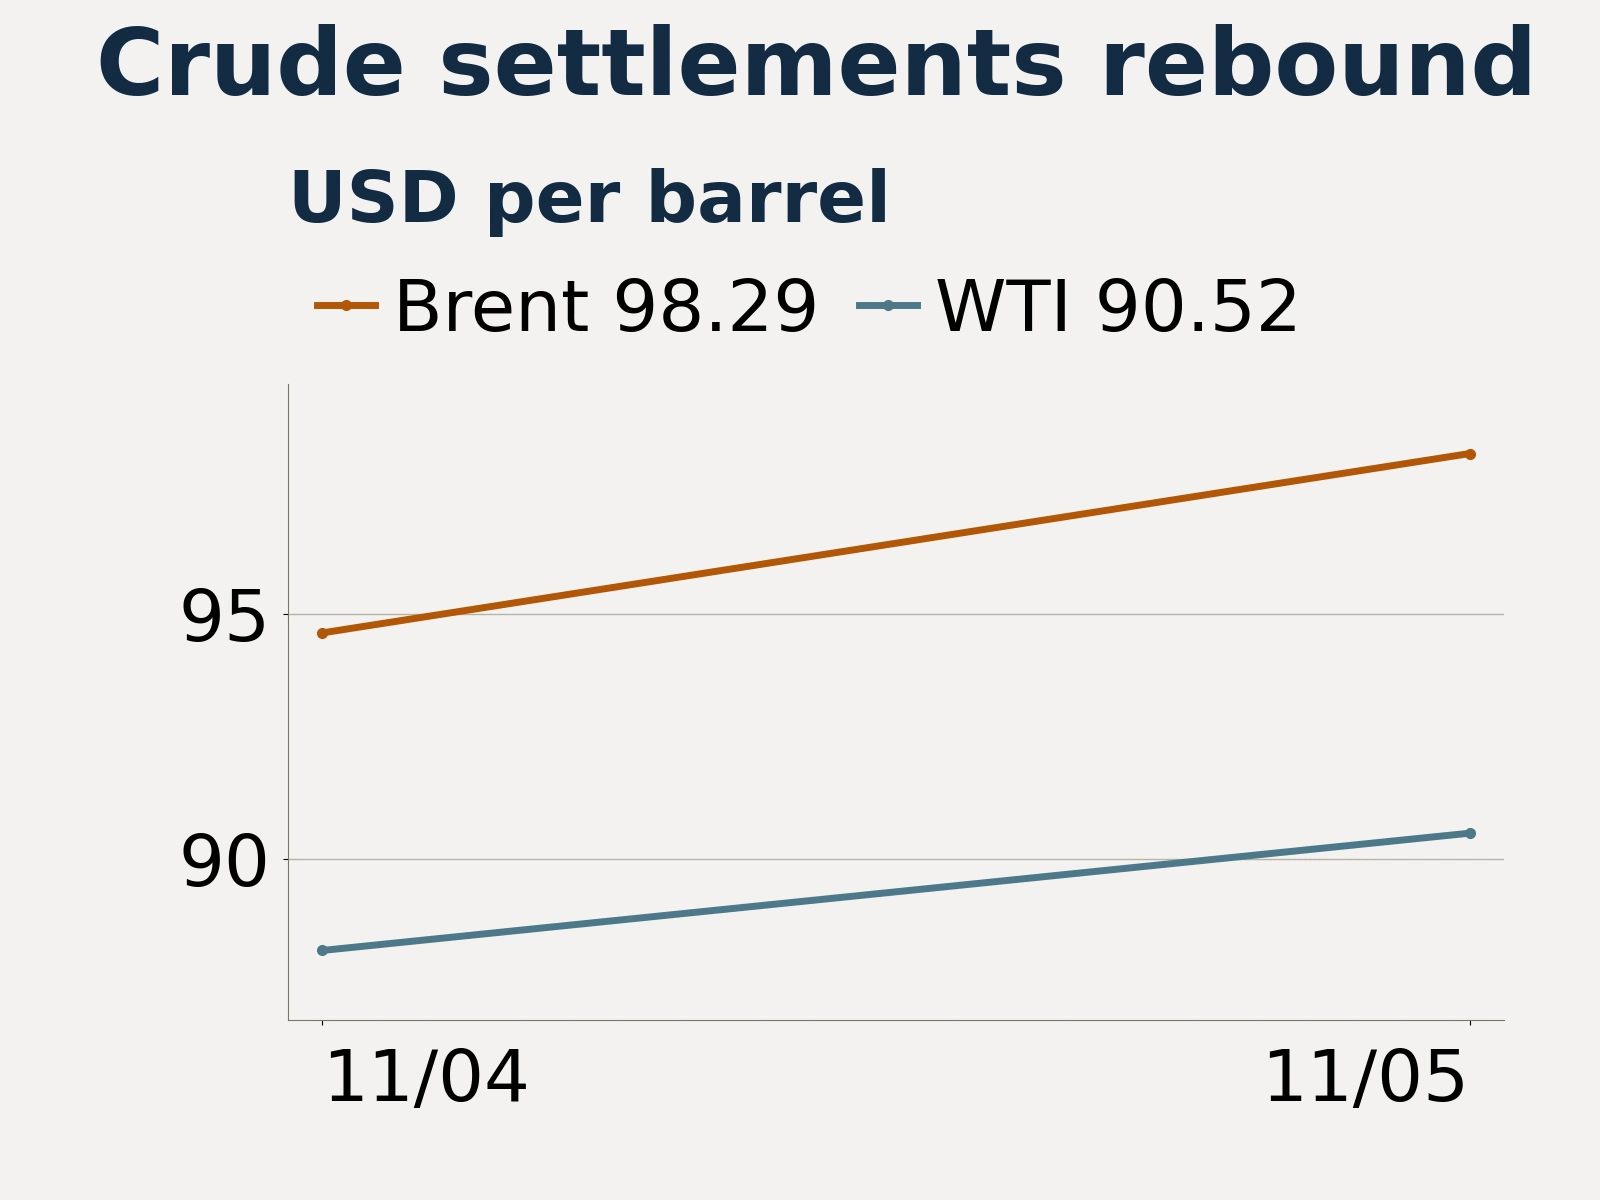
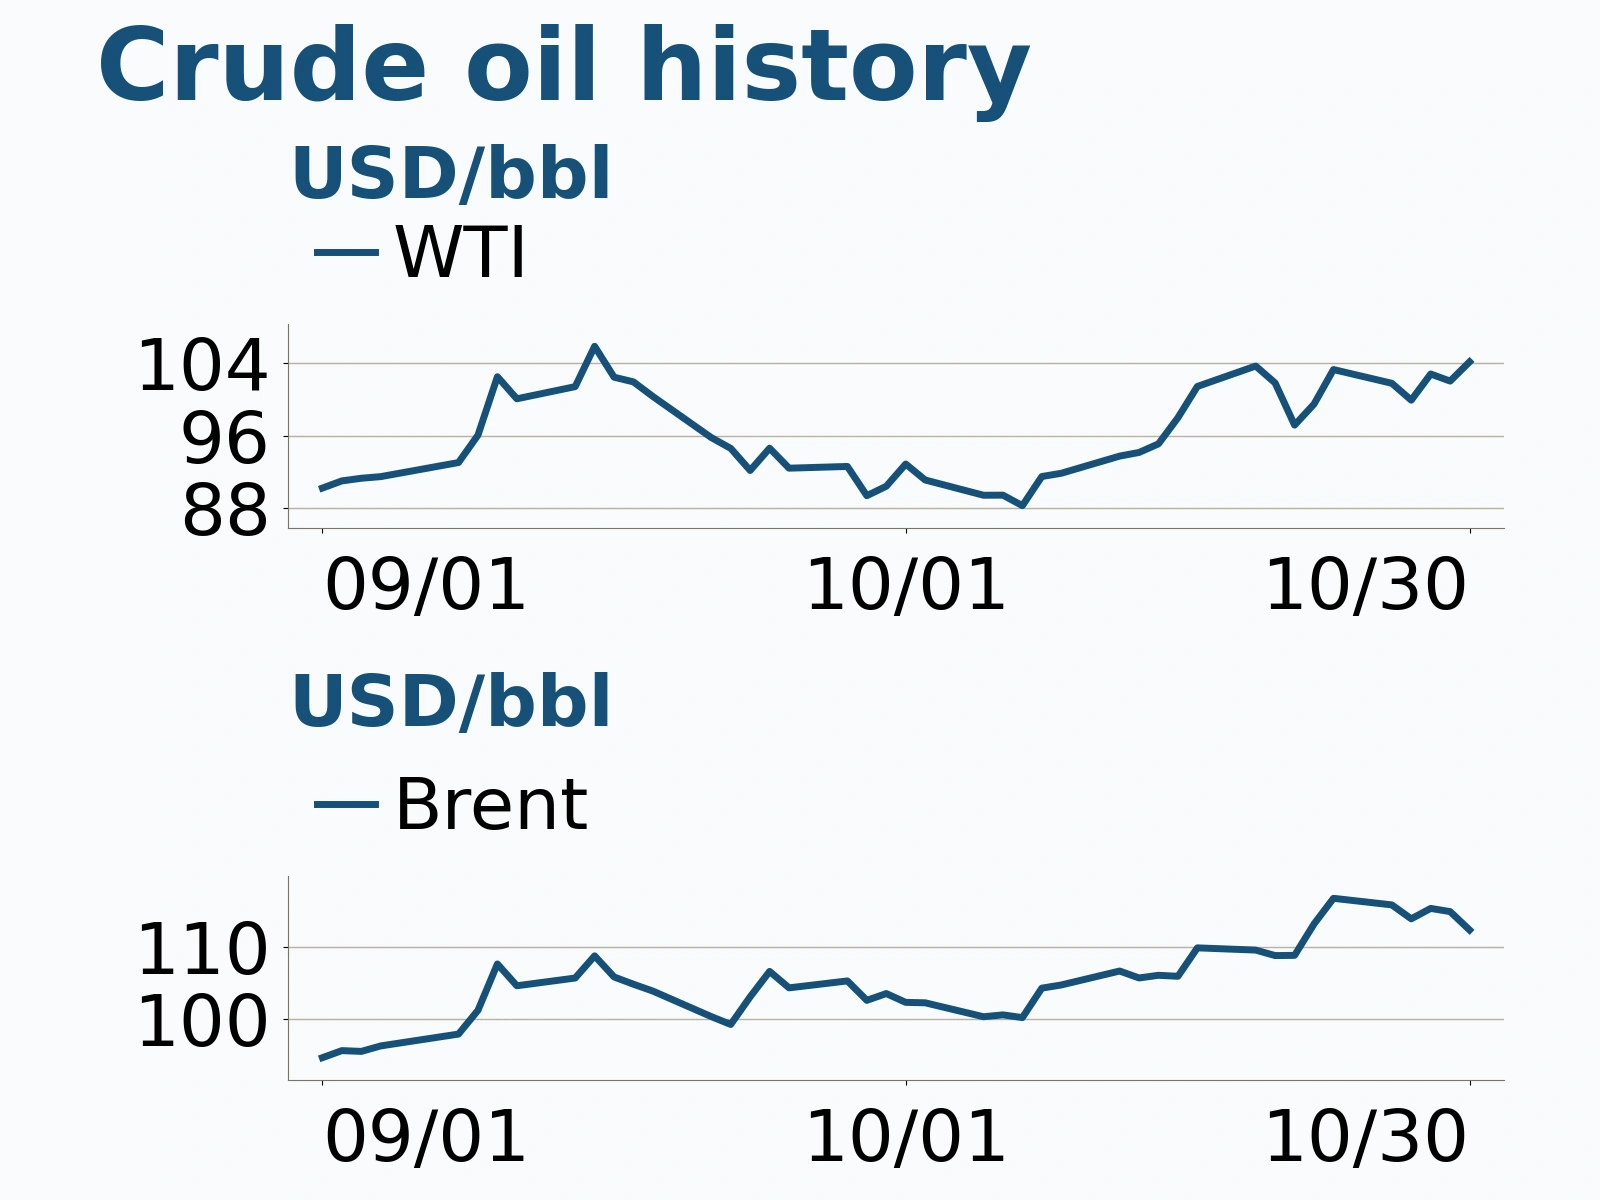
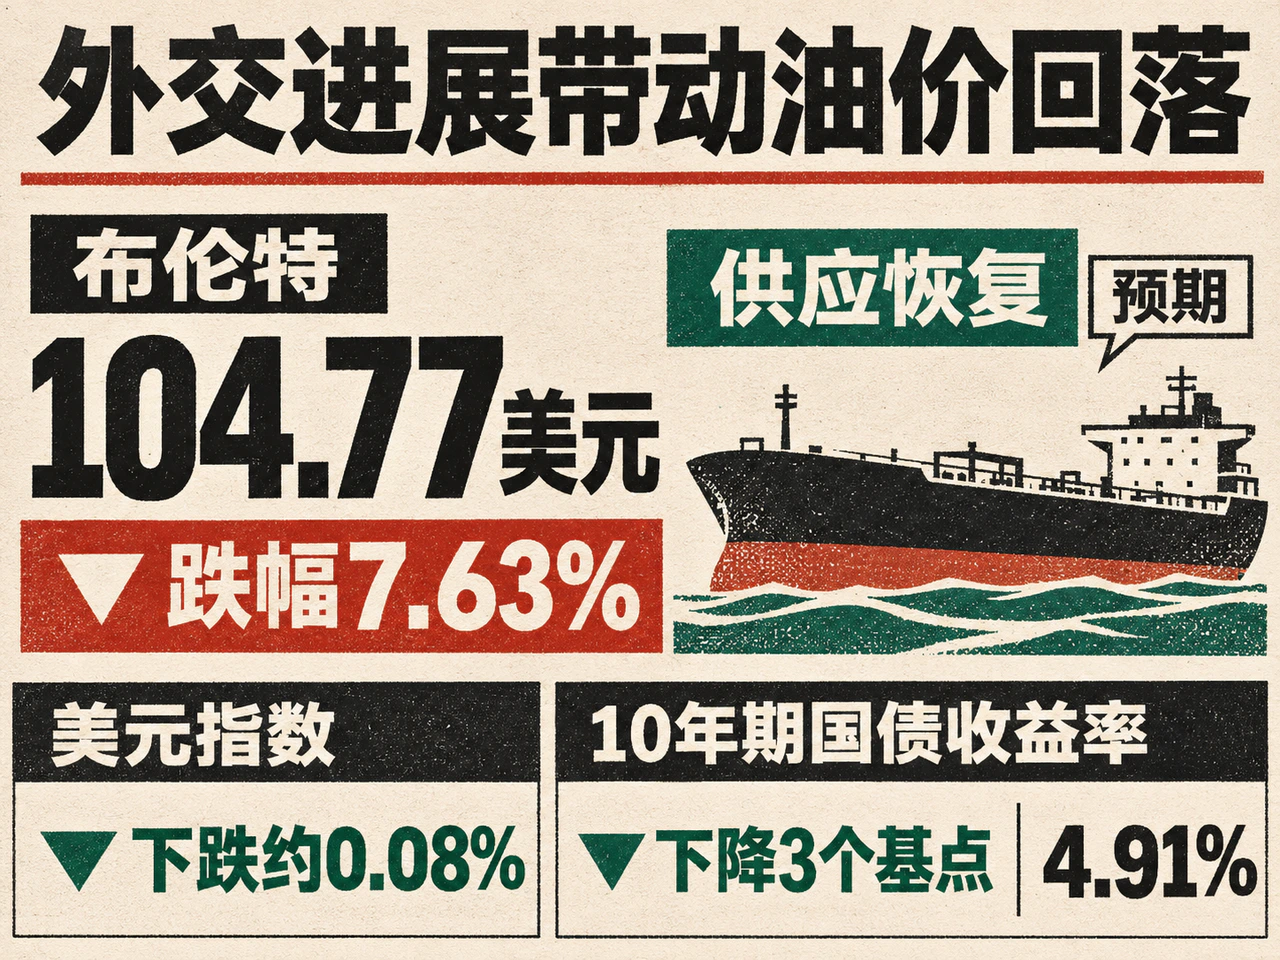
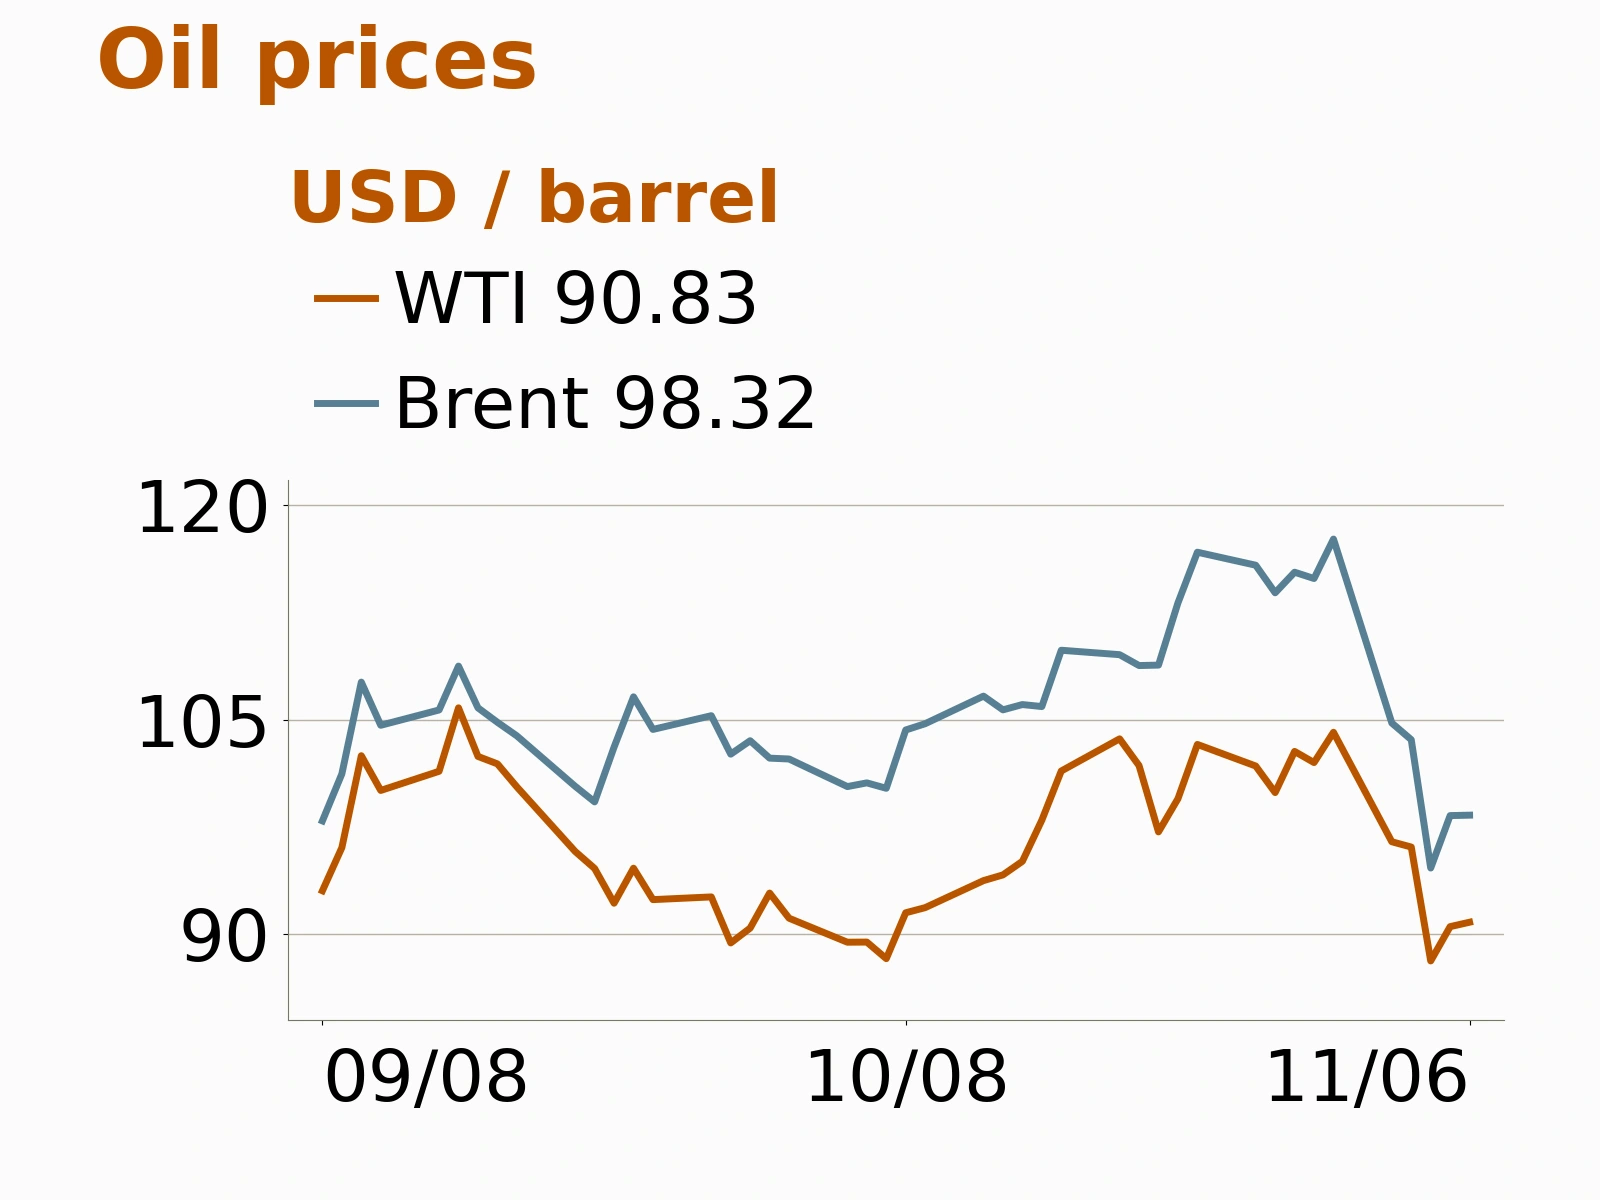
On November 6, crude oil recovered late in the session. Brent January 2027 futures settled at $98.32 per barrel, up $0.03; the data vendor’s daily close for continuous WTI futures was $90.83 per barrel, up $0.31, or about 0.34%. Both were above Wednesday’s lows but remained below their levels at the start of the week. Shipping risks supported the rebound, while the recovery in actual supply, the drag of high prices on demand and a stronger dollar limited the gains.
The key tension in current pricing is that the physical market is beginning to show signs of easing while the risk of disruptions to Gulf shipping remains unresolved. The market must assess both how much crude is available to buy and whether it can reach refineries on time and in the required grades.
Physical supply eases, but nearby futures retain a premium
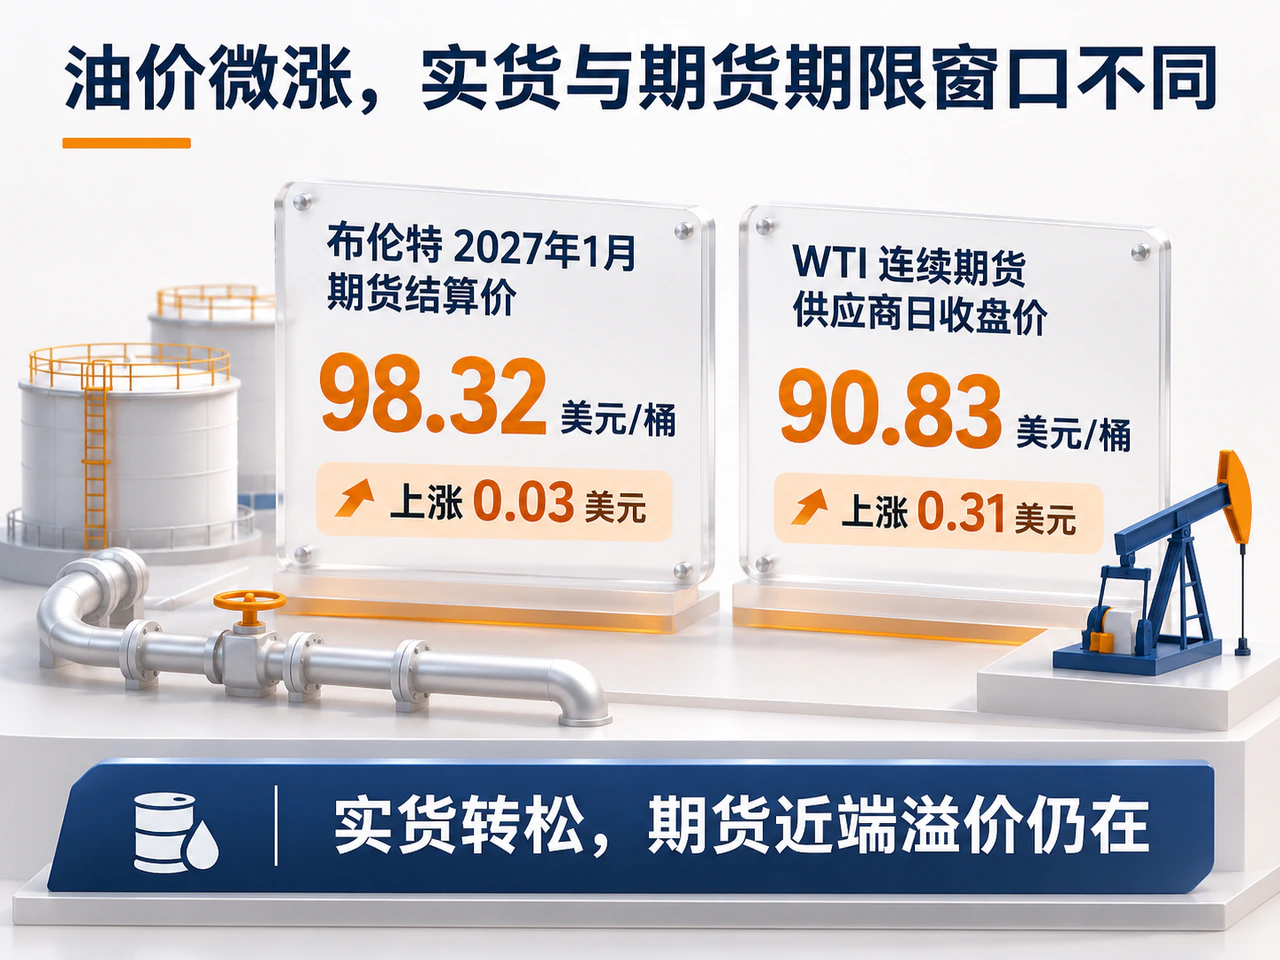
Reuters reported on November 6 that near-week Brent contracts for differences had moved into contango, with prices for delivery this week, in the second week and in the third week each below the following week. The discount for this week relative to next week was the largest since July. This indicates that crude for immediate delivery is no longer in short supply across the board. Meanwhile, the Brent futures curve remained backwardated from the January 2027 contract onward, with nearby supply risks continuing to command a premium.
The two sets of prices cover different delivery windows. If easing in the physical market persists, it could gradually feed through to futures; if shipping is disrupted again, the value of near-term delivery could rise once more.
Institutions still disagree on the extent of the easing. JPMorgan estimates that global supply exceeded consumption by about 1.1 million barrels per day in September, widening to 1.4 million barrels per day in October. Goldman Sachs takes a more moderate view of September and October, judging the market to be broadly balanced and global inventories to have stopped their earlier decline. Both assessments point to a change in the sustained inventory drawdowns seen early in the conflict.
Vortexa estimates that Gulf crude and condensate exports were about 14 million barrels per day in October, recovering to roughly 86% of their prewar level. Refined-product exports were about 3.1 million barrels per day, only slightly above half their normal level. The different pace of recovery in crude and refined products means that products such as diesel may still face supply pressures even as crude procurement conditions improve. Gulf shipments in October were slightly lower than in September.
U.S. inventories fall; OPEC+ keeps December output at September levels

Data released by the U.S. Energy Information Administration on November 4 for the week ended October 30 showed commercial crude inventories falling by 865,000 barrels to 409.76 million barrels, about 4% below the five-year average for the same time of year. Distillate inventories fell by 3.565 million barrels to 99.259 million barrels, about 13% below the five-year average. U.S. inventory drawdowns can coexist with institutional estimates of a broadly balanced global market, as differences across regions, products and shipping conditions persist.
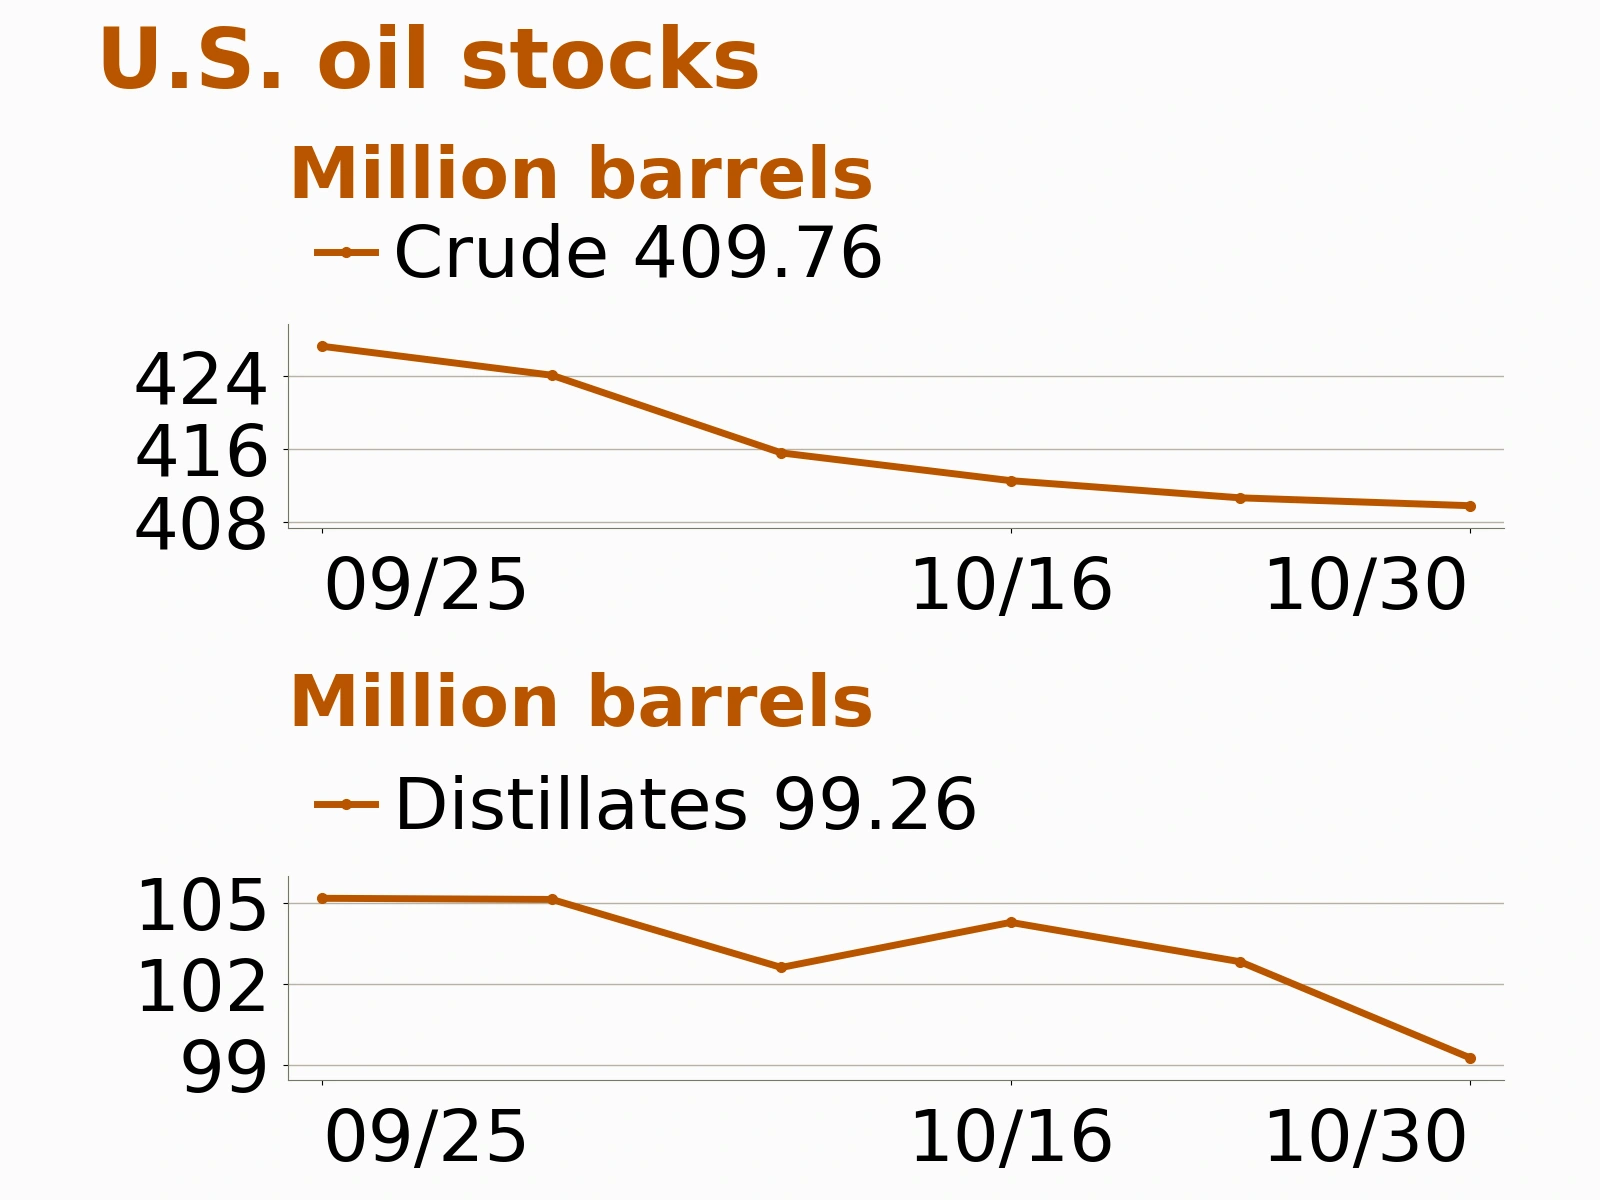
During the week, U.S. refinery crude inputs increased by 199,000 barrels per day to 16.725 million barrels per day, with utilization reaching 94.5%. Crude production was 14.003 million barrels per day, up 11,000 barrels per day from the previous week; crude exports fell by 1.179 million barrels per day to 3.675 million barrels per day. Inventory changes reflect the combined effects of refinery processing, production, imports, exports and statistical adjustments. With refinery runs strengthening and distillate stocks falling, tightness in refined products warrants separate attention.
Supply policy offered no signal of a further acceleration in output increases: on November 1, seven OPEC+ members, including Saudi Arabia and Russia, decided to maintain December production at the levels specified for September. Their next meeting is scheduled for November 29. The current rebalancing of supply and demand depends more on existing production capacity, export routes and changes in demand.
Shipping risks provide support; a stronger dollar limits the upside
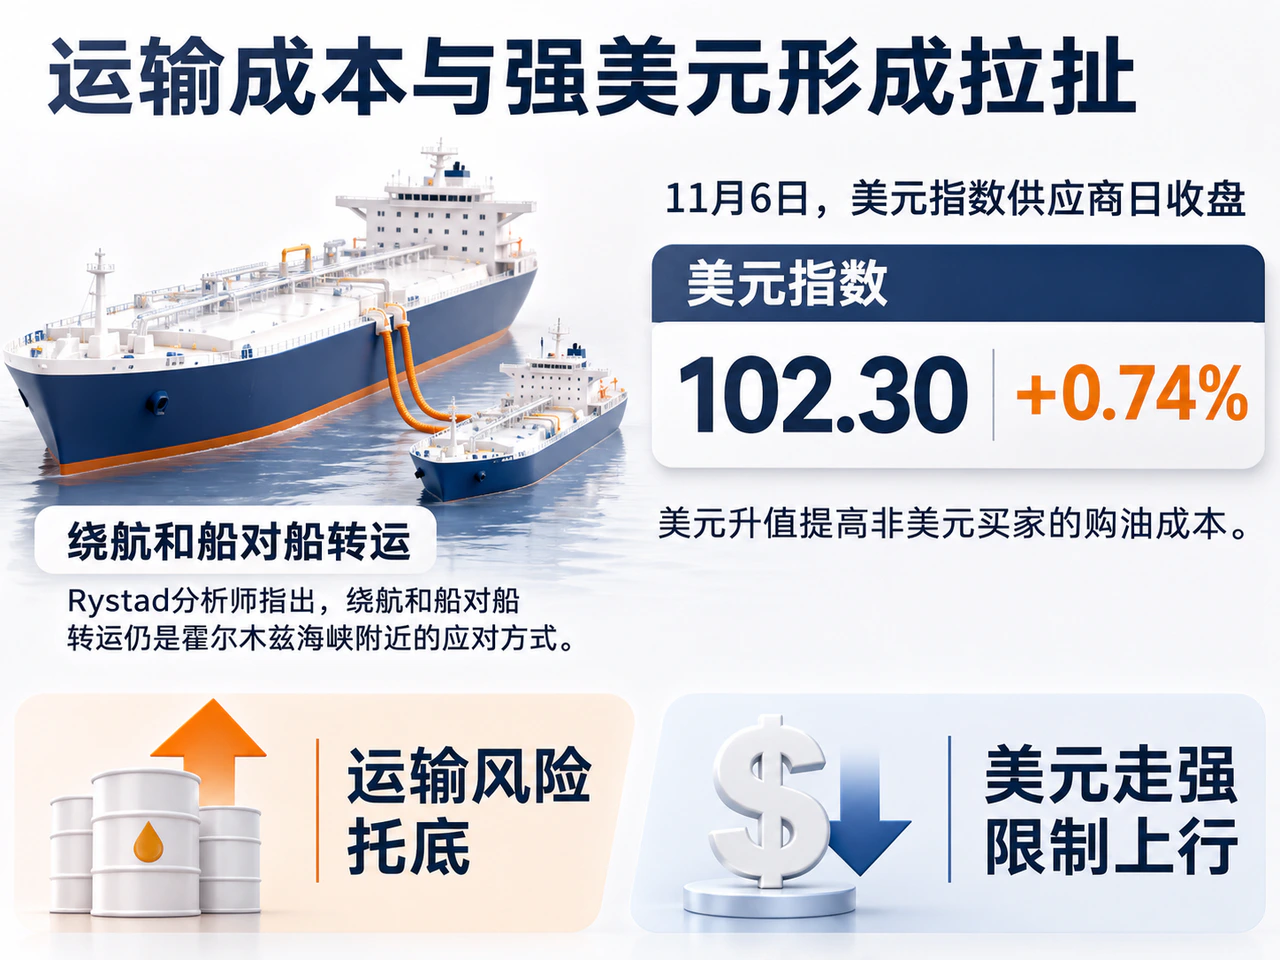
Reuters reported on November 6, citing a Greek ship manager, that there had been a fatal explosion aboard a product tanker in the Gulf the previous day, in an incident believed potentially to involve a missile strike. Rystad analysts noted that rerouting and ship-to-ship transfers remain ways of coping with conditions near the Strait of Hormuz. These arrangements lengthen transit times and make it more complicated to match crude grades with refinery requirements.
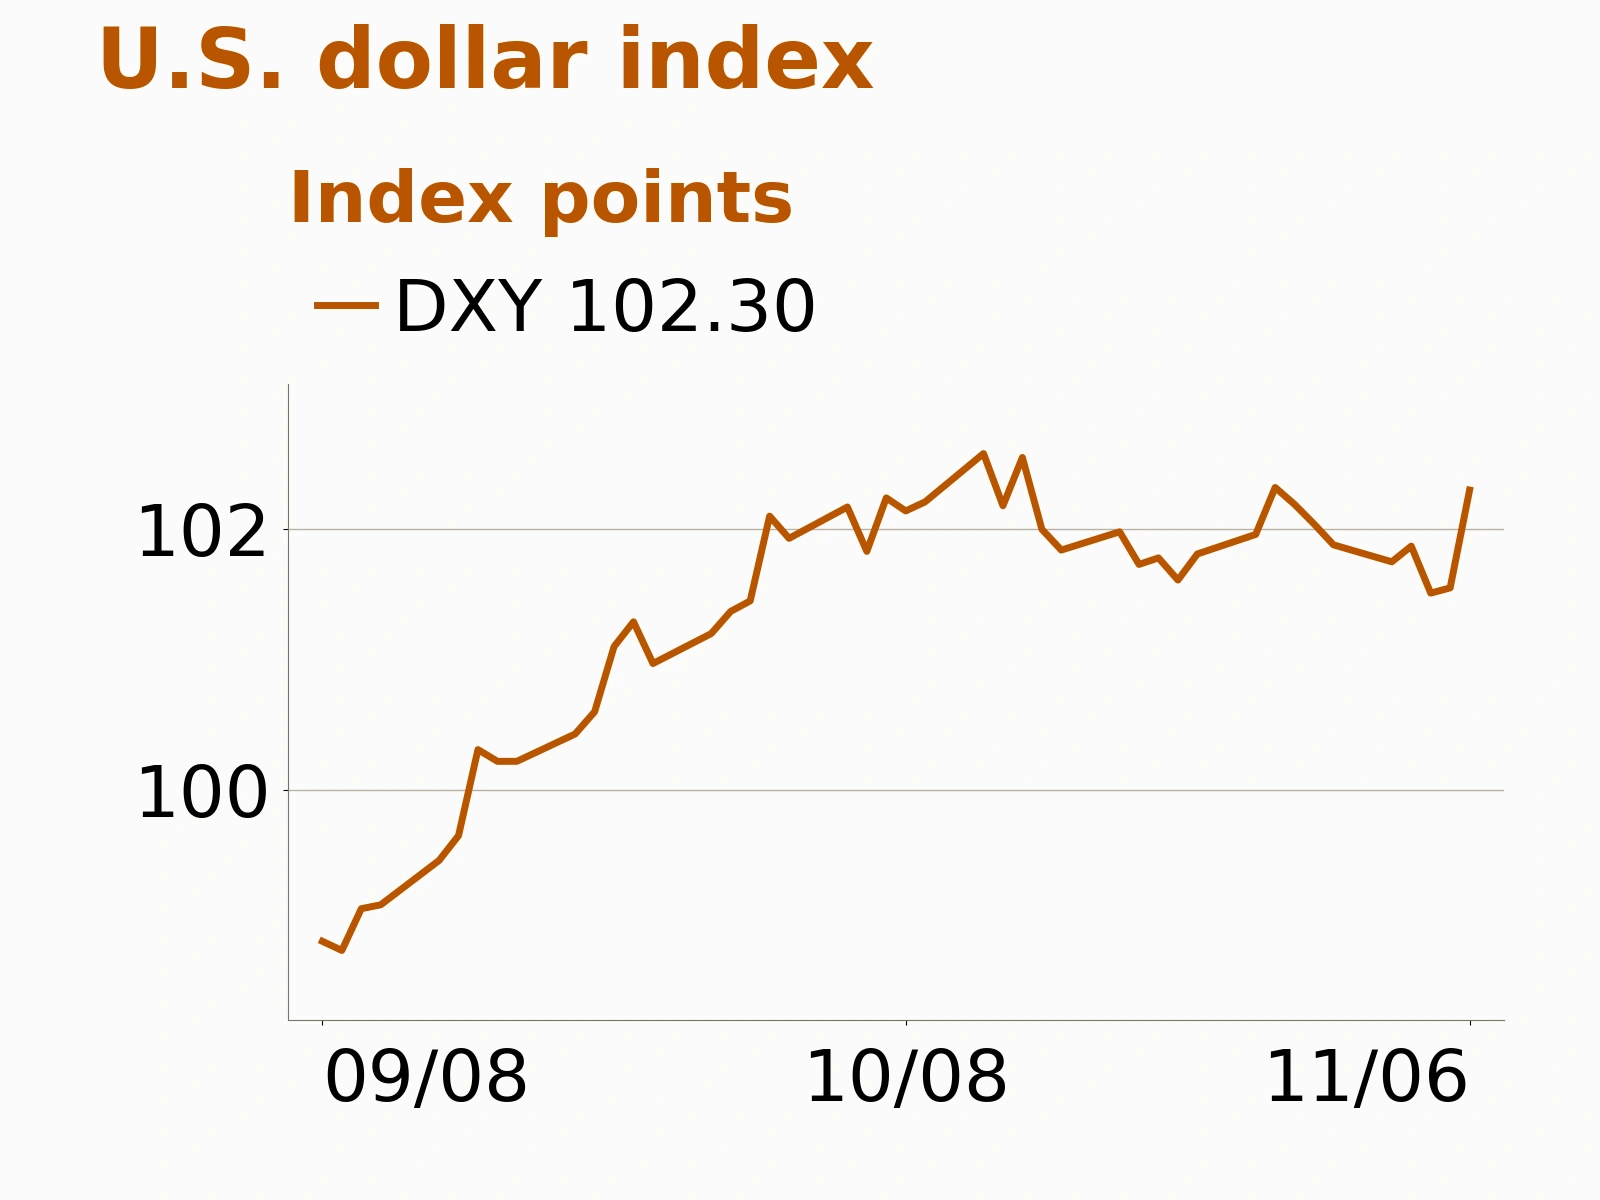
Financial conditions provided less support for oil prices. On November 6, the data vendor’s daily close for the dollar index rose about 0.74% to 102.30; dollar appreciation raises oil purchasing costs for buyers using other currencies. Oil’s modest gains despite this backdrop are consistent with the assessment that shipping risks provided support. The limited increase also suggests that the market has not fully returned to betting on shortages.
Four signals merit attention:
- If near-week Brent contracts for differences remain in contango and that structure feeds through to futures, it would strengthen the case that supply is easing;
- If attacks cause actual Gulf loadings and deliveries to fall again, they would support a renewed rise in the risk premium;
- If U.S. distillate inventories keep falling despite high refinery utilization, tightness in products would continue to support demand for refinery processing;
- If the dollar continues to strengthen while physical-market premiums fail to recover, oil’s upside would be further constrained.