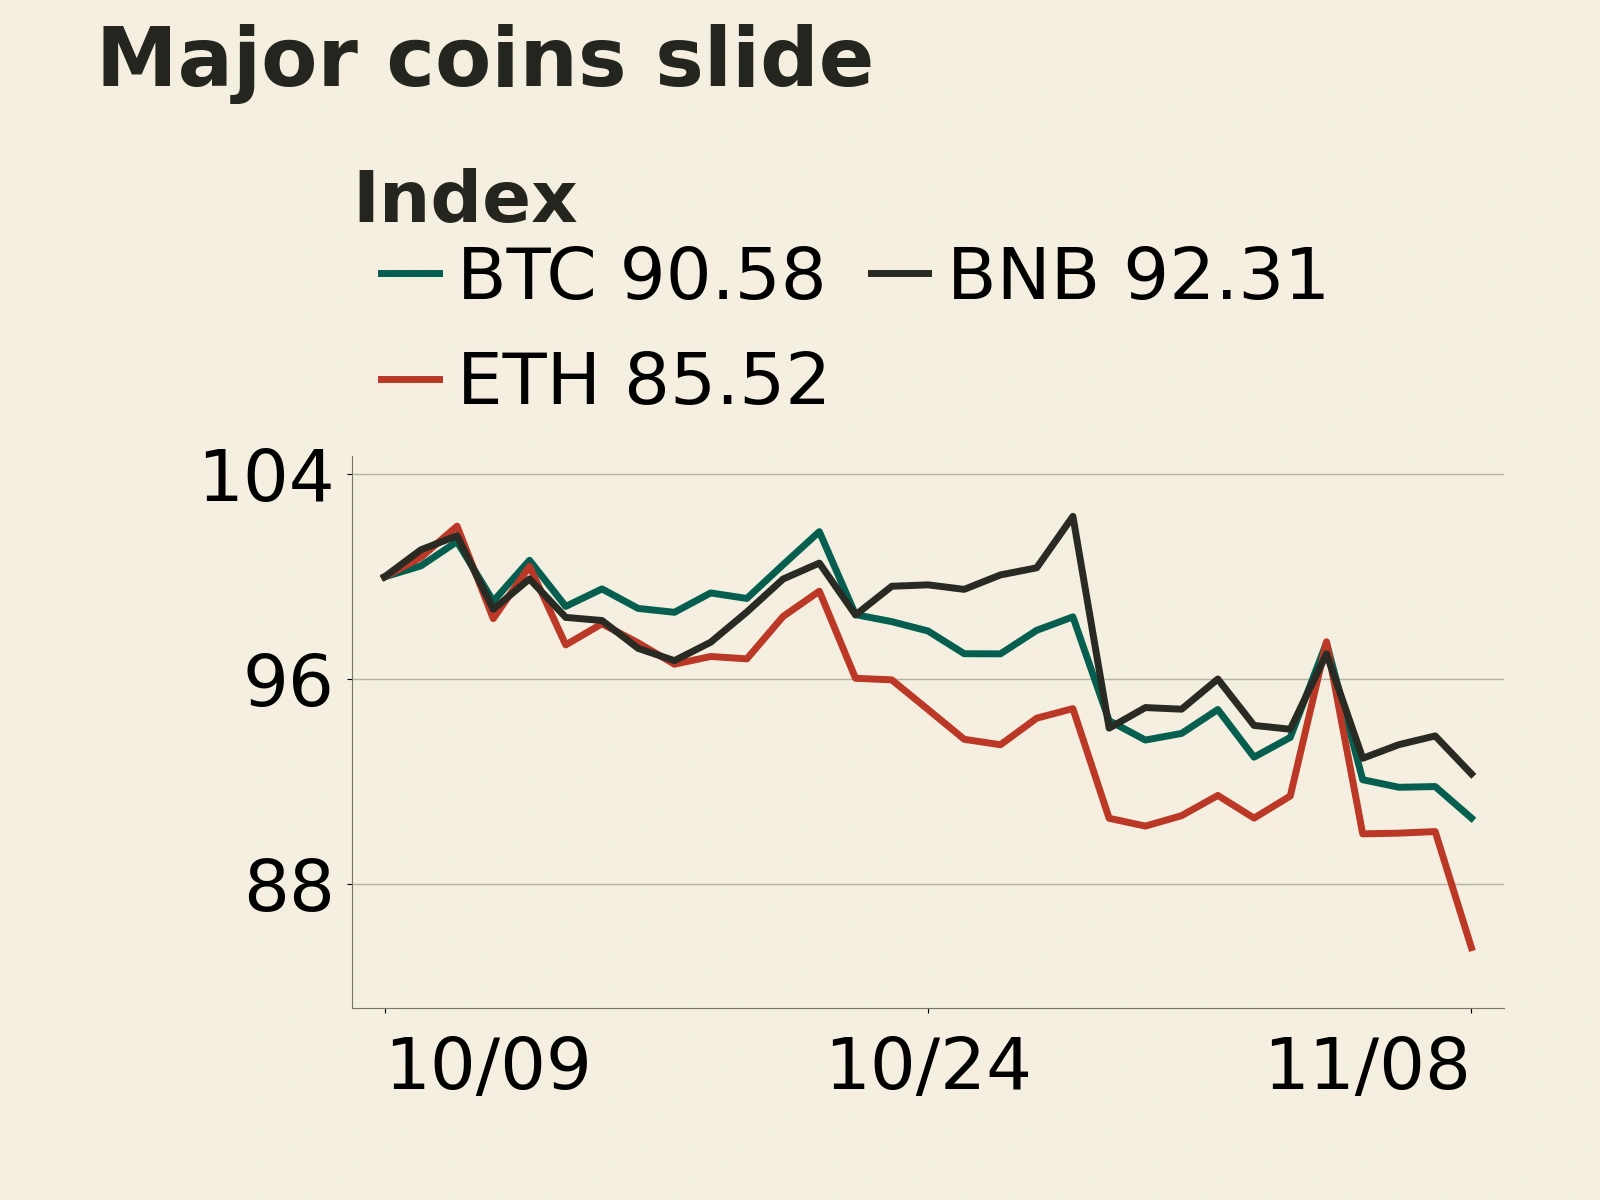
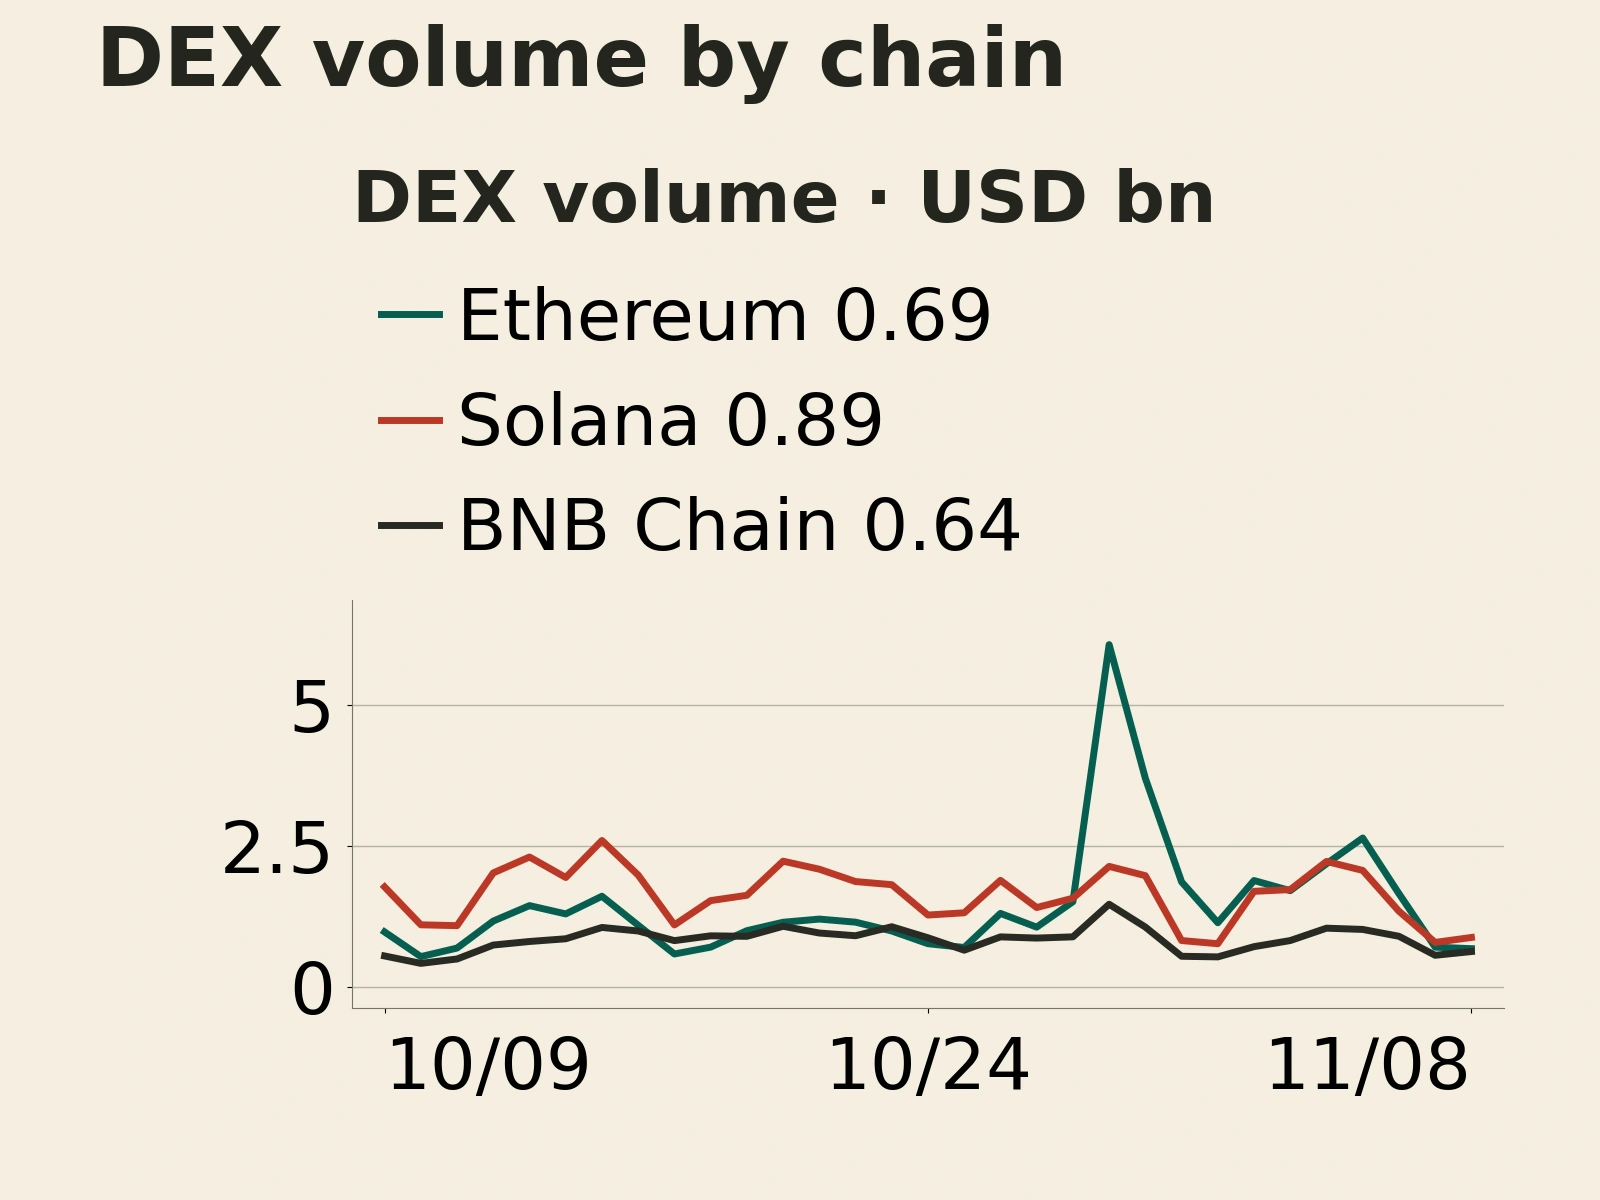
From November 2 to 6, U.S. spot Bitcoin ETFs recorded $1.2817 billion in net outflows over five trading sessions. Spot Ether ETFs lost a net $365.2 million over the same period, bringing the combined net outflow to $1.6469 billion. Meanwhile, open interest in Binance's BTC and ETH perpetual contracts edged higher in coin terms. The key shift in flows last week was an acceleration in withdrawals from investment allocations, even as trading positions held up.
Bitcoin ETF outflows rise to 6.3 times the prior week's level, while stablecoin market cap falls 1.47%
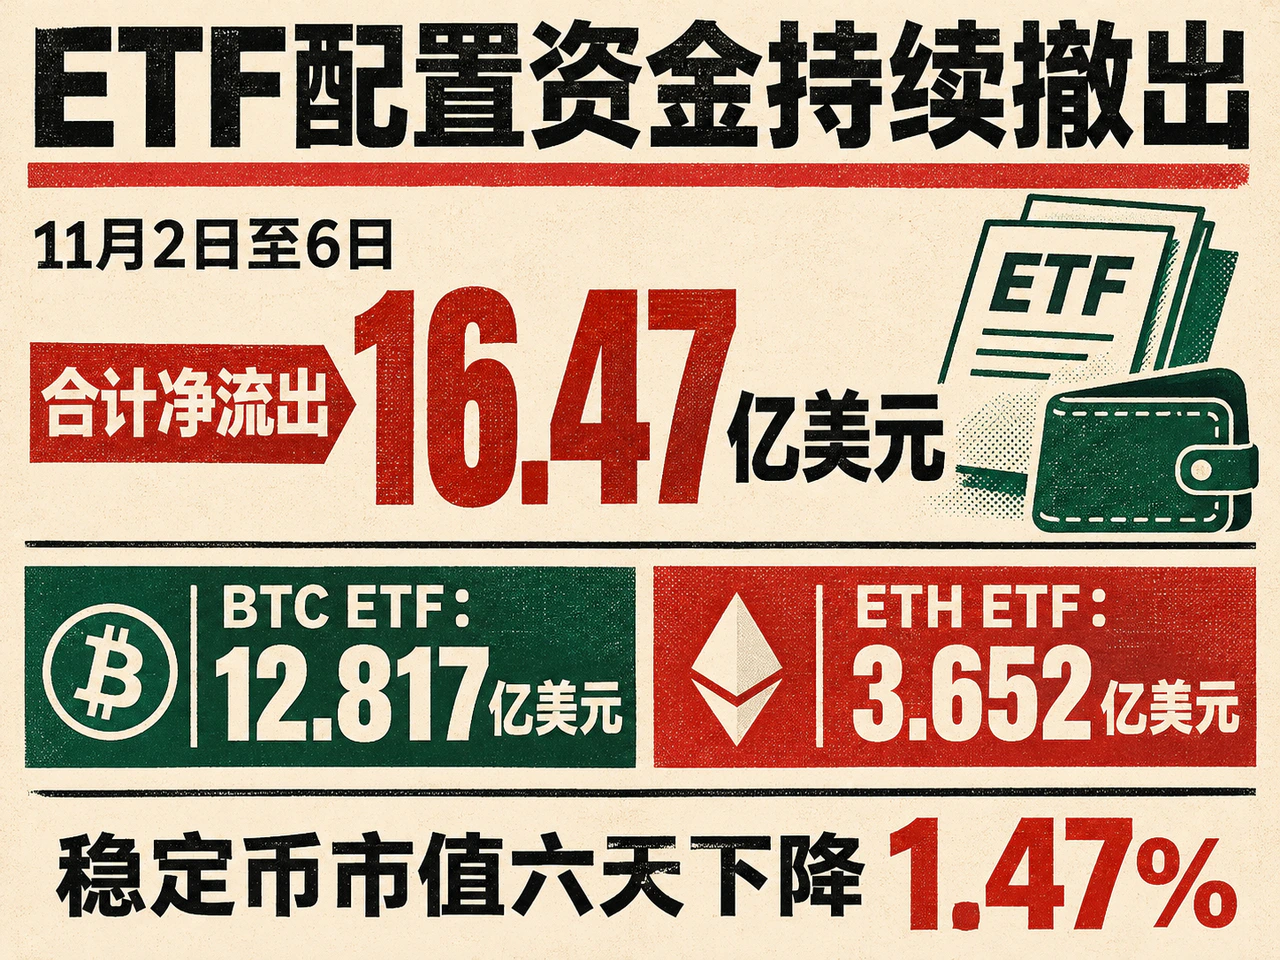
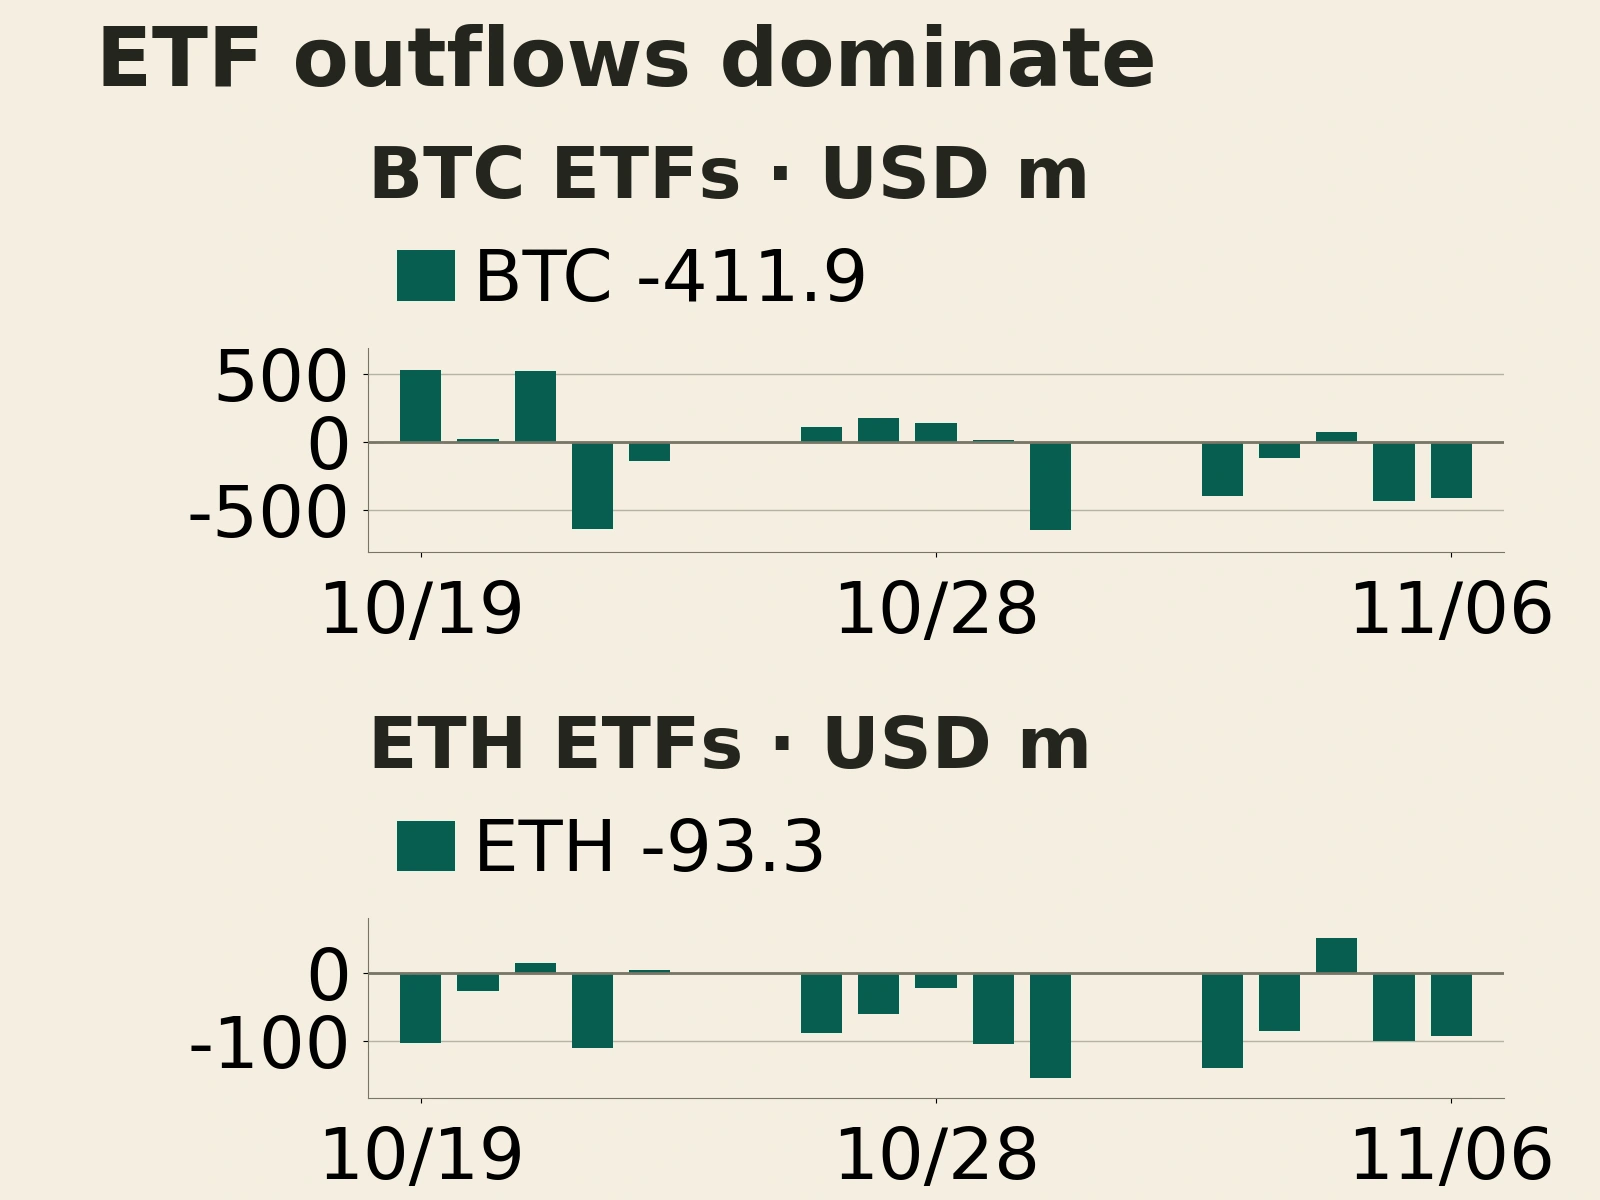
Outflows from Bitcoin ETFs accelerated sharply. Net outflows totaled $1.2817 billion from November 2 to 6, about 6.3 times the $202.4 million recorded the previous week, from October 26 to 30. Wednesday was the only session with net inflows, at $74.6 million. Thursday and Friday then recorded a combined $842.1 million in net outflows, more than 60% of the week's total, including $411.9 million on Friday, November 6. Wednesday's one-day rebound in flows left the overall direction for the week intact.
Flows varied by fund. BlackRock's IBIT recorded $1.2095 billion in net outflows over the five sessions, while Fidelity's FBTC took in a net $93.1 million. On Wednesday, IBIT lost a net $201.2 million and FBTC took in a net $236.7 million. Together with net inflows into other funds, that brought the aggregate daily figure back above zero. Differences in distribution channels, investor bases and trading arrangements may help explain why some funds attracted money against the broader trend. Across the market, redemption pressure remained pronounced.
Outflows from Ether ETFs eased slightly. Net outflows totaled $365.2 million over the same period, down from $431.4 million the prior week, with Wednesday again the only day of net inflows. Bitcoin ETF outflows accelerated and Ether ETF outflows slowed, but neither group attracted sustained new allocations. ETF net flows track creations and redemptions of fund shares, a separate measure from the decline in assets under management caused by falling coin prices.
The pool of on-chain dollar assets also shrank. In the same release of DefiLlama data, the circulating market capitalization of dollar-pegged stablecoins fell from $297.646 billion at 00:00 UTC on November 2 to $293.261 billion at 00:00 UTC on November 8, a decline of about $4.38 billion, or 1.47%. The data stop at the start of November 8 UTC. Compared with about $306.650 billion on October 9, market capitalization fell about $13.39 billion over the month, so the contraction was already underway before this week.
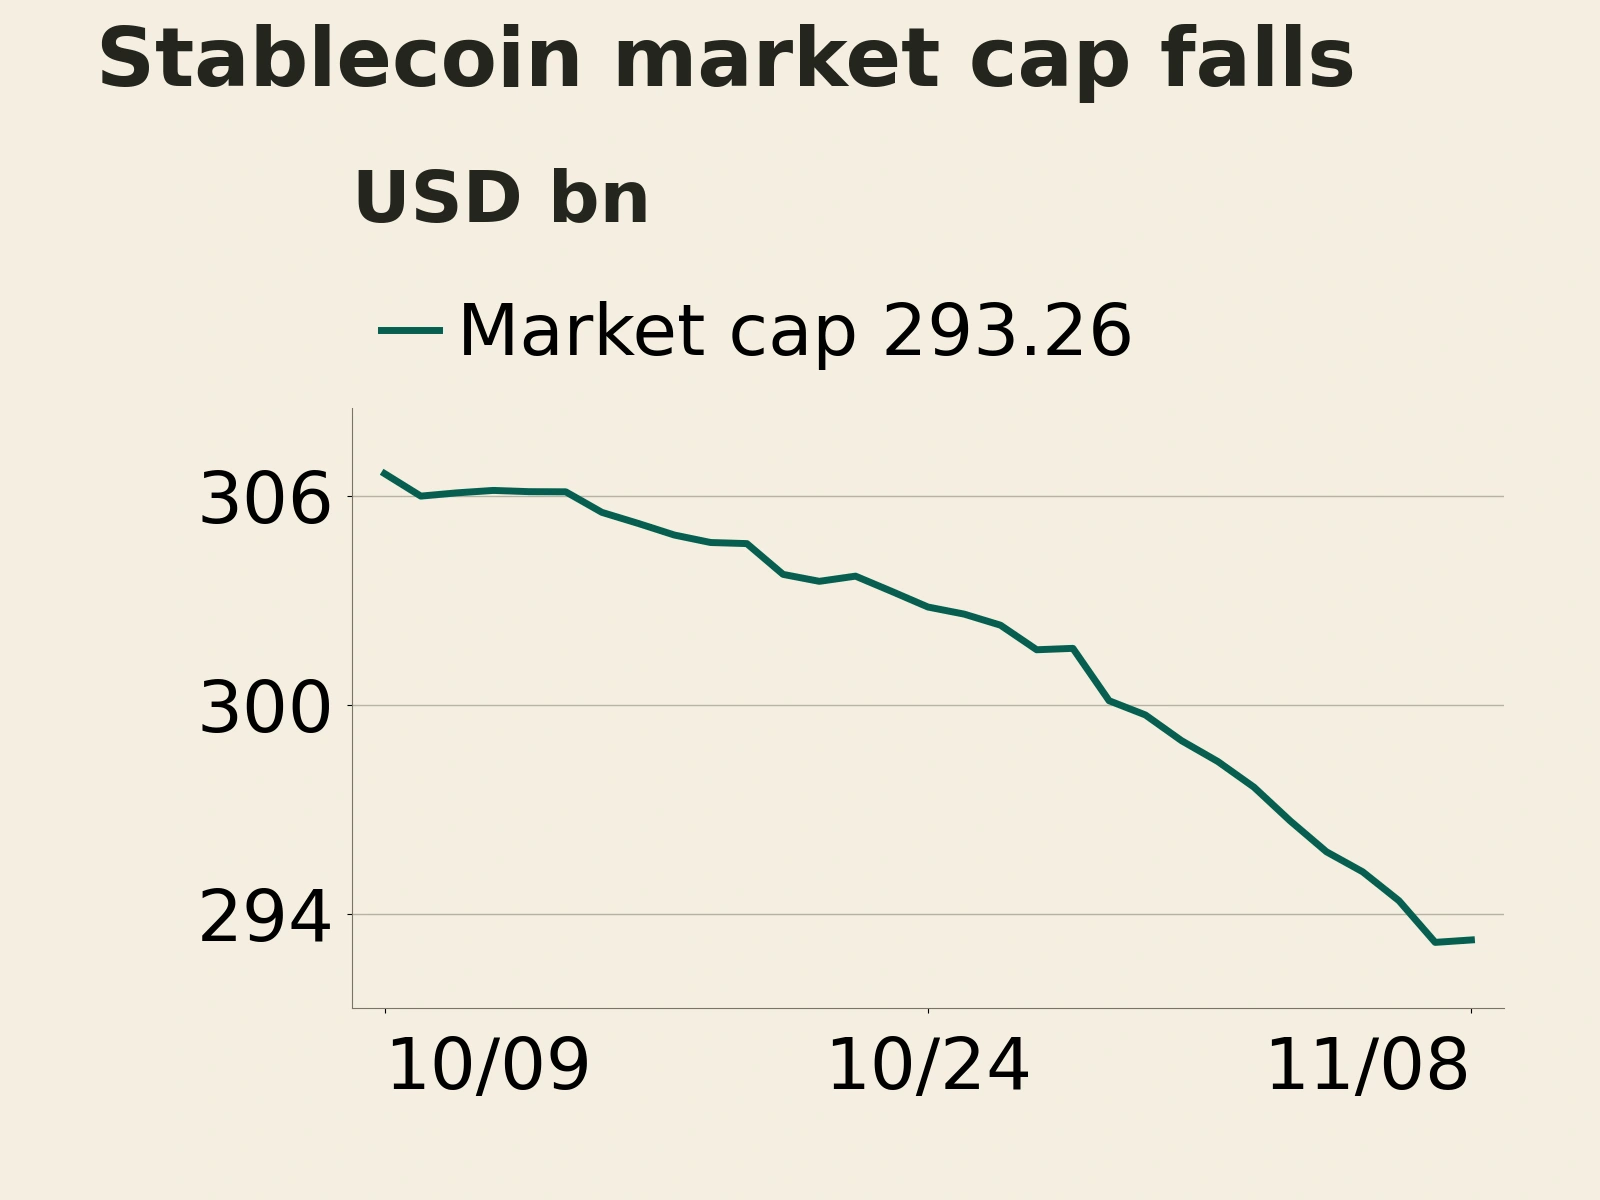
Stablecoins provide funding for trading, collateral, payments and settlement across platforms. Their market capitalization also reflects redemptions, deviations from the peg and changes in data coverage, so a decline cannot be read directly as money leaving the market through coin sales. ETF flows and stablecoin market capitalization measure different things and should be considered separately. Continued ETF outflows and a shrinking stablecoin market cap point respectively to a lack of growth in investment allocations and in the supply of on-chain dollar assets, leaving funding conditions for fresh buying subdued.
Binance perpetual open interest edges higher as Ether funding and implied volatility rise
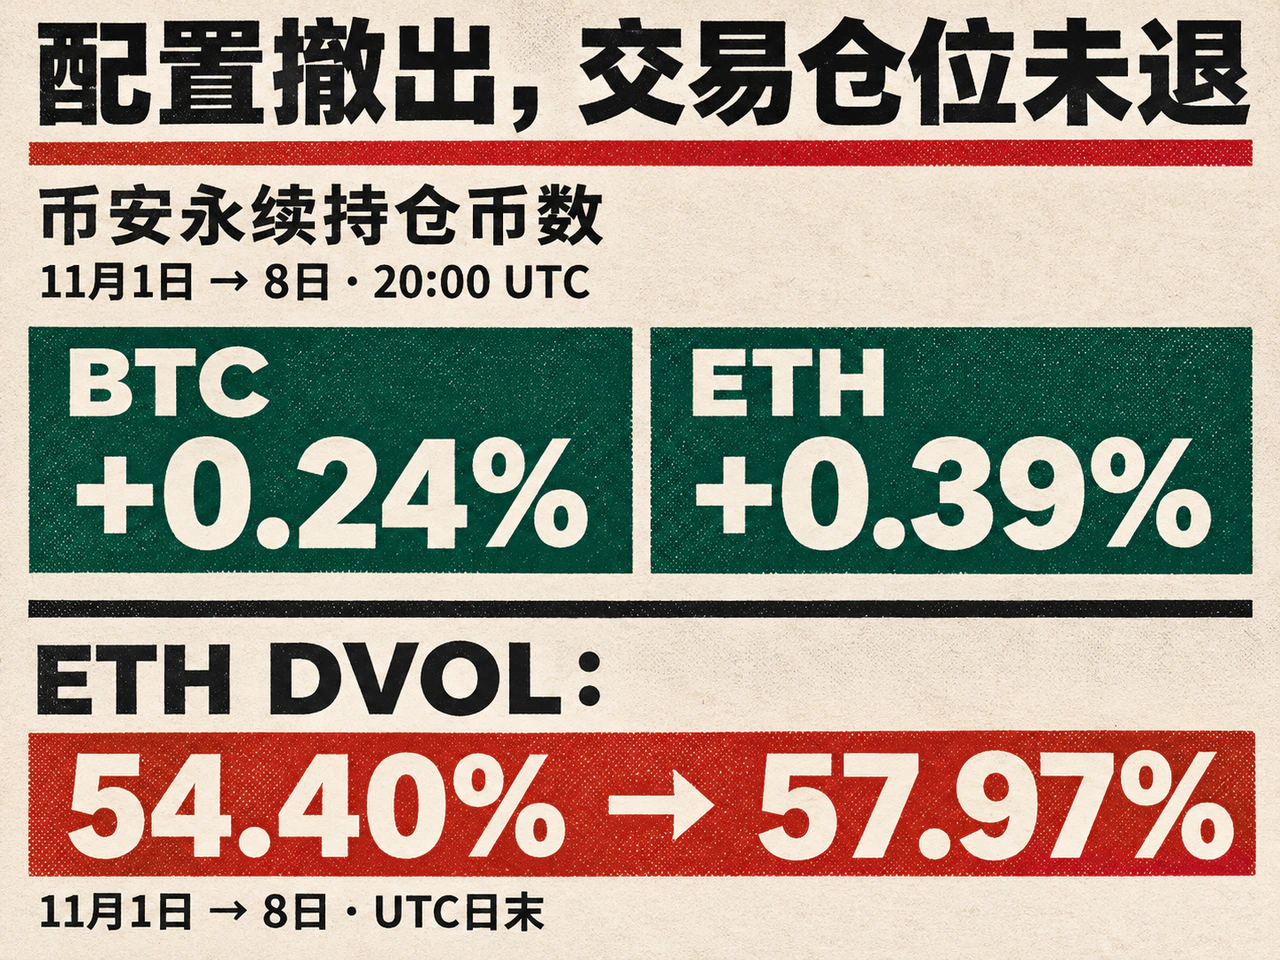
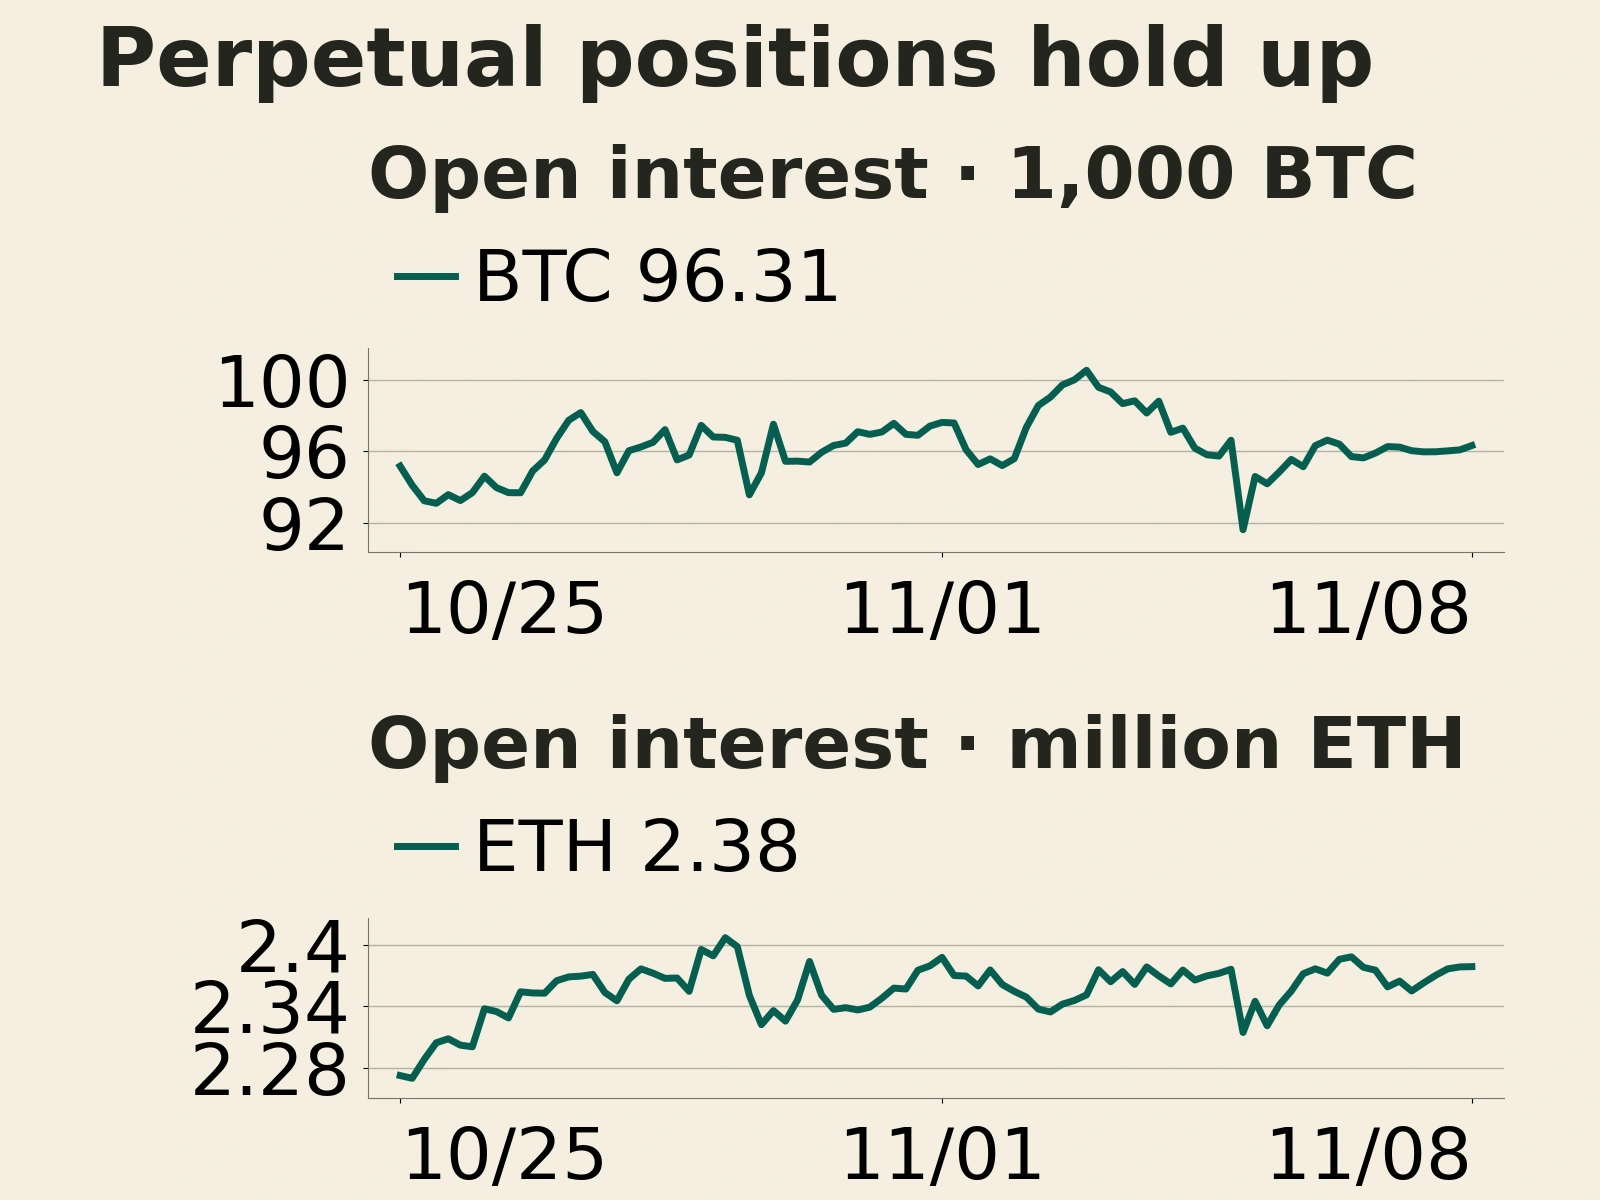
Derivatives positioning held up even as money left spot allocations. Comparing like-for-like samples at 20:00 UTC on November 1 and November 8, open interest in Binance's BTCUSDT perpetual rose from 96,078.787 BTC to 96,314.092 BTC, or about 0.24%. ETHUSDT open interest rose from 2,369,477.903 ETH to 2,378,725.318 ETH, or about 0.39%. Measuring open interest in coins removes the mechanical effect of coin price changes on the dollar notional value. The sample covers only those Binance contracts, and open interest includes both sides of each position, so an increase alone gives no indication of a net bullish tilt.
Funding rates showed a divergence in demand for leverage. Based on actual funding rates settled every eight hours from November 2 to 8, the BTC contract averaged 0.007775% for the week, slightly below 0.008050% the week before. The ETH contract's average rose from 0.002113% to 0.006506%. When funding is positive, longs pay shorts to maintain their positions. The average cost of holding a long position in the Ether contract therefore rose markedly, and demand for leveraged longs persisted alongside net ETF redemptions.
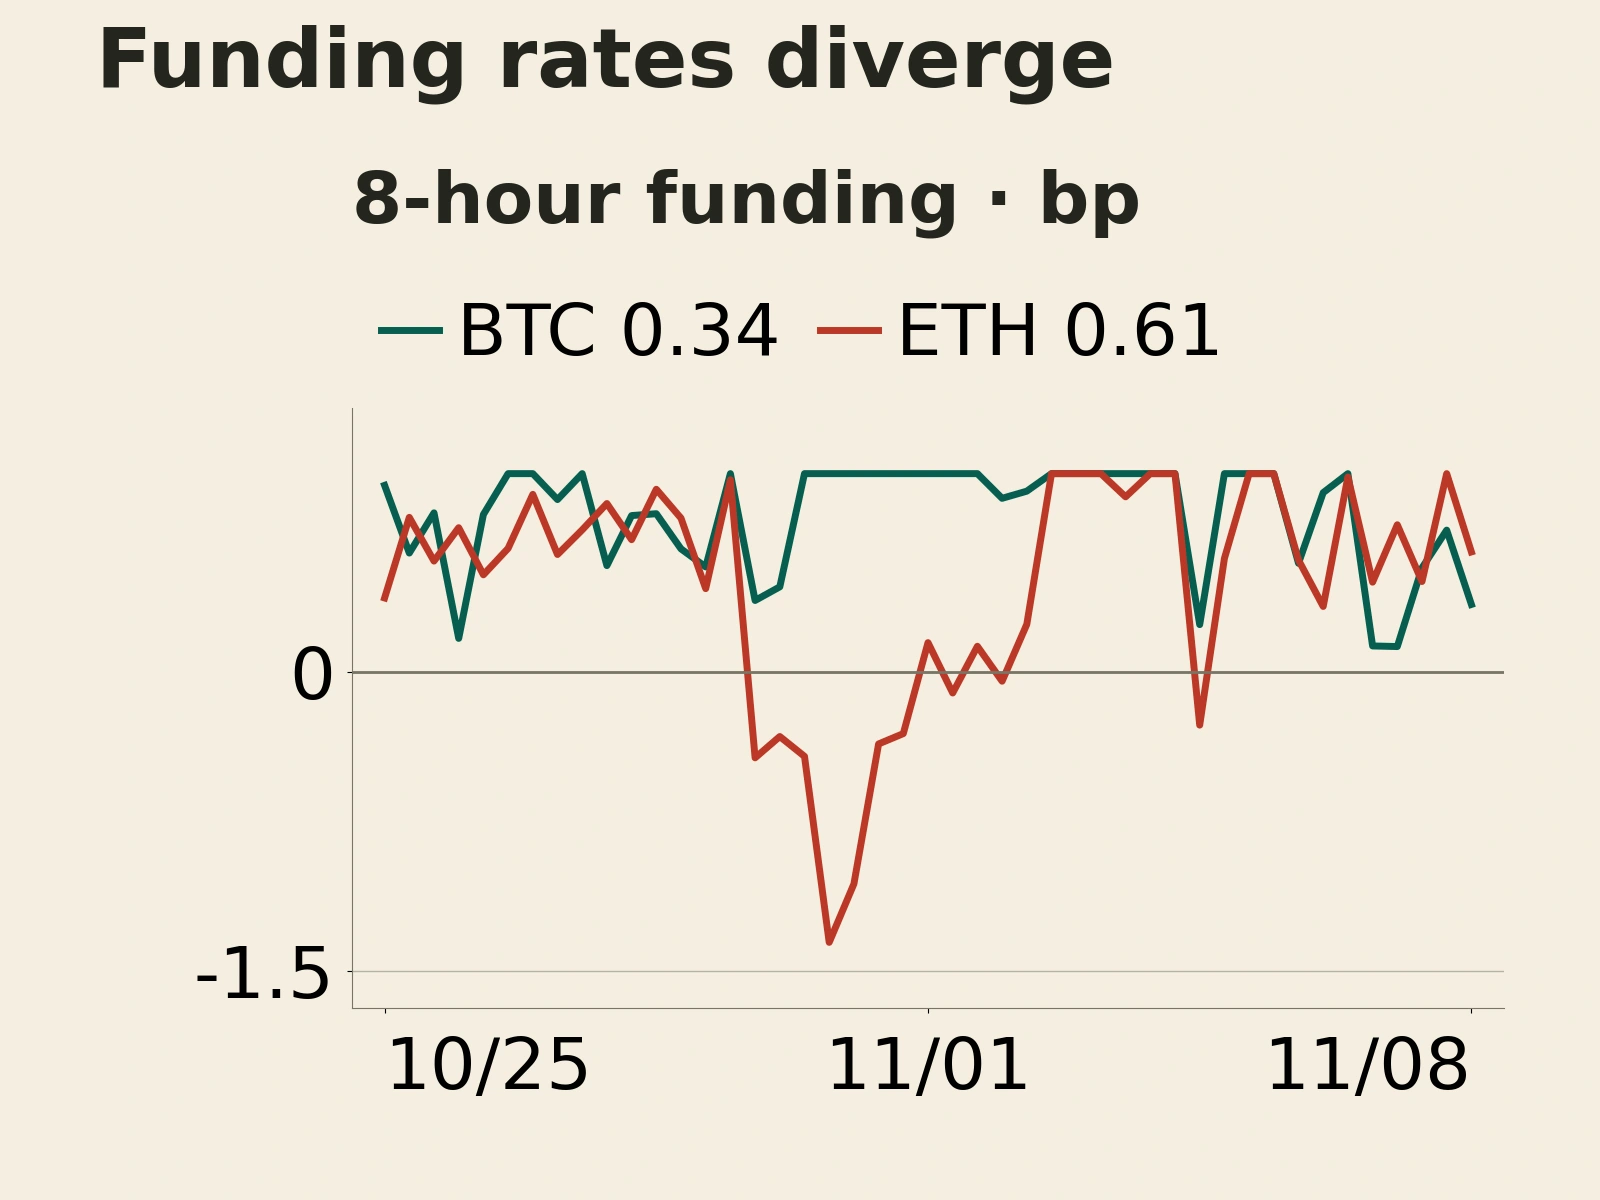
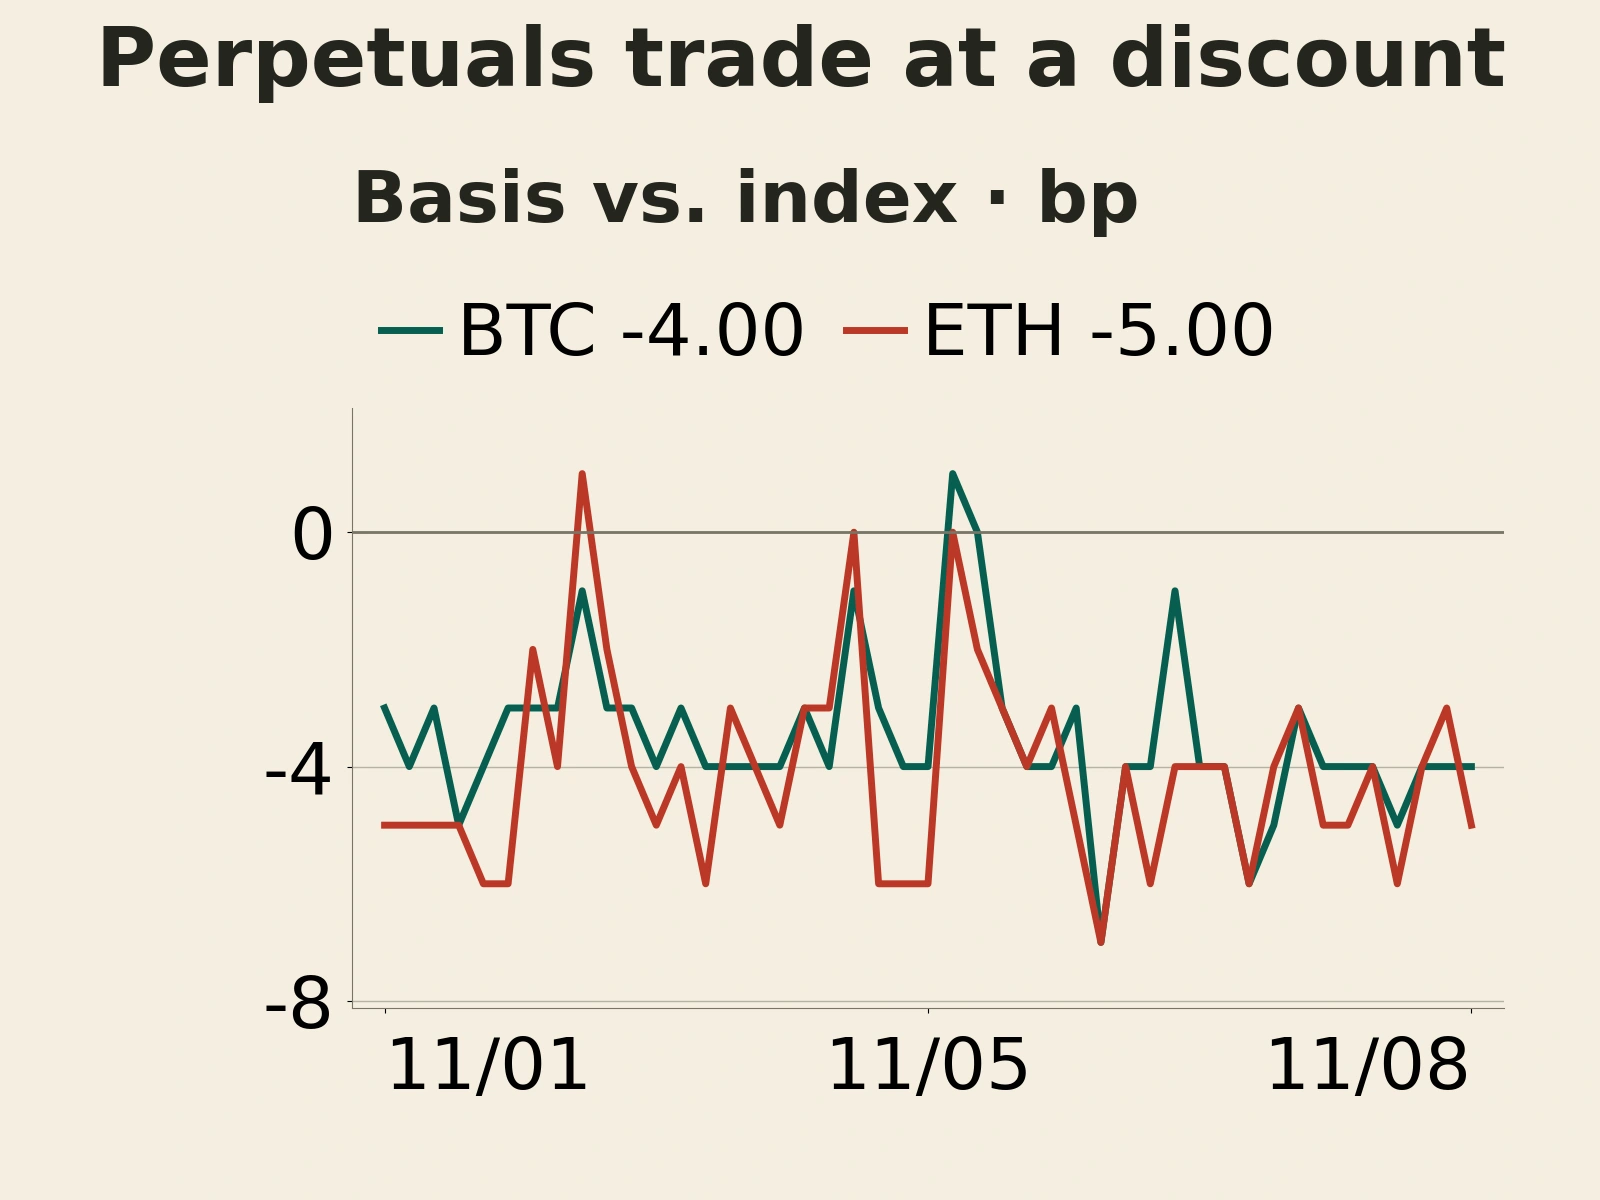
Demand for leverage has yet to translate into a pronounced premium on perpetual contracts. At 20:00 UTC on November 8, BTC and ETH perpetuals traded 0.04% and 0.05% below their respective indices. The funding figures are averages of settlements over the whole week, while basis measures the contract price relative to the index at a single point at the end of the period. Positive funding and a slight end-of-period discount can therefore coexist.
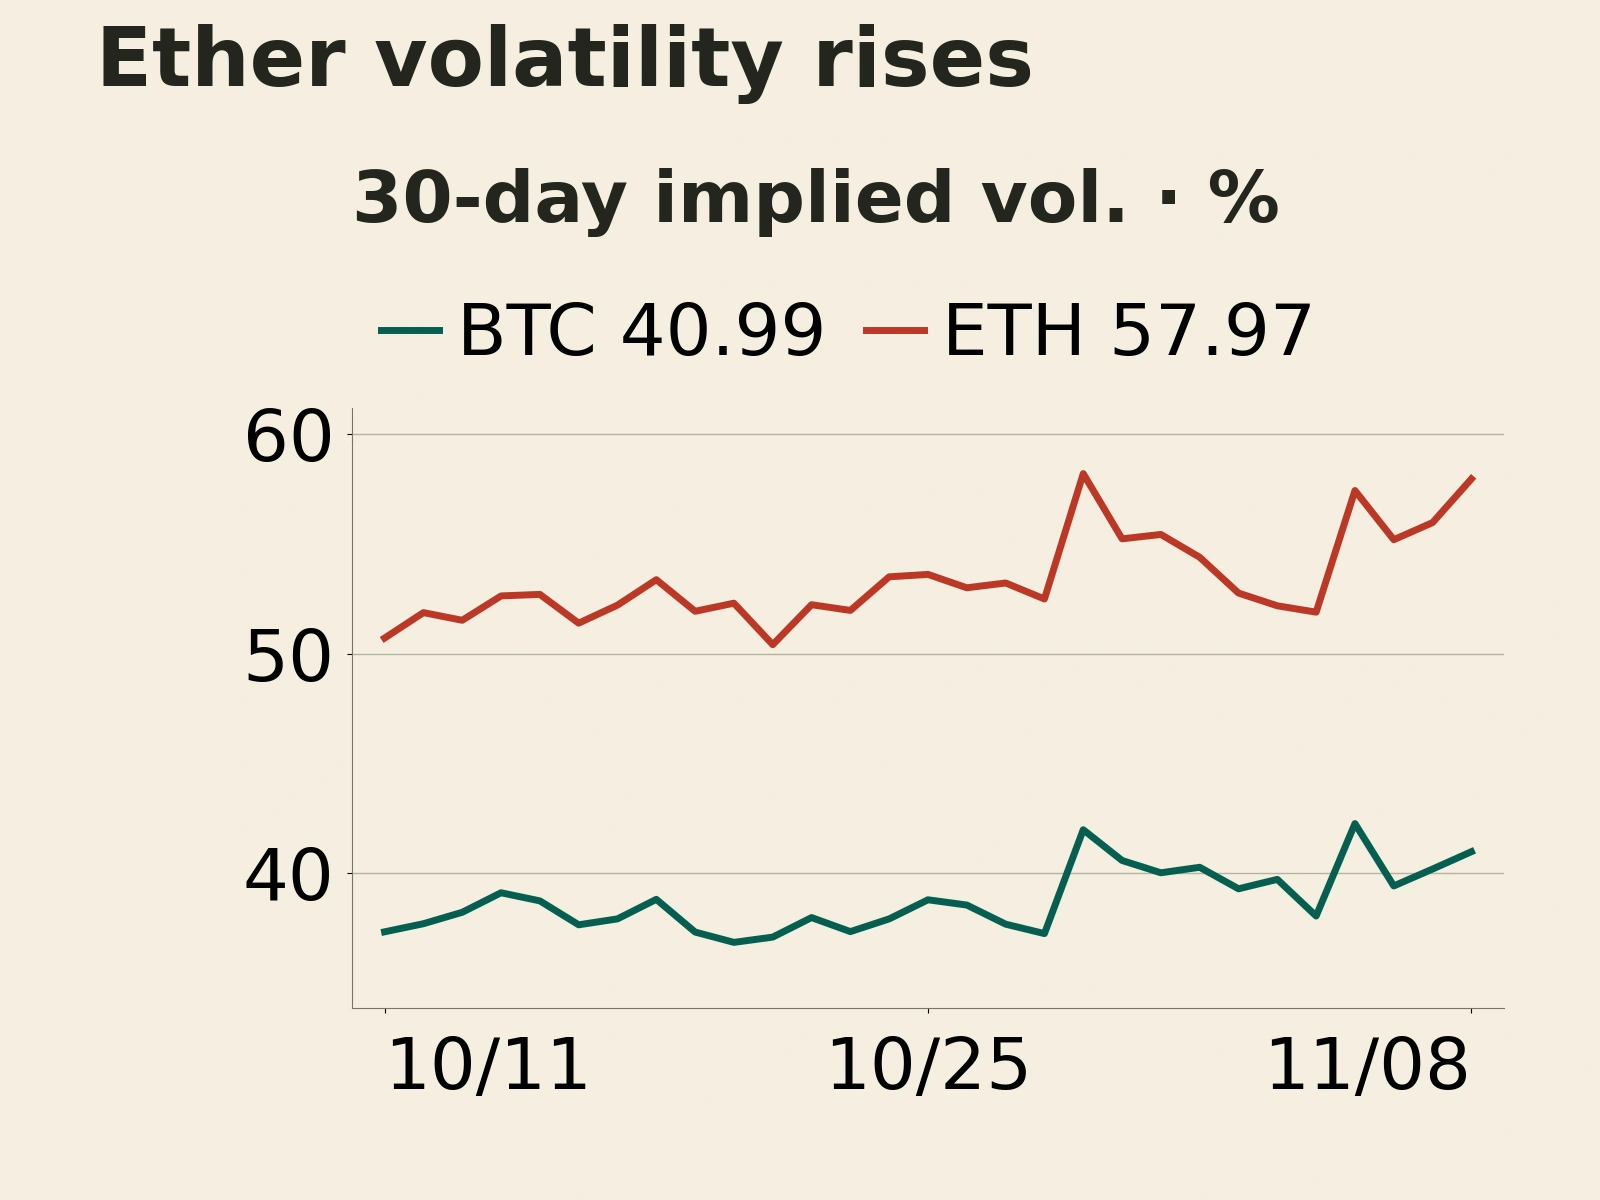
Options markets also priced in more volatility. On Deribit's DVOL index of 30-day annualized implied volatility, BTC rose from 40.28 to 40.99 and ETH from 54.40 to 57.97 between the November 1 and November 8 UTC daily closes. ETH dipped to 51.90 on Wednesday, rose to 57.44 on Thursday and climbed further to 57.97 by the weekend, above its level at the start of the week. DVOL reflects expectations for large moves in either direction. A rise means options imply a higher price for volatility without predicting which way the underlying asset will move.
Last week, investment allocations shrank while trading positions held up. Money left ETFs, stablecoin market capitalization declined and Binance perpetual open interest still edged higher. Holding leveraged Ether longs also became more expensive, and options priced in more Ether volatility. That combination leaves the market with limited capacity to absorb selling. The next things to watch are whether ETF inflows build across several sessions after the isolated rebound and whether stablecoin market capitalization stabilizes. If trading positions grow without fresh investment allocations, prices may remain sensitive to shifts in subscriptions, redemptions and risk appetite.
Click “Read the original” for the full article.