From November 2 to 8, 2026, on-chain trading continued to cool and business activity diverged further. Summing daily volume for the protocols DefiLlama tracks and classifies as decentralized exchanges (DEXs) puts the weekly total at $48.871 billion, down 10.32% from the previous full calendar week. Volume continued to grow on Base and Solana, and lending fees held up better than trading fees. The growth in user fees at lending protocols, however, did not translate into higher protocol revenue.
Base weekly volume rises 16.23% as Ethereum mainnet falls 31.05%
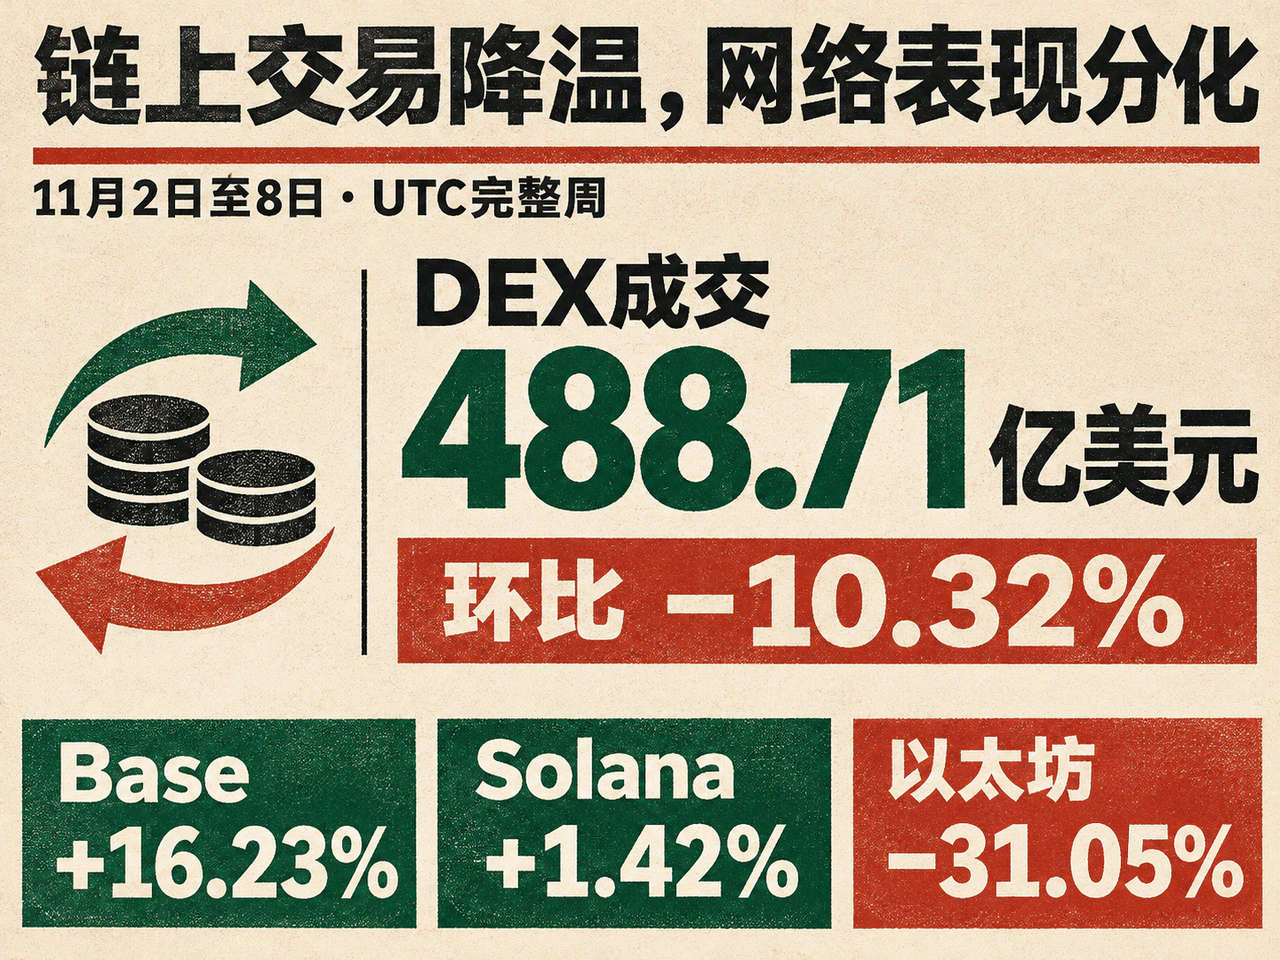
Ethereum mainnet recorded $11.498 billion in weekly DEX volume, down 31.05% week over week. Solana rose 1.42% to $10.765 billion, while BNB Chain fell 8.88% to $5.741 billion. Ethereum scaling networks also diverged. Base rose 16.23% to $7.910 billion, while Arbitrum slipped 0.62% to $1.361 billion. Low execution costs make trading easier, but the applications on each network and how they organize liquidity still determine whether activity can grow.
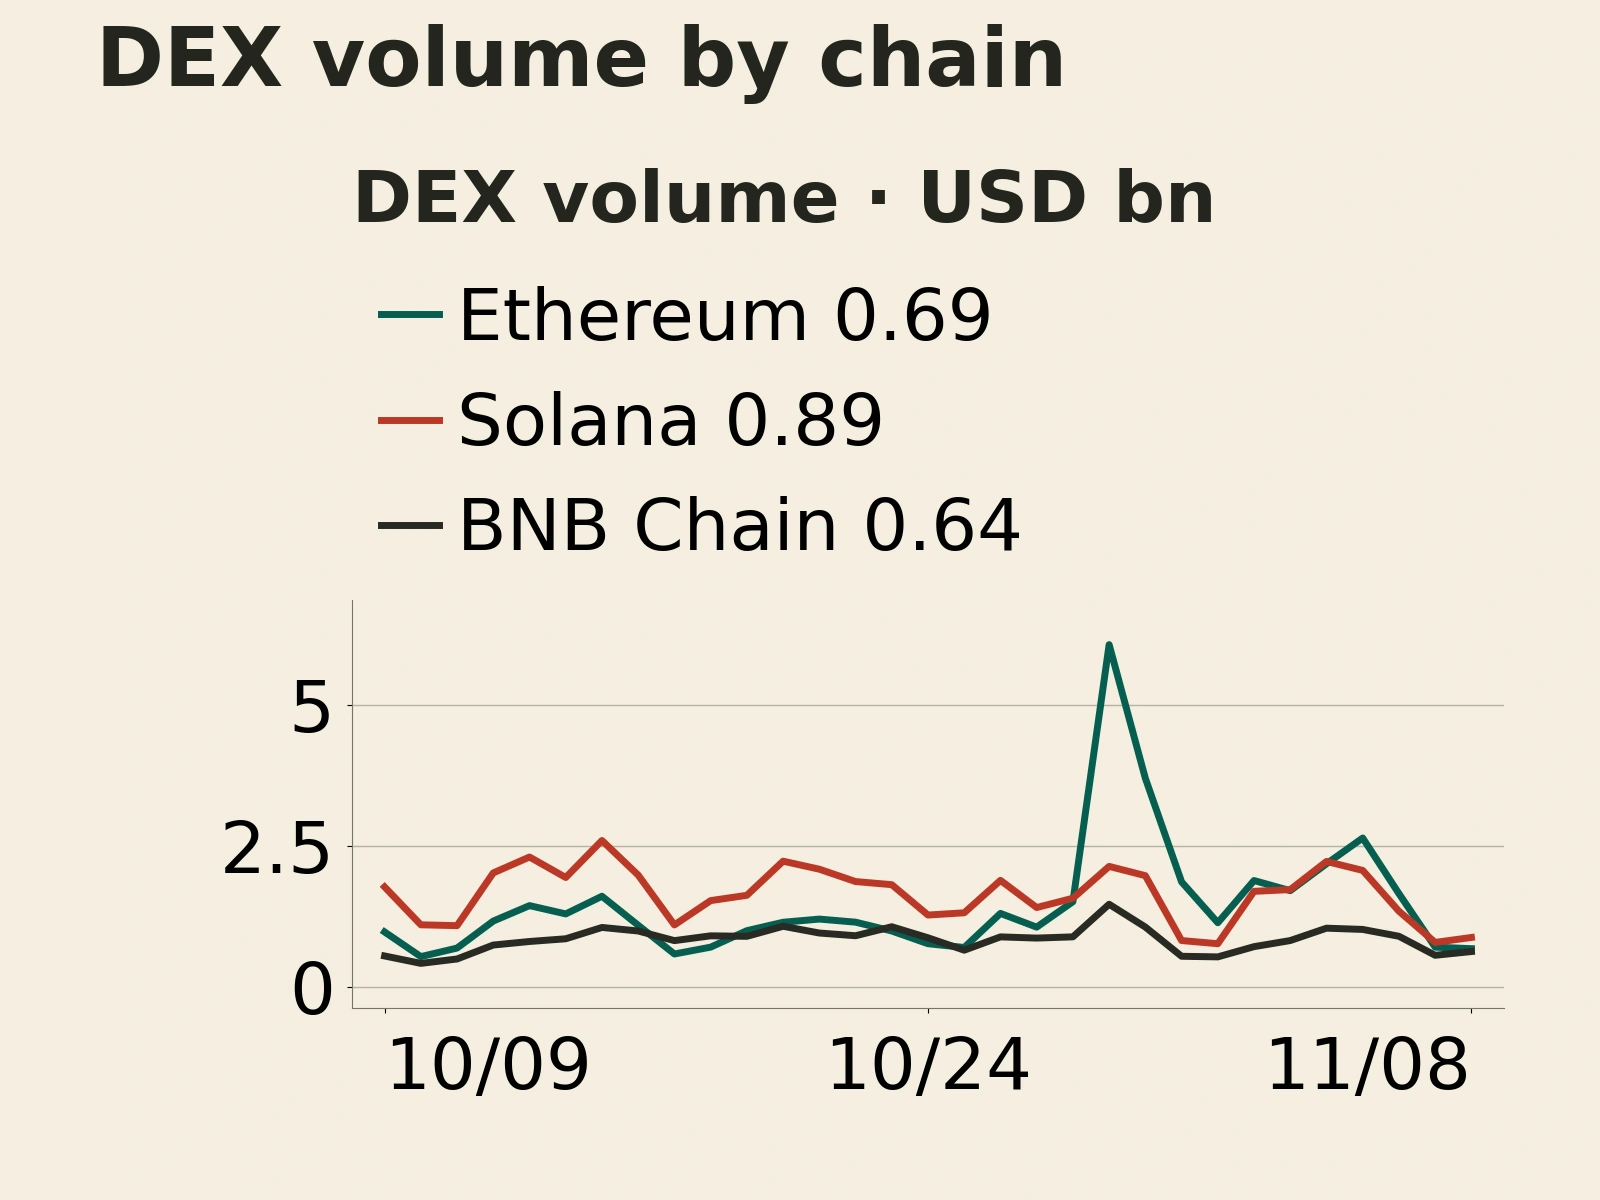
These figures measure trading volume. A rise in a chain's share shows that trading activity has become more concentrated there. Assessing whether capital moved across chains also requires looking at asset balances and bridge flows. Trading turnover and changes in asset prices can also affect volume measured in dollars.
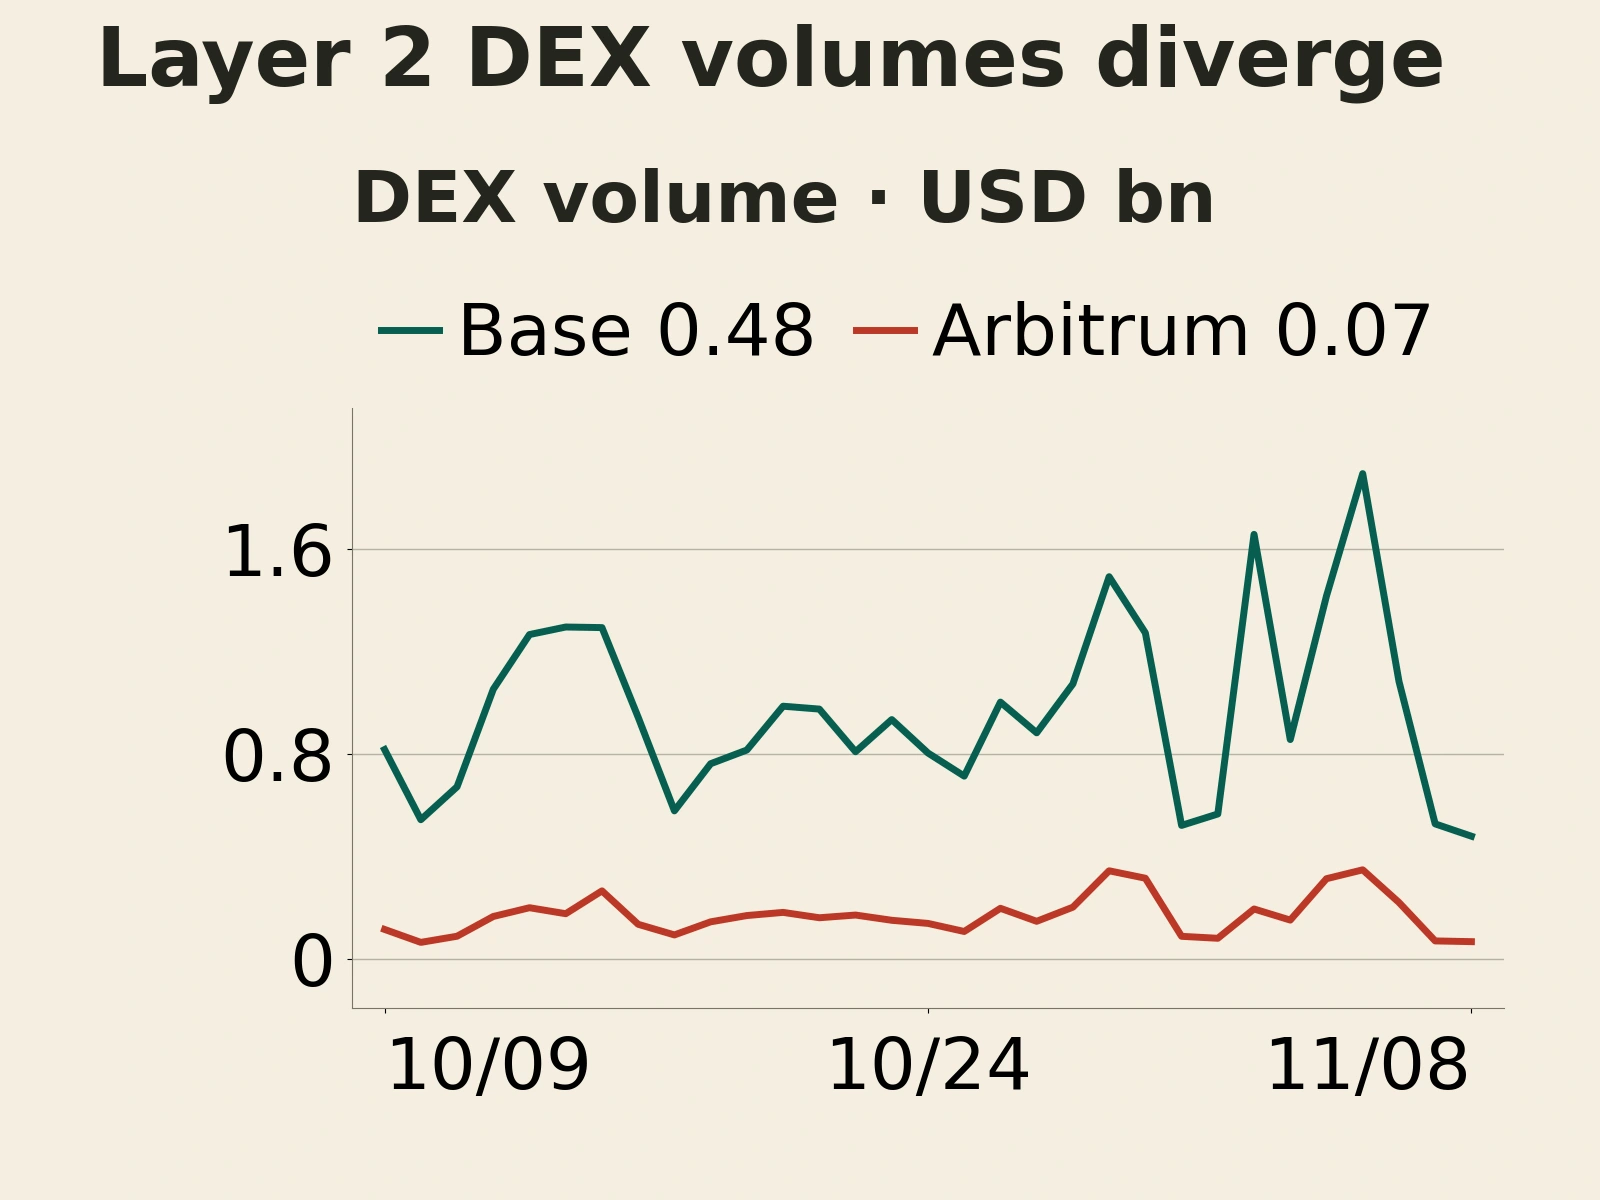
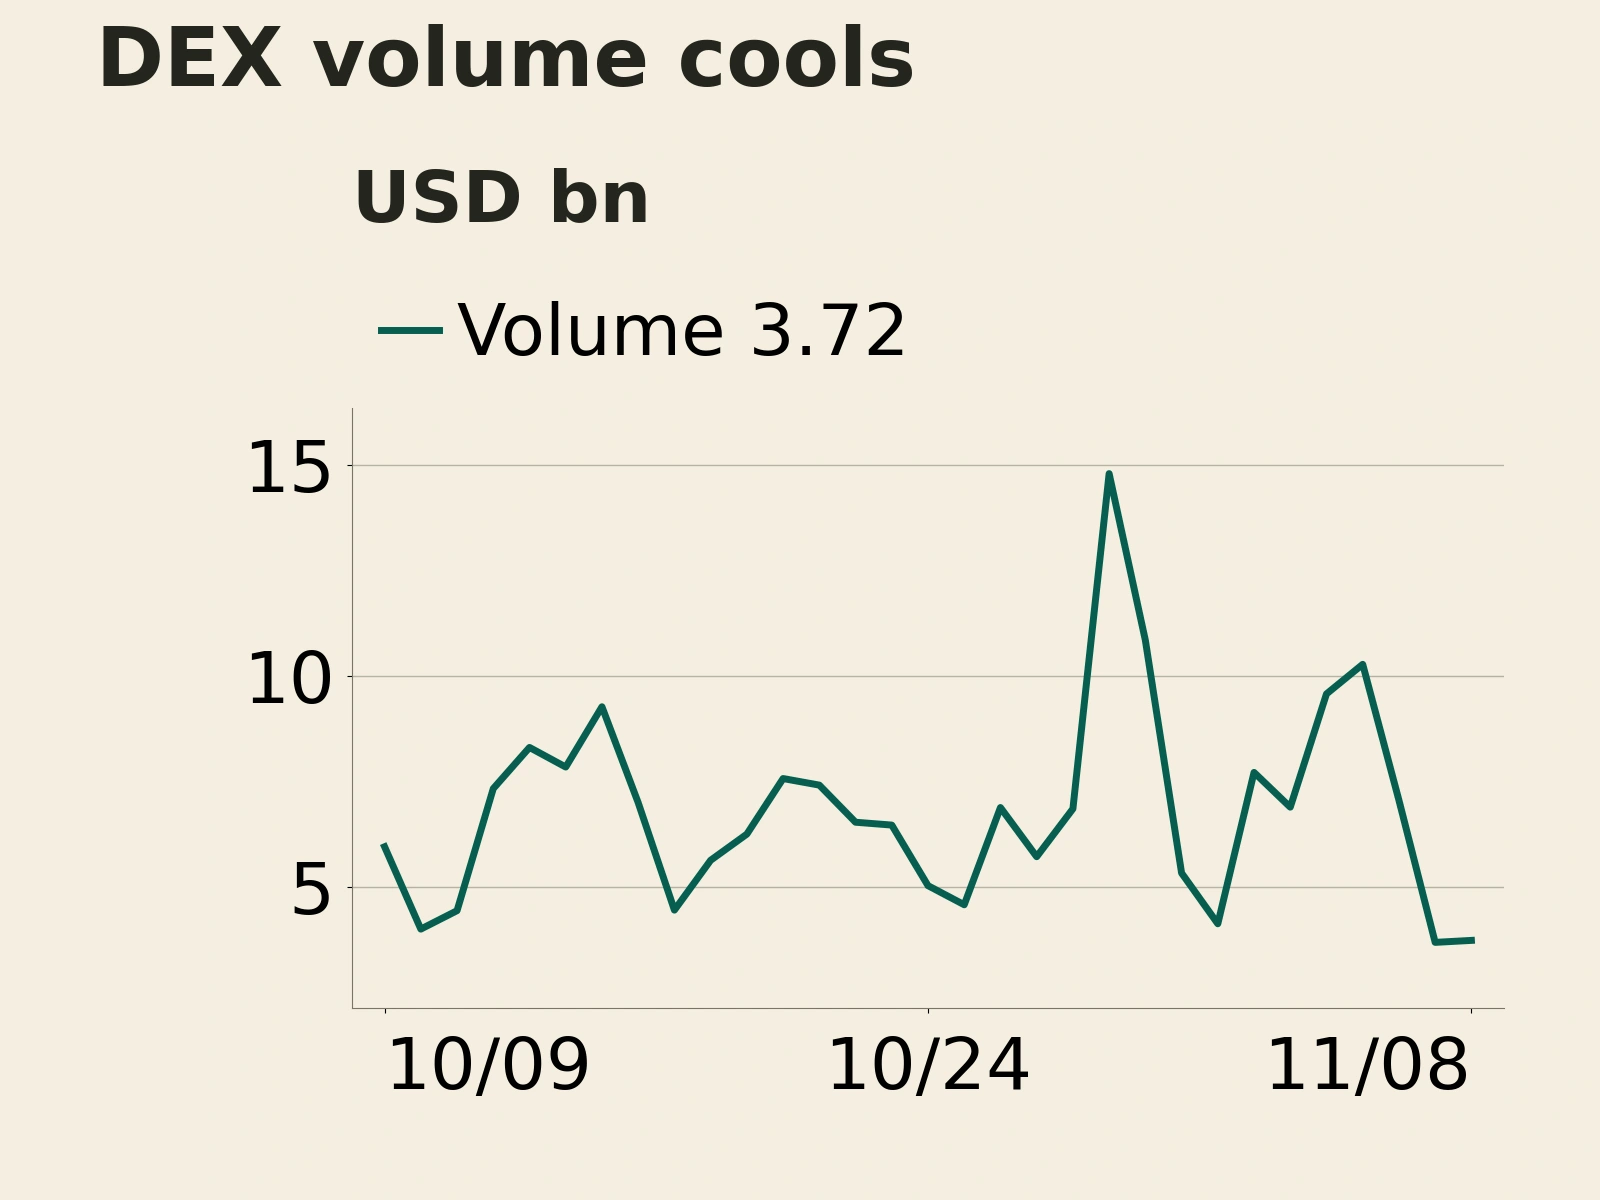
A longer window puts the week's gains and losses in context. Over the latest 30 days, total DEX volume fell 18.42% from the preceding 30 days. Solana fell 30.15%, Base was broadly flat, and Ethereum still gained 21.57%. Ethereum's weekly decline came against a backdrop of higher 30-day volume, while Solana's modest weekly rebound has yet to reverse its 30-day contraction. Average daily DEX volume across the sector was $6.982 billion this week, below the 90-day average of $7.822 billion. The slowdown extends beyond a single week.
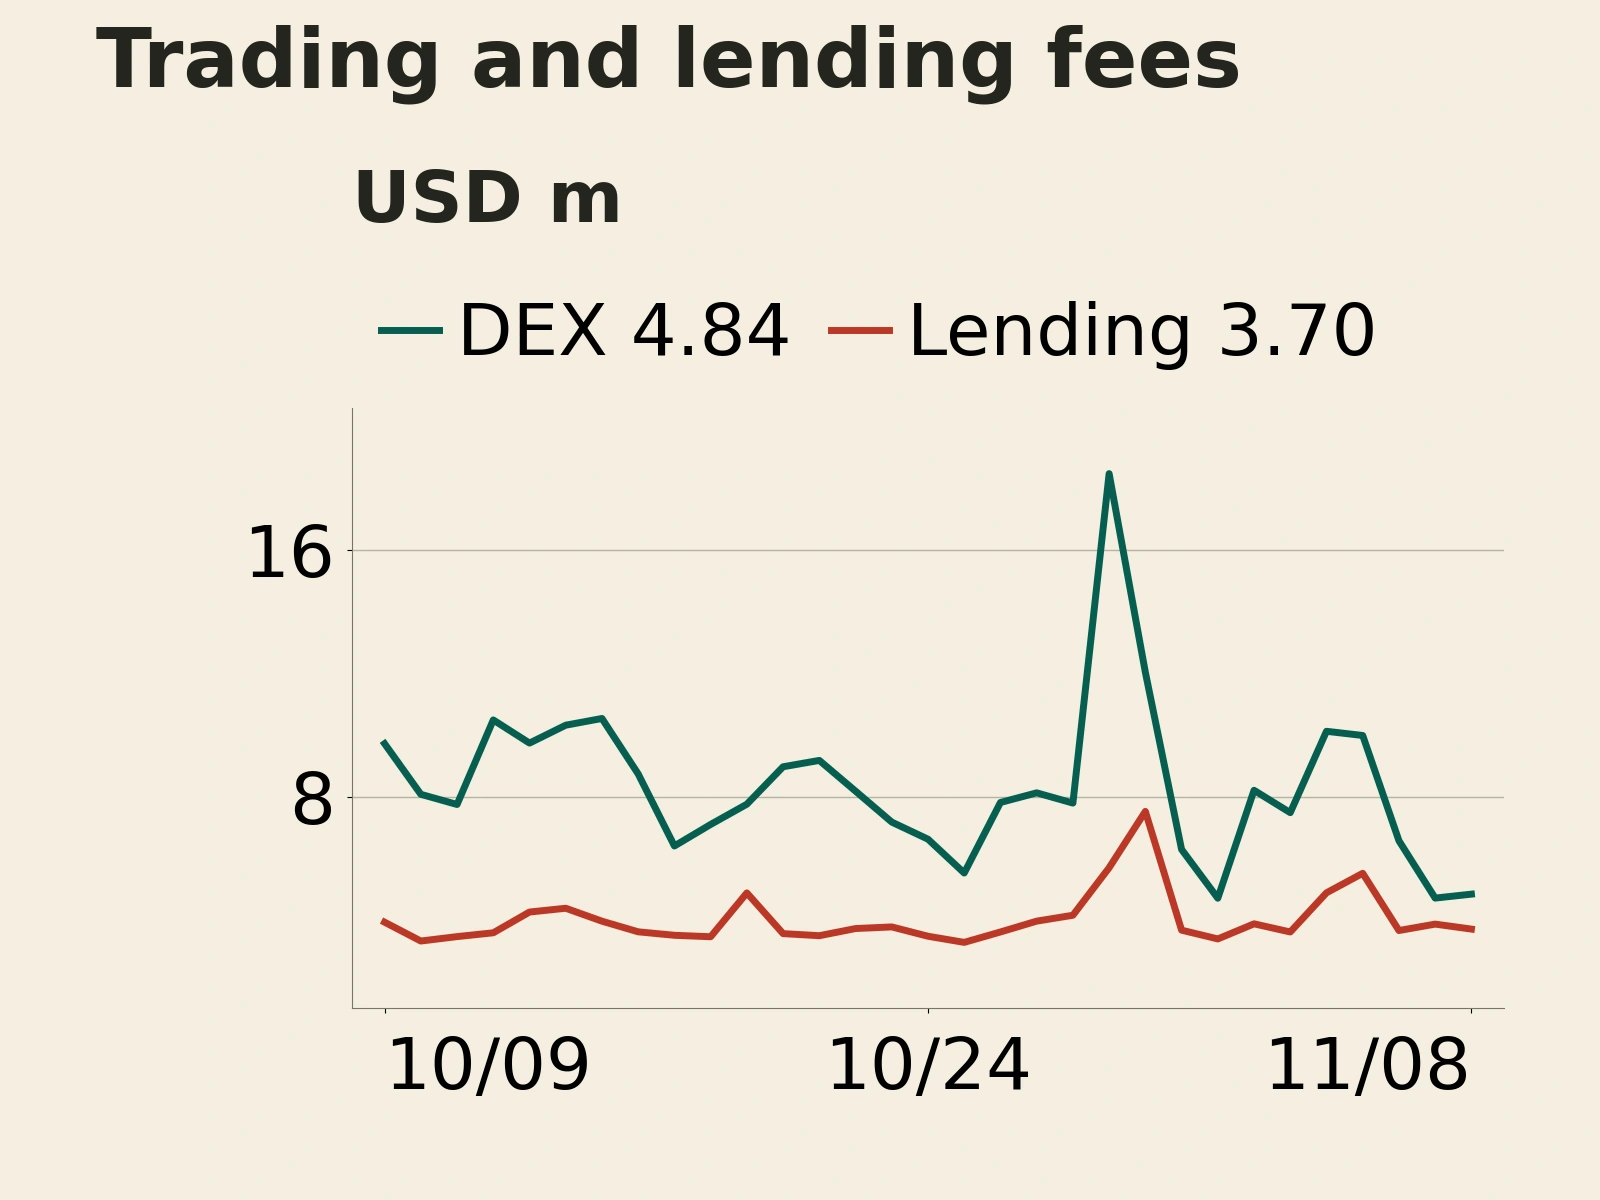
Fees contracted more sharply. DEX users paid $51.9391 million in fees this week, down 20.43% week over week. Fees over the latest 30 days fell 40.67% from the previous 30 days, a steeper drop than in trading volume over the same period. The mix of trades, fee structures and protocol coverage all affect this gap. Even if trading volume recovers to its previous level, fees may recover by a different proportion.
Lending followed a different pattern. Users paid lending protocols $29.1106 million in fees this week, down 9.03% week over week, while fees over the latest 30 days rose 5.06% from the previous 30 days. Daily fees averaged $4.1587 million this week, above the 90-day daily average of $3.7767 million. Lending fees depend mainly on outstanding loans, interest rates and how long borrowers use the funds. Existing loans continue to accrue interest when the appetite to trade weakens, so lending income follows a different pattern from income earned by matching trades.
Lending user fees rise 5.06% over 30 days while protocol revenue falls 2.67%
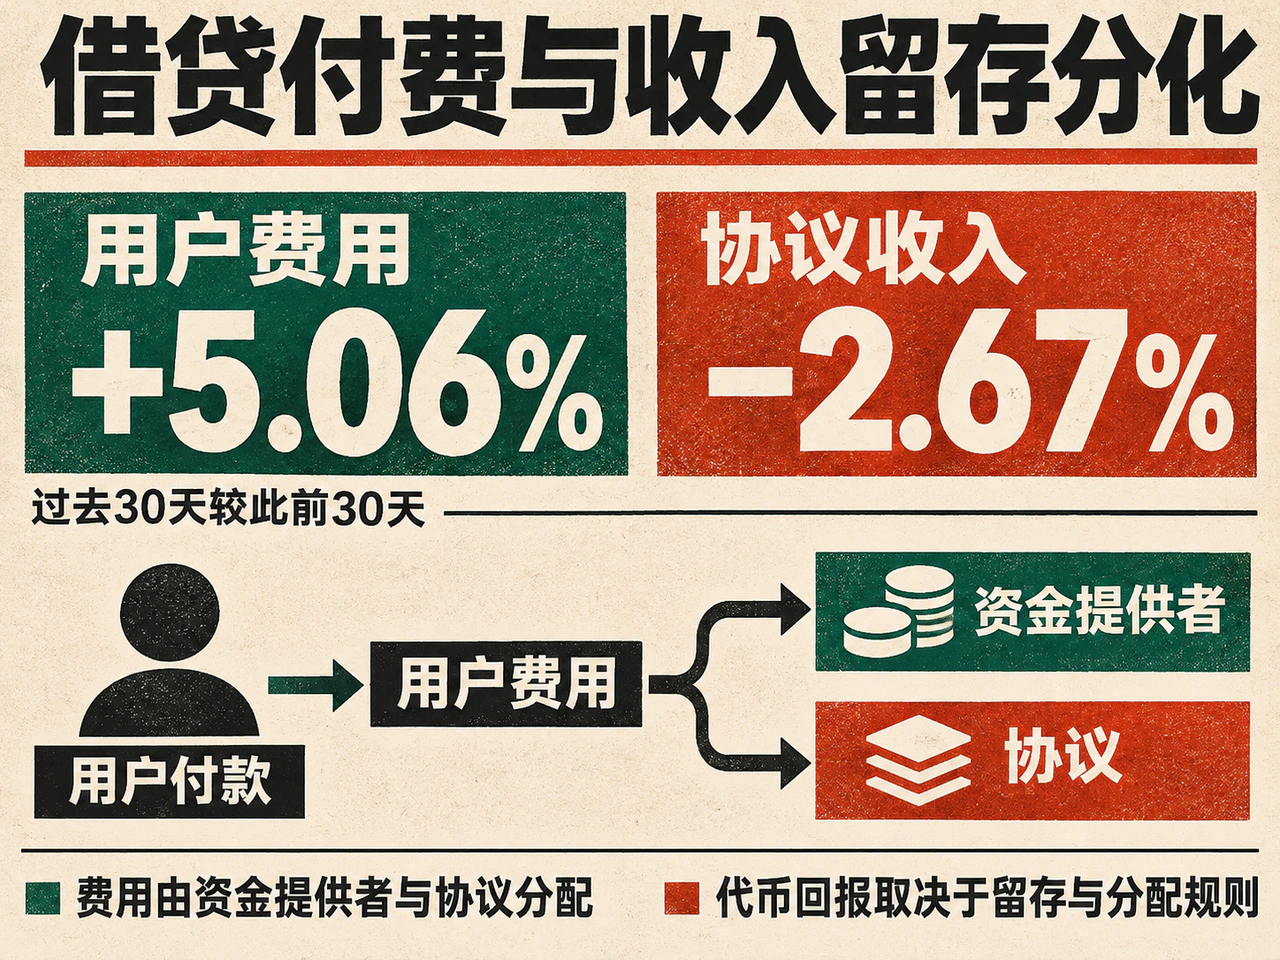
DefiLlama tracks user fees and protocol revenue separately. User fees are the total fees users pay, including amounts that go to liquidity providers and other participants. Protocol revenue is what the protocol itself retains, typically accruing to its treasury, team or tokenholders.
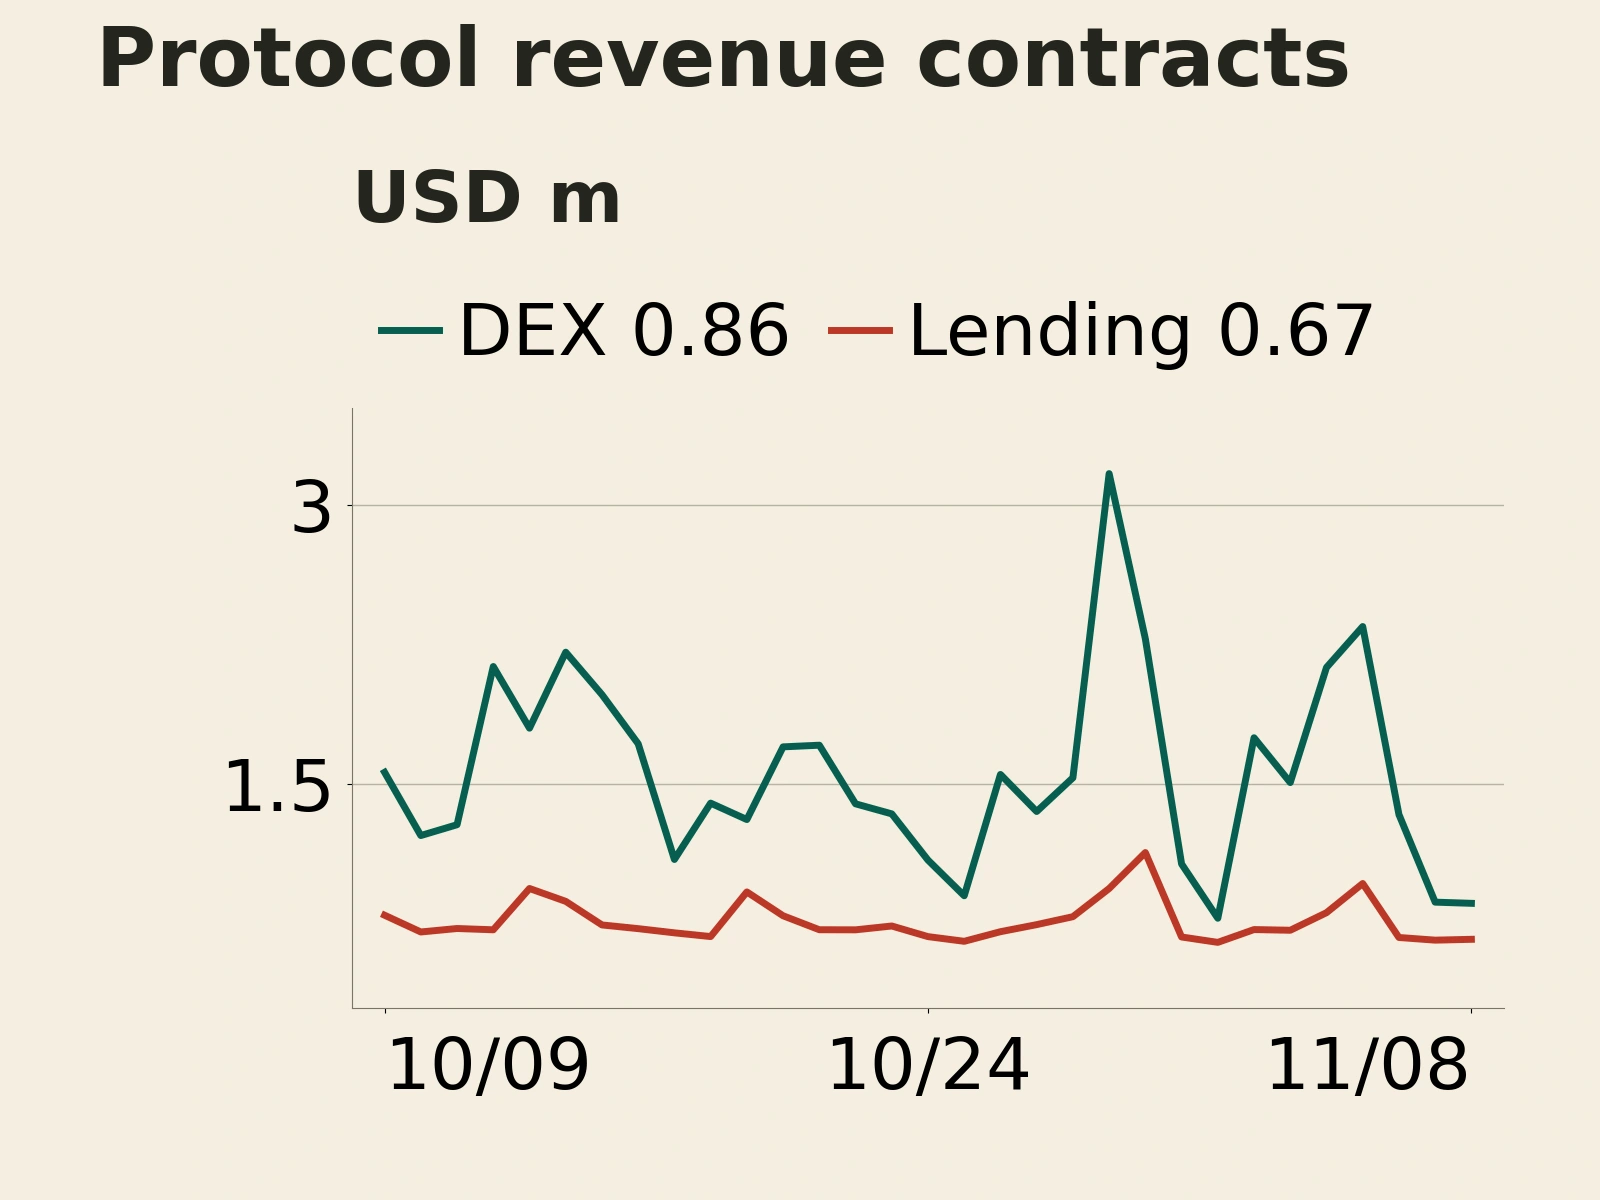
Among the protocols DefiLlama tracks, lending user fees rose 5.06% over the latest 30 days, while lending protocol revenue fell 2.67%. Lending protocol revenue totaled $5.2062 million this week, down 7.59% week over week. The figures show that demand for fee-generating lending activity held up relatively well even as retained protocol revenue contracted. A substantial share of borrowing interest goes to capital providers. How much the protocol actually keeps also depends on the share allocated to reserves, market structure and the mix of activity.
DEX fees and revenue also declined at different rates. Weekly DEX protocol revenue fell 8.07% to $10.7961 million, a smaller decline than the 20.43% fall in user fees. Over the latest 30 days, protocol revenue fell 31.50%, again by less than fees. The fee and revenue series cover different sets of observable protocols, and platforms' shares of revenue are changing. The gap alone therefore provides insufficient evidence of a sector-wide increase in take rates. A contraction in trading affects liquidity providers, protocols and tokenholders to different degrees.
Beyond trading and lending, payments and asset tokenization continue to broaden the uses of on-chain settlement. In its October recap published November 6, the Solana Foundation said Fiserv's digital asset platform had gone live, with the first deployment at the Bank of North Dakota and transactions settling on Solana. The recap also said Western Union's USDPT was available to buy and sell on Bitso in Mexico. The network breakdown on RWA.xyz spans Ethereum, BNB Chain, Solana, Stellar, Arbitrum and Base, reflecting how tokenized real-world assets have spread across networks. These businesses broaden the uses of on-chain settlement. Sustained settlement activity, asset retention and fees will help show how these businesses perform commercially.
How protocol revenue translates into token value also depends on how it is distributed. Revenue held in a treasury, invested in research and development or used for subsidies accrues differently from cash flows used for buybacks, token burns or direct distributions to tokenholders. Recurring fees offer a clearer measure of sustainable commercial returns after accounting for incentives and operating expenses. User counts, total value locked and trading volume describe the scale of an activity. Who ultimately benefits depends on what the protocol actually retains and how it distributes those proceeds.
Security and governance also affect whether those returns can be realized. Reporting on November 3 cited an earlier emergency action by Arbitrum. On October 30, the Security Council approved a temporary upgrade that froze assets linked to the "Binance incident." Any subsequent transfer requires a governance vote. The official explanation treats emergency control and the release of assets as separate steps. For networks that handle lending and real-world assets, settlement speed, authority to intervene in a crisis and the ability to move assets all factor into the cost of using the network.
The week's clearest development was the divergence between trading demand, outstanding credit and protocol revenue. Trading volume continued to shrink, while lending provided a relatively stable base for fees without a corresponding improvement in retained revenue. Payments and real-world assets expanded the scope for future demand. Whether these activities generate lasting returns ultimately depends on sustained usage, what protocols actually retain and whether the rules for distributing proceeds are clear and enforceable.
Click through to the original article for details.