Over the seven full trading days from November 2 to 8, 2026, Bitcoin fell 4.47% to close at 74,851.44 USDT and Ether fell 6.50% to close at 2,127.46 USDT, based on Binance spot prices quoted in USDT and measured on a UTC daily basis. The two rose 3.94% and 6.59%, respectively, on Wednesday, fell with technology stocks on Thursday and moved lower again on Sunday. The post-election rebound failed to hold.
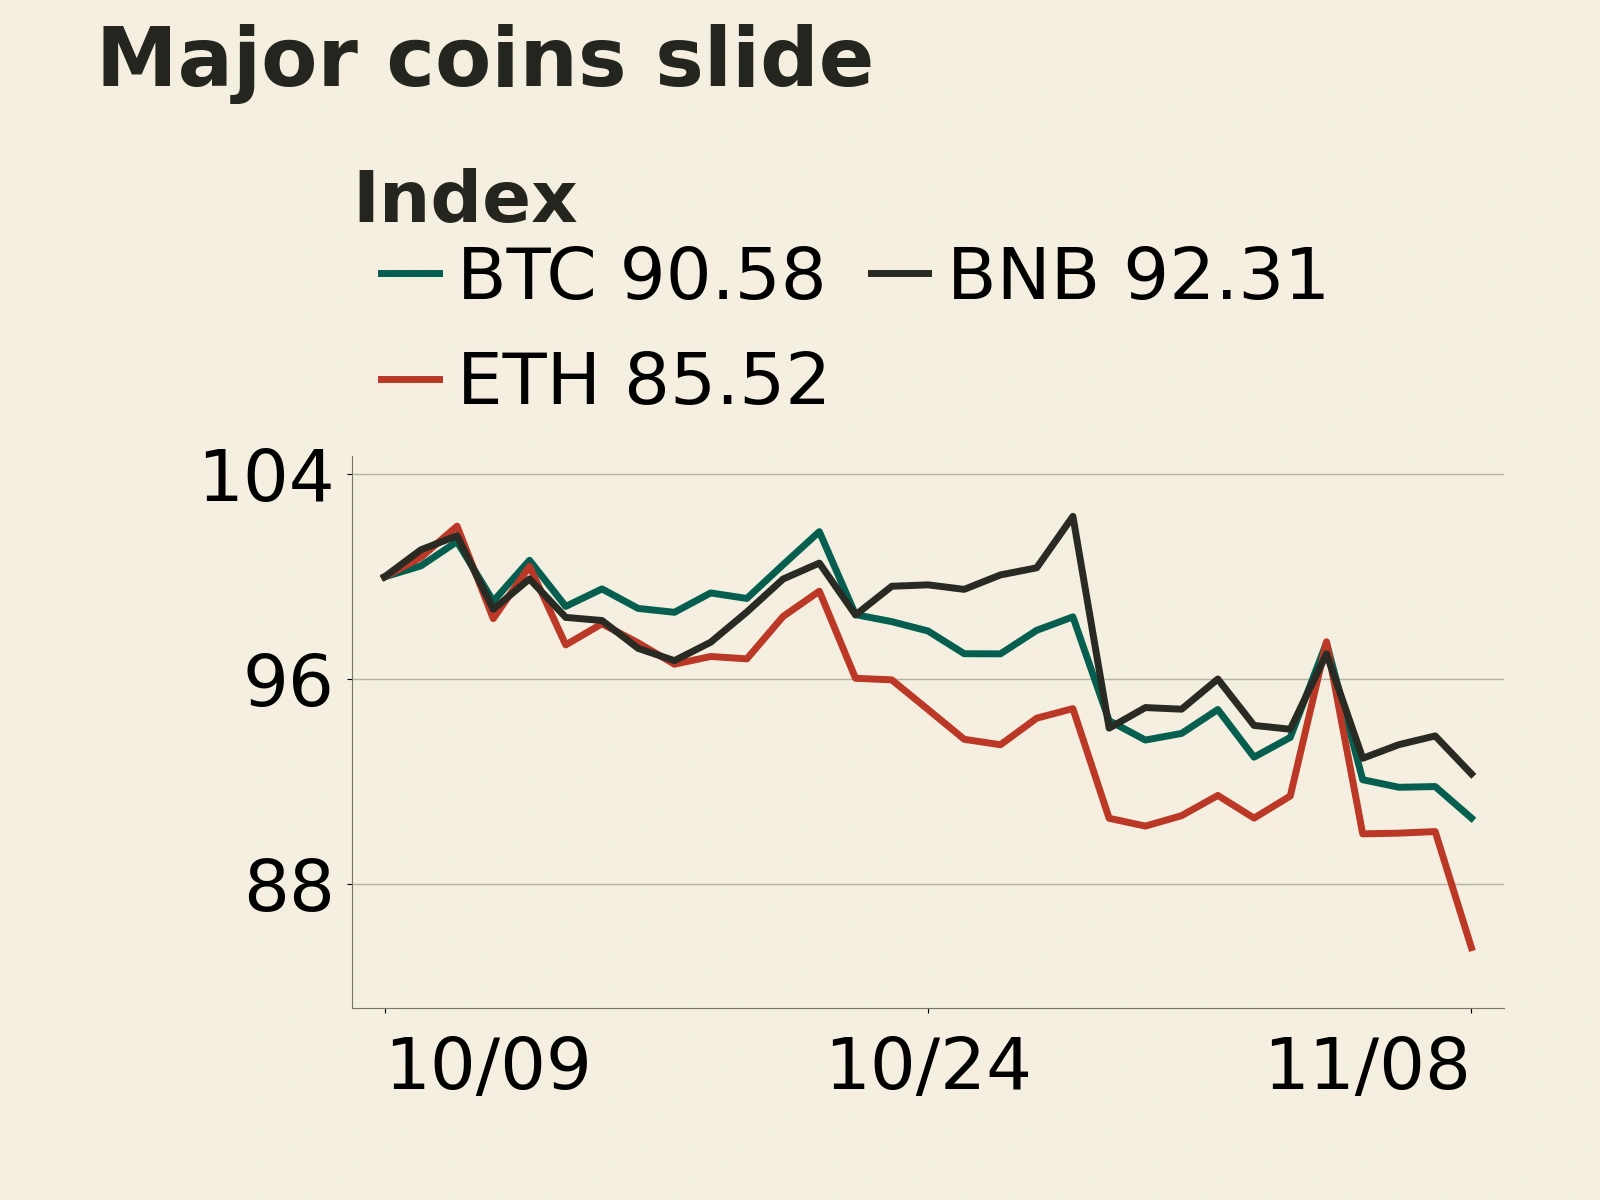
The U.S. midterm election results, the fallout from a security incident at Binance and doubts about returns on artificial intelligence (AI) investment all shaped the week’s trading. Prices briefly recovered once the election outcome became clear, but sustained buying from investors allocating capital failed to follow. Regulatory concerns resurfaced over the weekend, when demand was already weak.
Bitcoin fell 5.49% on Thursday after Wednesday’s rebound

On November 4, after Reuters reported that Democrats had won control of both chambers of Congress, crypto assets initially fell before rebounding alongside U.S. equity futures. Binance daily data show that Bitcoin touched an intraday high of 81,196.01 USDT and closed at 80,504.01 USDT, while Ether closed at 2,424.61 USDT. The legislative uncertainty created by the election outcome did little to impede the broader recovery in risk assets that day.
The next day, Bitcoin fell 5.49% and Ether fell 7.70%, both closing below their levels before Wednesday’s rebound. Technology stocks also fell sharply. The Motley Fool’s coverage that day linked the sell-off to doubts over whether heavy spending on AI infrastructure would pay off. Crypto assets have no direct claim on technology companies’ earnings, but they compete with volatile equities for some of the same risk capital. When equity investors cut their risk exposure, portfolio rebalancing and the unwinding of leveraged positions can transmit the pressure to crypto prices.
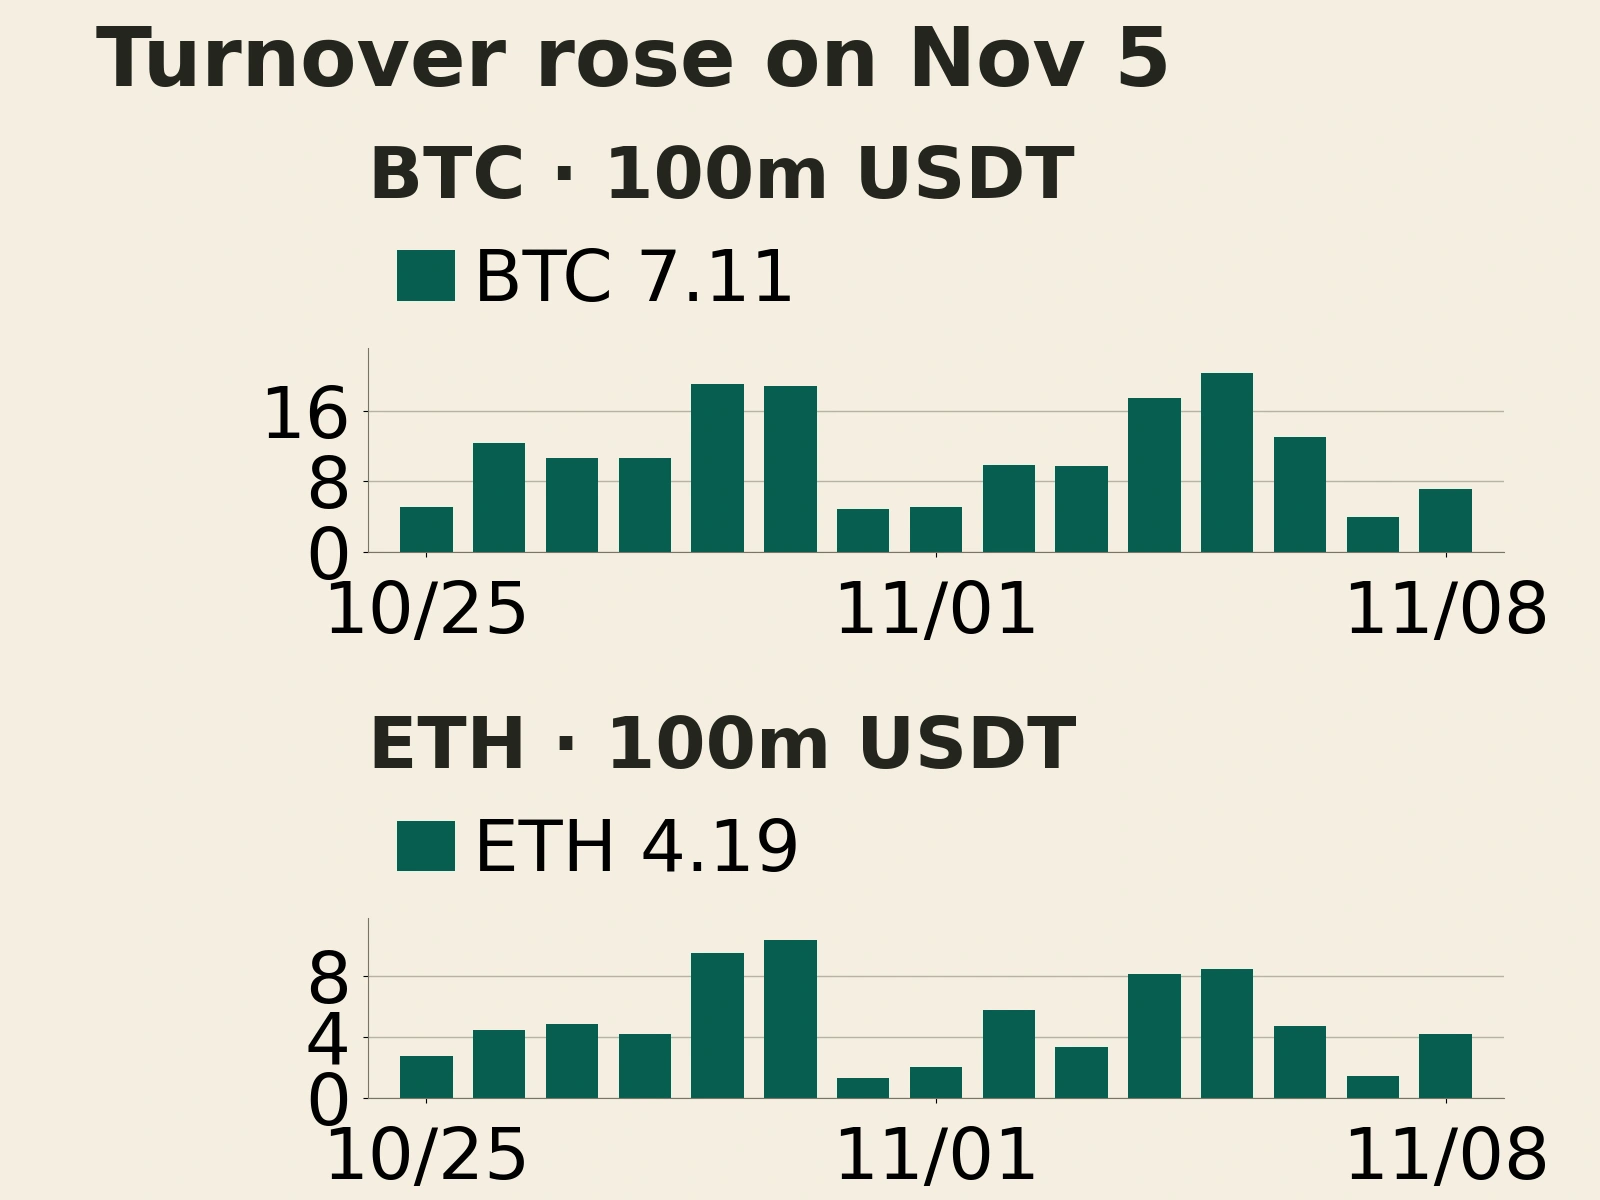
Trading picked up as prices fell. Bitcoin spot turnover on Binance rose to 2.025 billion USDT on Thursday from 1.747 billion USDT on Wednesday. Ether turnover rose from 809 million to 844 million USDT. Bitcoin turnover for the full week was 8.137 billion USDT, broadly in line with 8.142 billion USDT the prior week. Ether turnover was 3.5997 billion USDT, slightly below the prior week’s 3.6677 billion USDT. Overall trading activity held up, with investors remaining active as prices repriced lower on Thursday.
Traders differed in their interpretation of the sell-off. On November 6, crypto commentator The Wolf of All Streets discussed in The Wolf Den a Wintermute trader’s assessment that crypto assets had held up relatively well. He drew a distinction between falling less and providing protection as a haven. Bitcoin was more resilient than some other volatile assets that week, but the Wednesday rally and Thursday reversal show it was still driven by the same shifts in risk appetite.
The U.S. jobs report released on November 6 added another constraint. Nonfarm payrolls rose by 165,000 in October, the unemployment rate was 4.1%, and payroll gains for August and September were revised up by a combined 84,000. The figures gave little support to trades premised on a rapid deterioration in employment leading to easier monetary conditions. The report came out after Thursday’s sell-off, so it mattered mainly for the macroeconomic backdrop to any subsequent rebound.
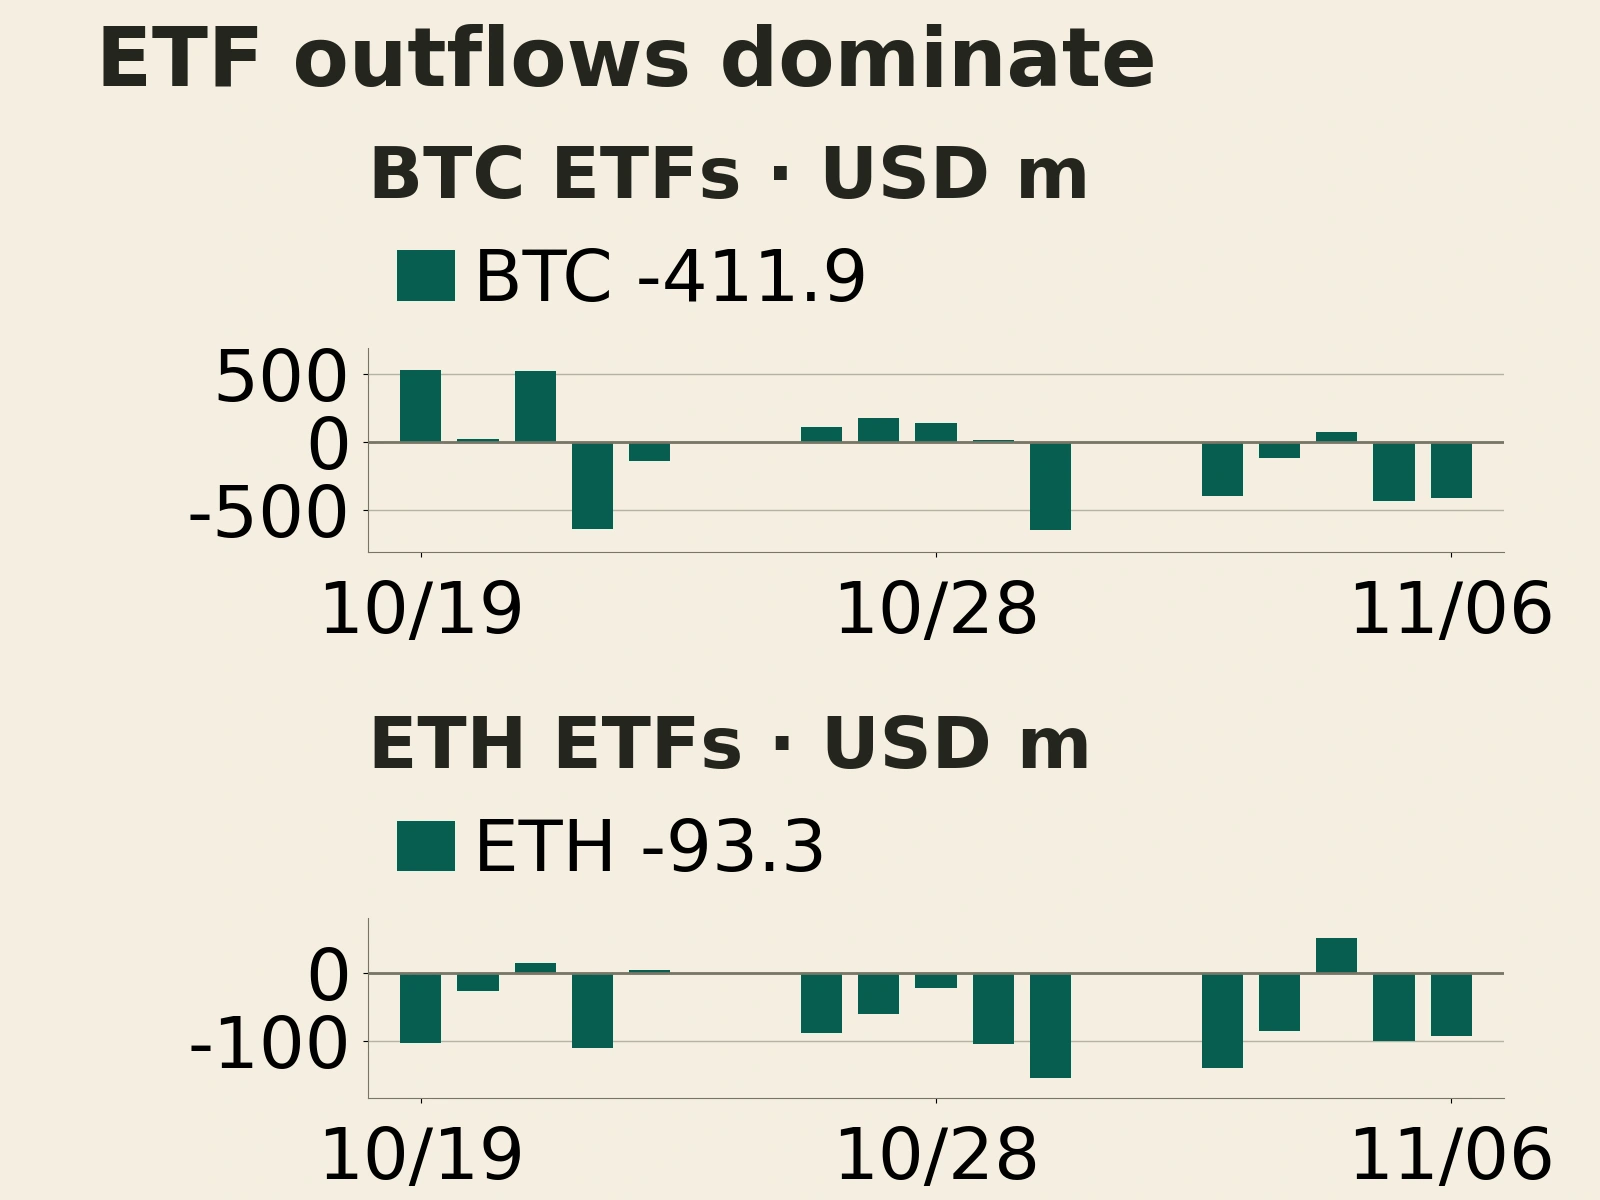
Pressure on Binance eased, but ETFs still saw about $1.28 billion in net weekly outflows

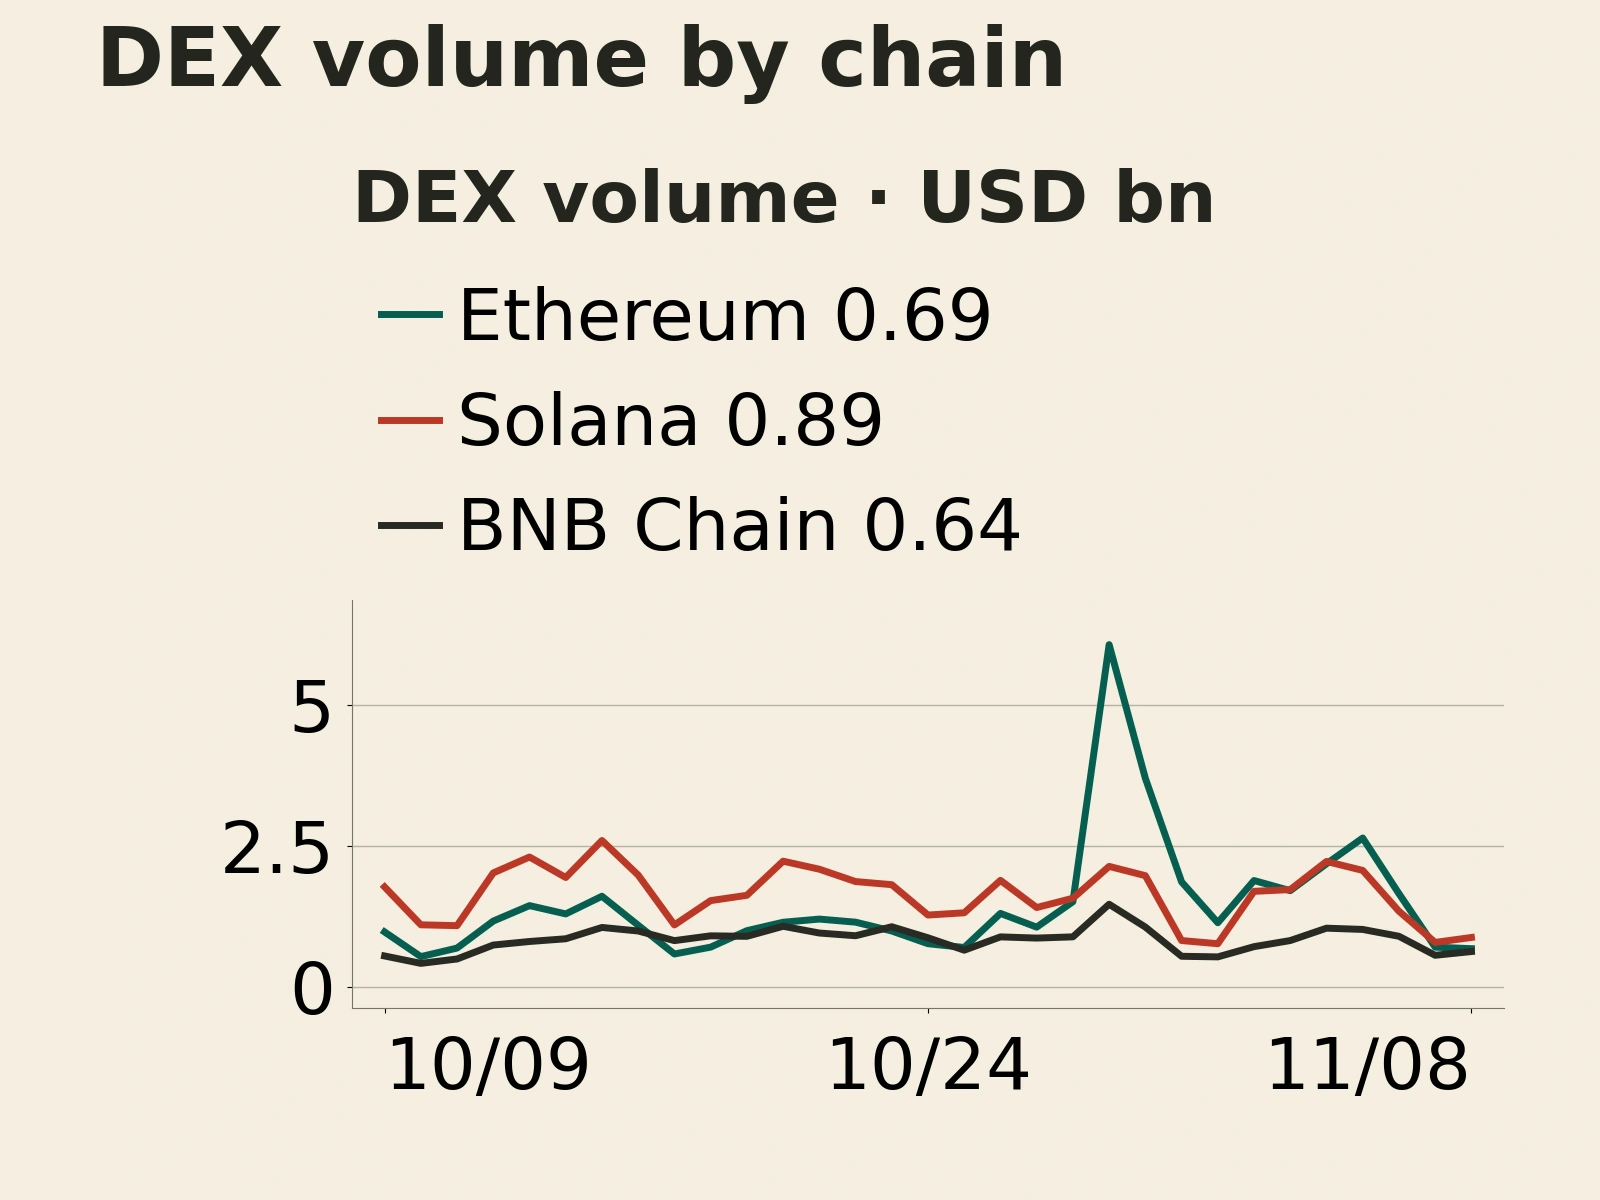
Pressure from the Binance security incident persisted through the week, although exchange flows changed direction. In research published on November 4, CryptoQuant said substantial assets had left Binance after the exchange resumed withdrawals. By November 3, the ETH, USDT on Ethereum and USDC flows it tracks had turned positive again. That shift suggested withdrawal pressure at the exchange was beginning to ease. Flows through investment vehicles offered a separate measure of whether buyers were returning across the market.
Wednesday’s rebound was consistent with an easing of the most acute concerns about liquidity at Binance. Slower outflows from a single exchange reduced pressure there, while fresh demand from investors allocating capital failed to materialize. On November 7, The Block cited SoSoValue data showing about $1.28 billion in net outflows from U.S. spot Bitcoin ETFs for the week, with net inflows on Wednesday alone. The buying that supported the rebound failed to carry through to the next two trading days.
Sunday’s price action showed that markets were still digesting the election’s implications after the results came in. Reuters reported on the evening of November 8 that renewed selling was linked to investor concerns that Democratic control of Congress could lead to tighter crypto regulation. The report pointed to shifting expectations for future rules and legislative progress. At that point, new restrictions had yet to take effect. Bitcoin fell 1.34% that day, while Ether fell a much steeper 5.03%.
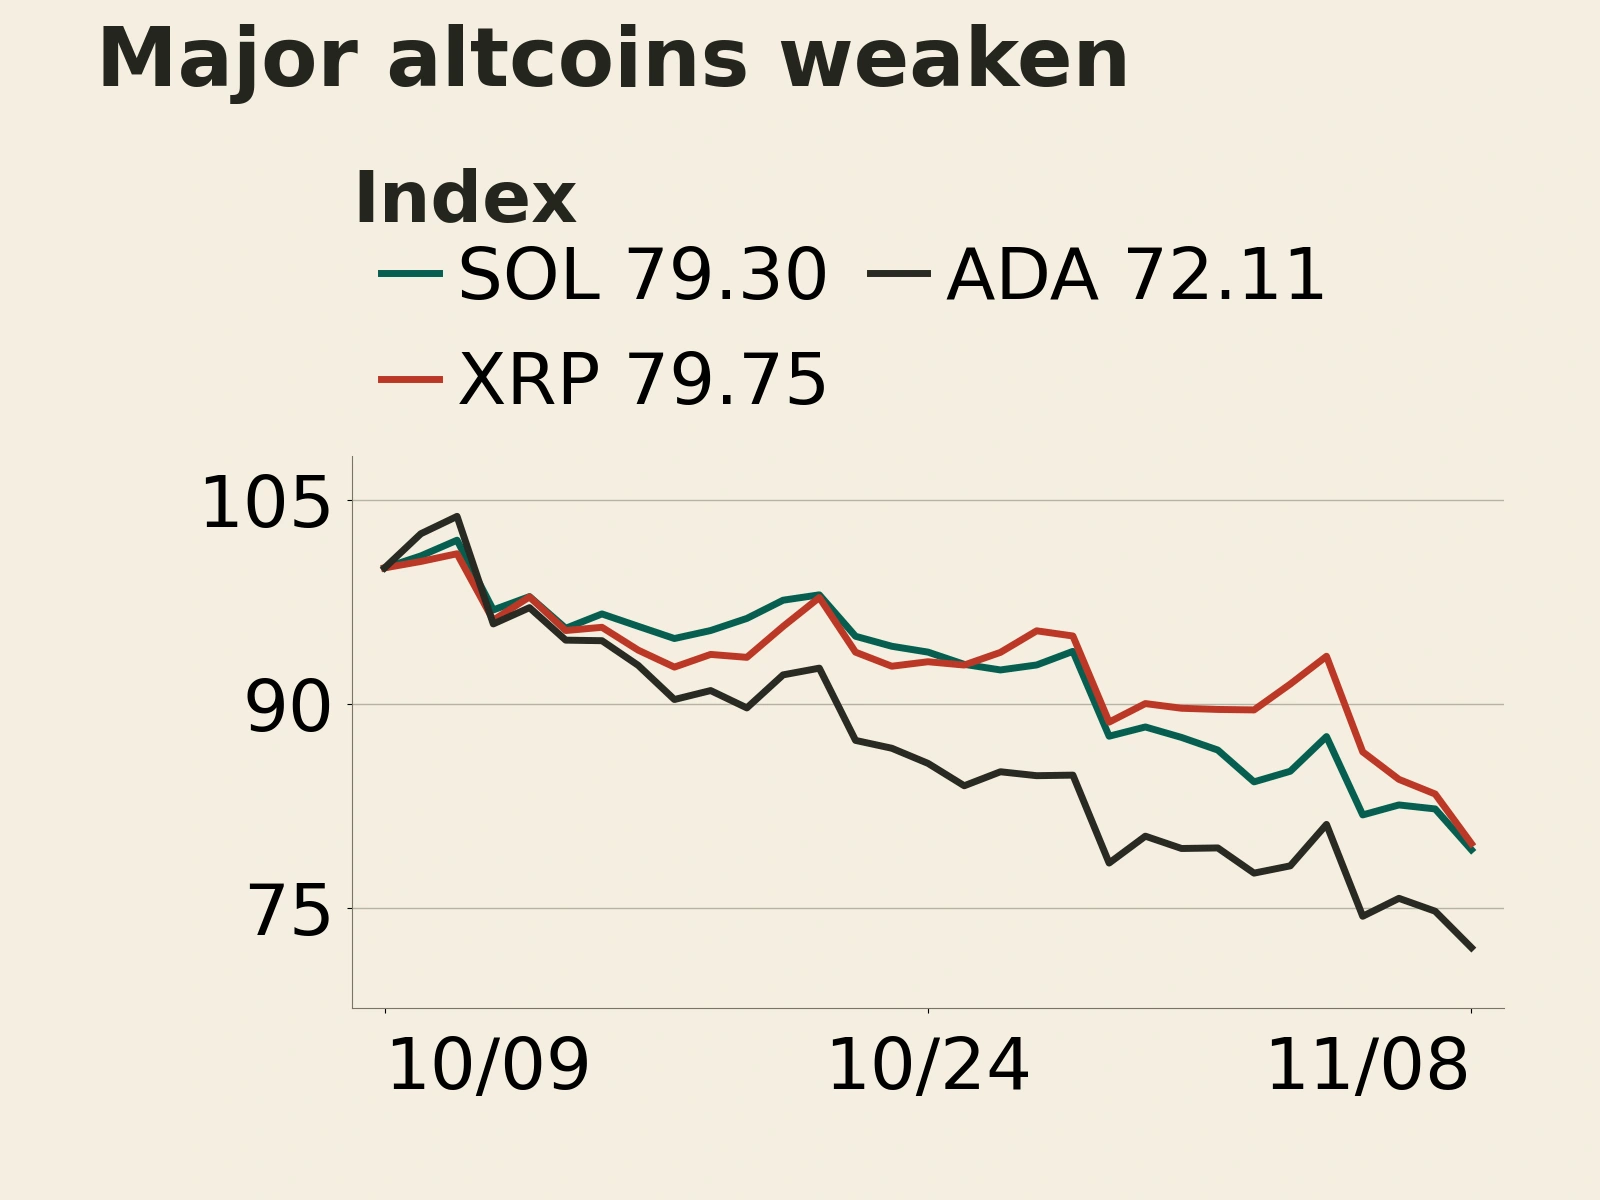
The divergence also appeared in the fixed sample of ten highly liquid Binance spot pairs that exclude stablecoins and wrapped tokens. All ten fell that week. BNB declined 3.86%, Bitcoin 4.47% and Ether 6.50%. SOL fell 8.45%, DOGE, LINK, AVAX and SUI fell between roughly 8.6% and 8.8%, ADA fell 9.22%, and XRP fell 10.99%. Losses were deeper outside the leading coins in the sample.
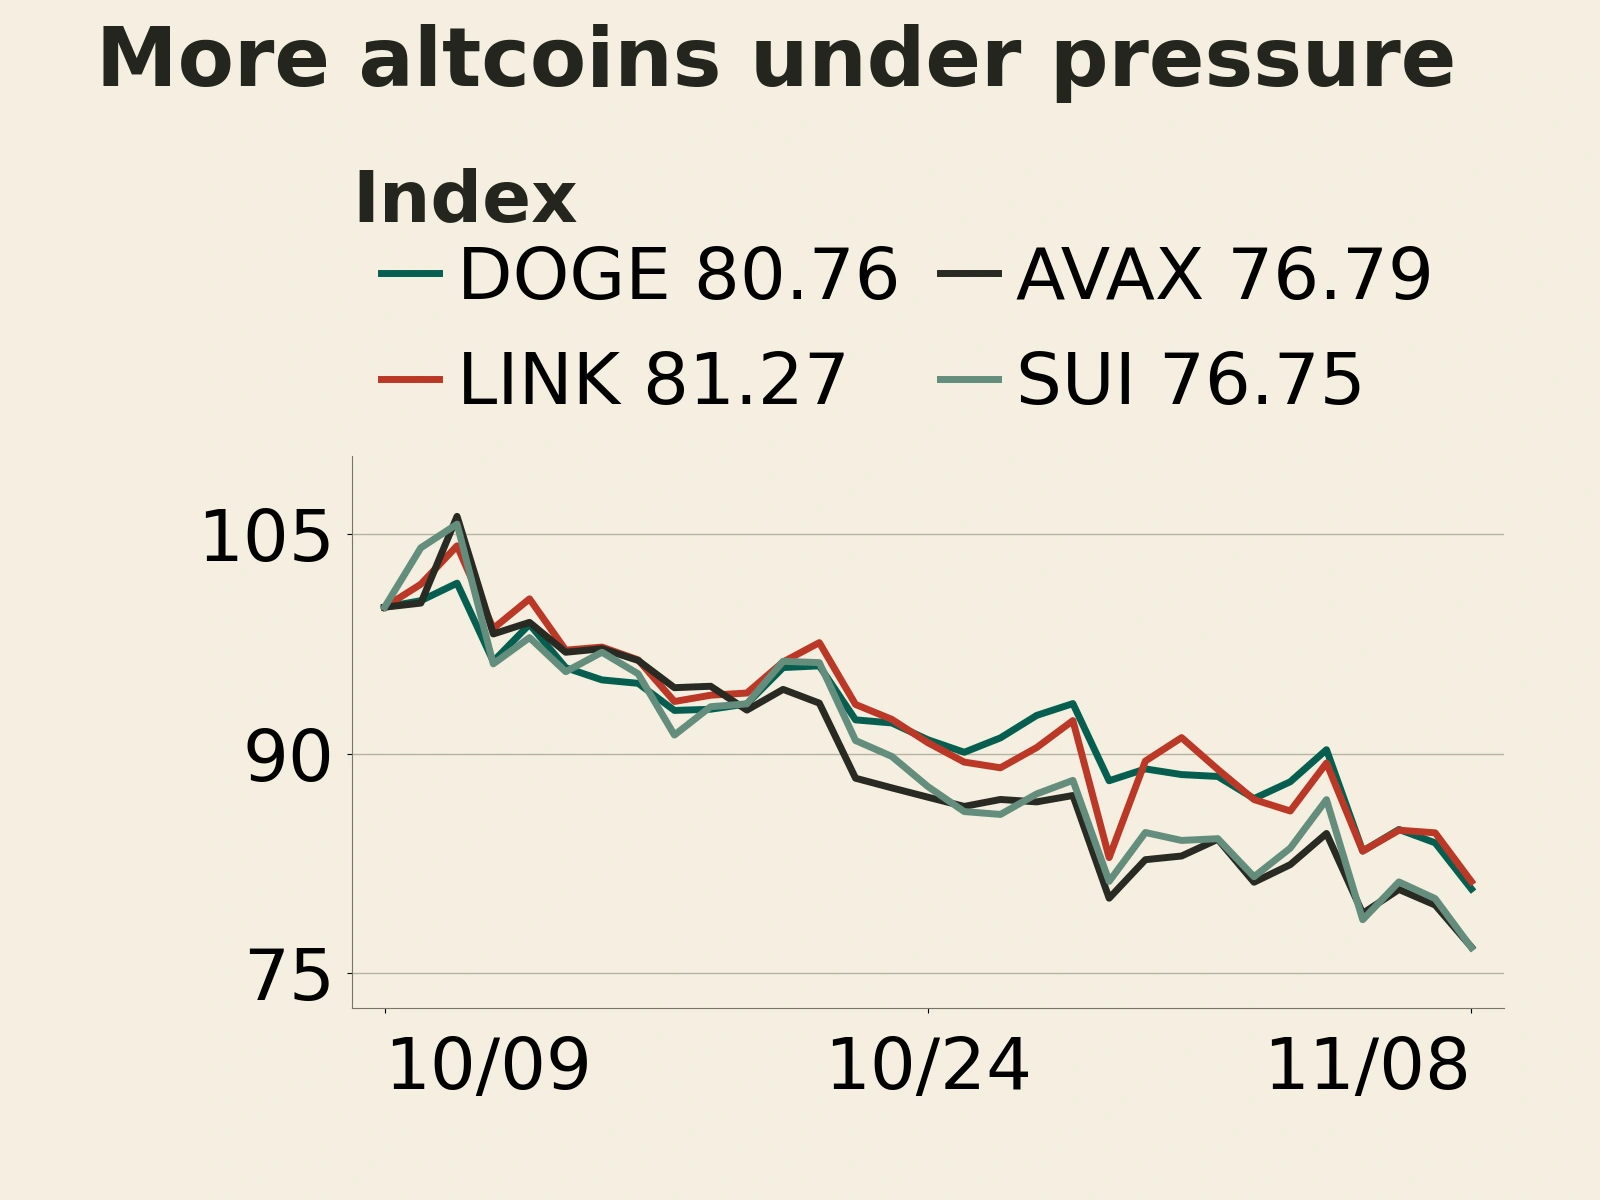
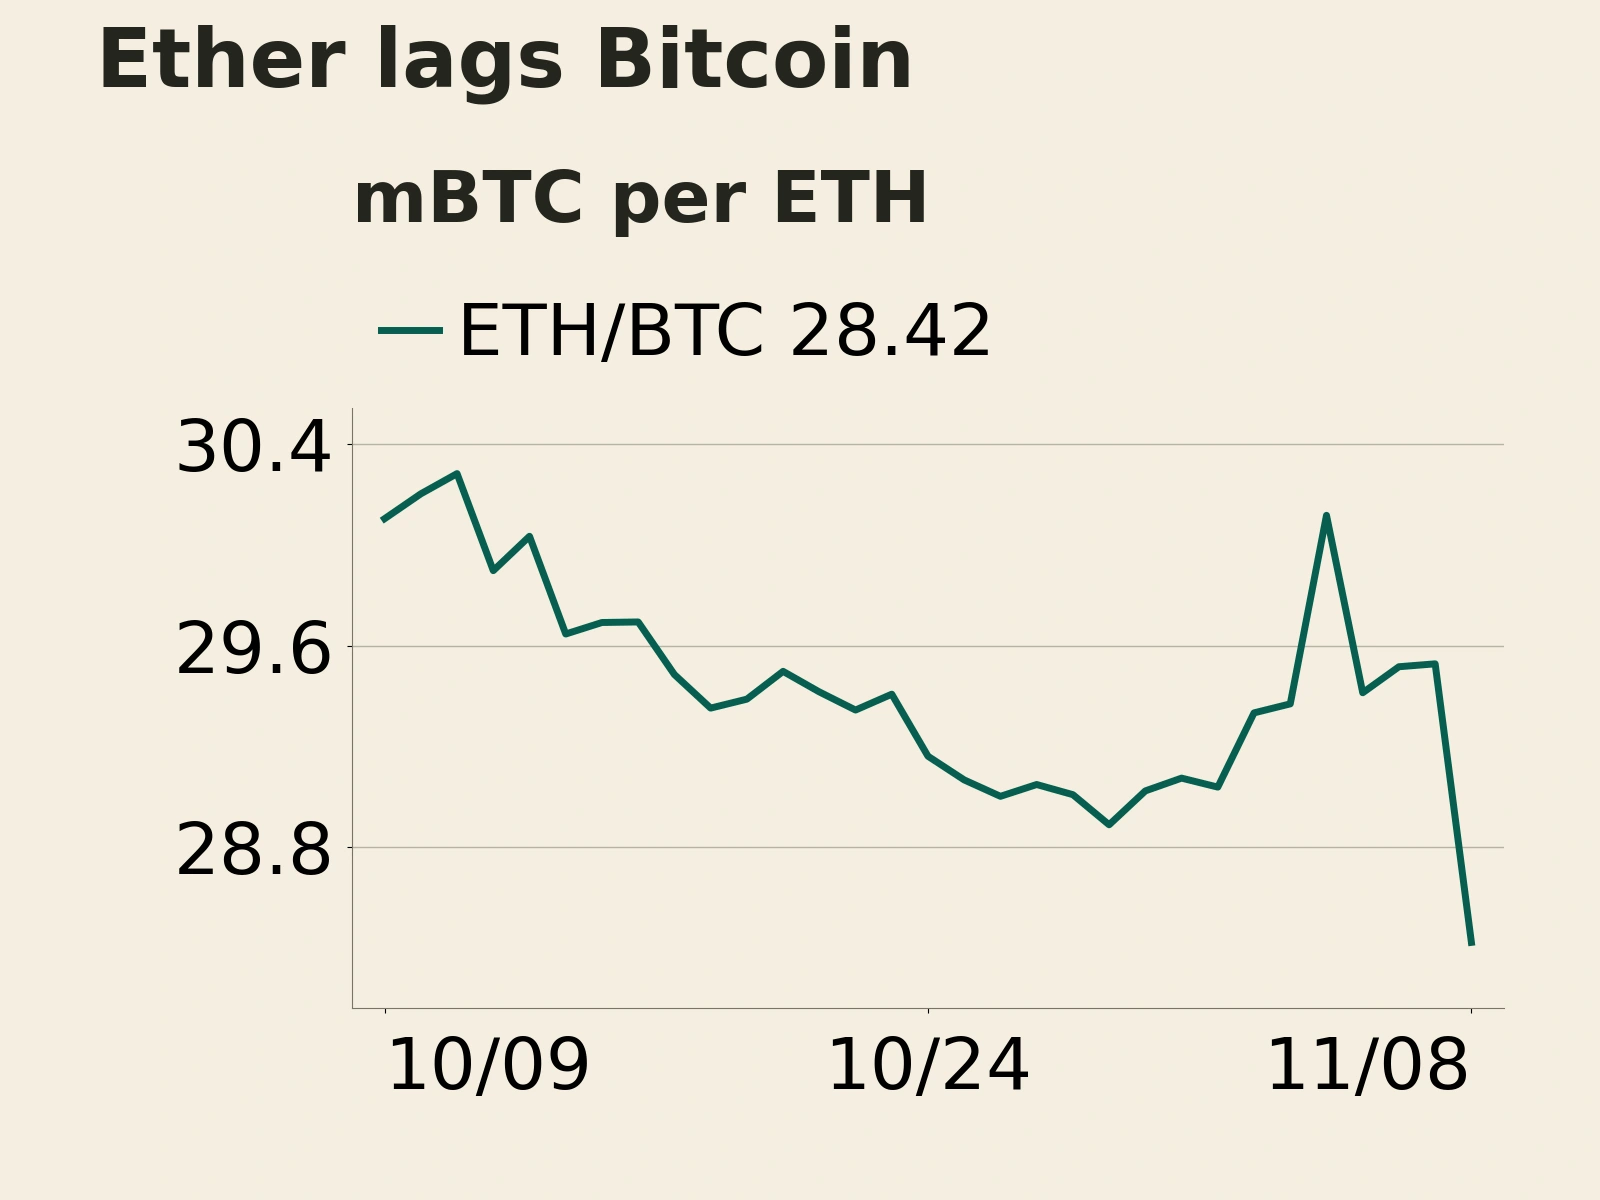
The divergence is clearer over 30 days. Bitcoin fell 9.42%, Ether 14.48%, SOL 20.70% and ADA 27.89%. The week’s losses extended an existing pattern of underperformance among weaker coins. Neither the election outcome nor the incident at a single exchange is enough to account for the full divergence. The ETH/BTC ratio, calculated using closing prices at the same time and on the same exchange, continued to fall, indicating weaker relative demand for Ether alongside the pressure from the broader market decline.
The immediate strain at the exchange had partly eased by the end of the week, but the market still lacked sustained buying from investors allocating capital to absorb selling. Fading worst-case fears can fuel a one-day rebound. A durable recovery depends on continued inflows. The indicators to watch are whether flows through spot investment vehicles improve consistently and whether gains spread from Bitcoin to a wider set of major coins.
Select Read the Original for the full details.