On November 4, 2026, the outcome of the U.S. midterm elections triggered a repricing across asset classes. U.S. stocks and Treasuries initially rallied together as the results came in, while crude oil shed much of its risk premium. By the end of the November 2–8, 2026 week, markets had diverged. Treasury yields were lower, gold was higher, oil had fallen sharply, and technology stocks were under pressure.
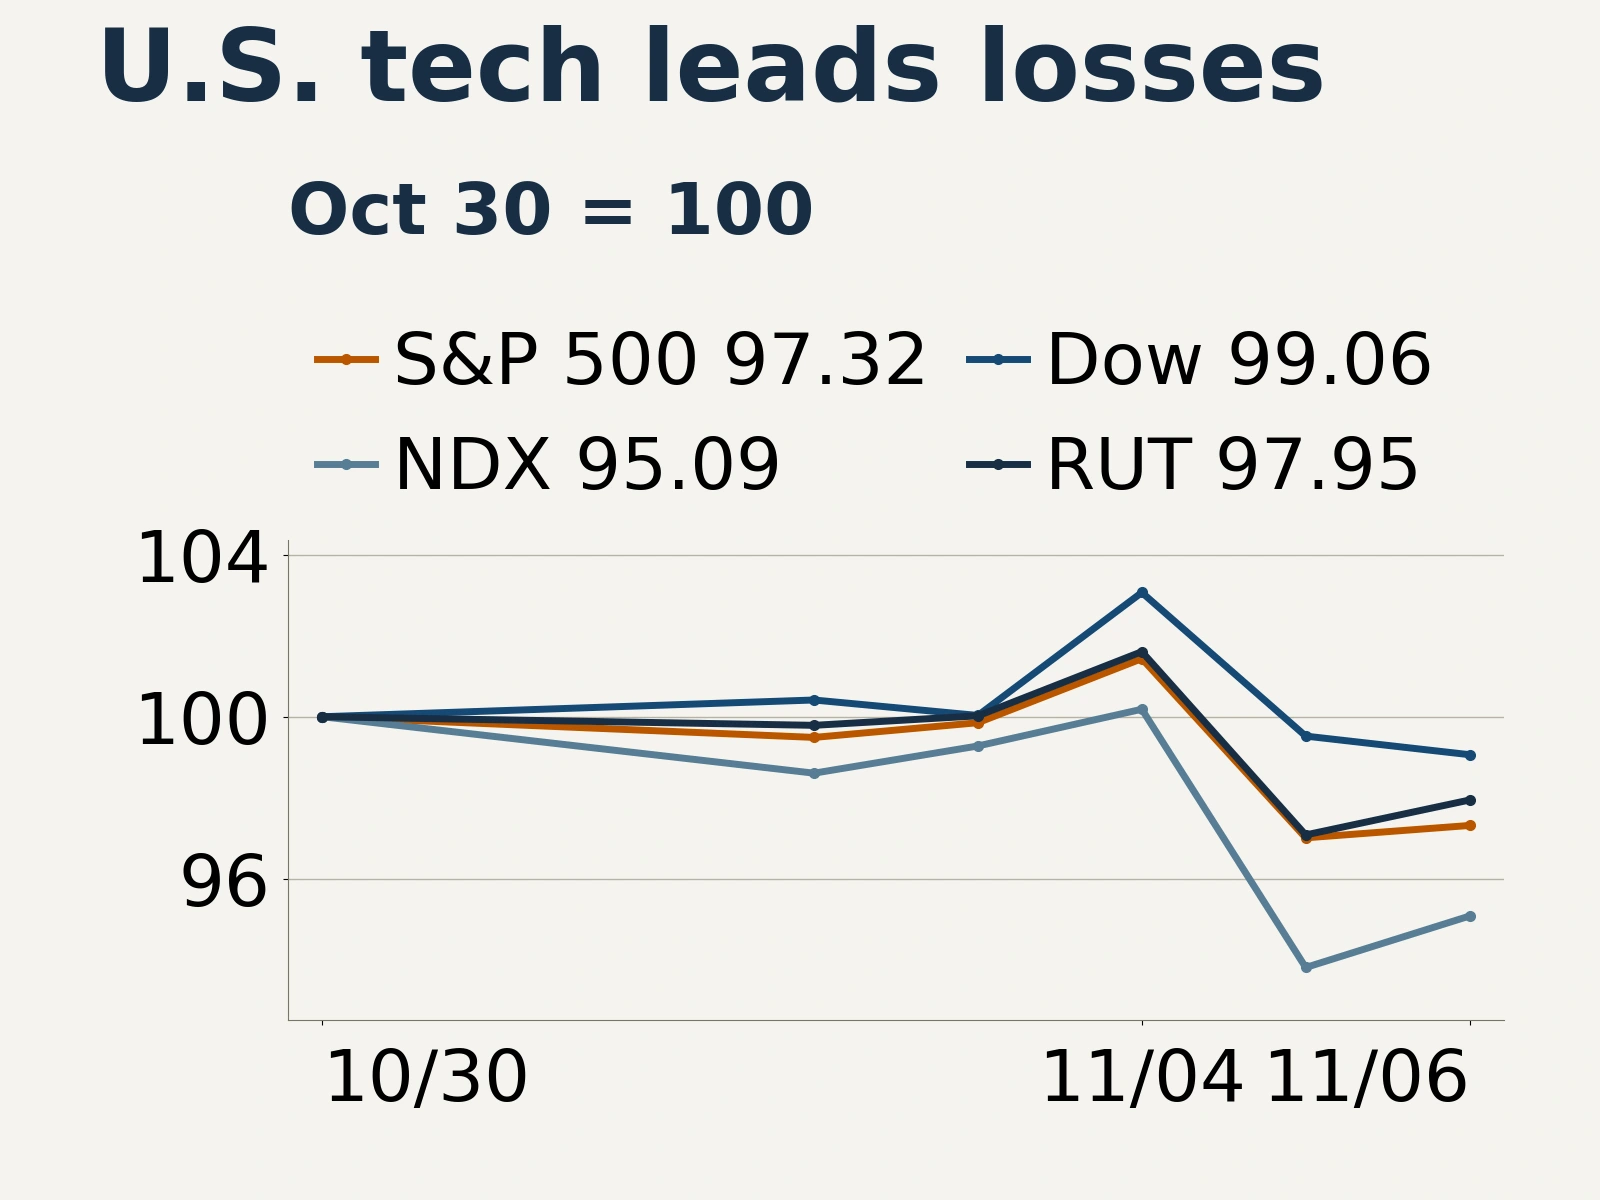
From the October 30 close to the November 6 close, the S&P 500 fell 2.68% and the Nasdaq-100 lost 4.91%. The 10-year U.S. Treasury yield fell 8 basis points. On the data provider’s daily closing basis for continuous futures, WTI and Brent crude plunged 12.76% and 16.42%, respectively, while gold gained 4.51%. Lower energy prices eased cost pressures, but investors applied greater scrutiny to future earnings and financing conditions.
Two developments drove trading throughout the week. The shift in U.S. political power prompted investors to reassess the scope for fiscal expansion, the direction of trade policy, and the risks to energy supply. At the same time, U.S. growth data remained resilient while investors questioned the pace of construction, cash flows, and valuations across the AI supply chain. Lower costs improve the operating environment, but the effect on profits depends on end demand, the pace at which projects come on stream, and the cost of capital.
U.S. payrolls beat expectations with 165,000 new jobs in October, while services costs limit room to ease

U.S. manufacturing and employment data for October showed continued strength, supporting economic growth. The October ISM manufacturing index, released November 2, rose to 55.5 from 54.5. The production index climbed to 59 from 56.7, and the new orders index edged up to 55.5 from 55.3. Output expanded faster and new demand continued to grow.
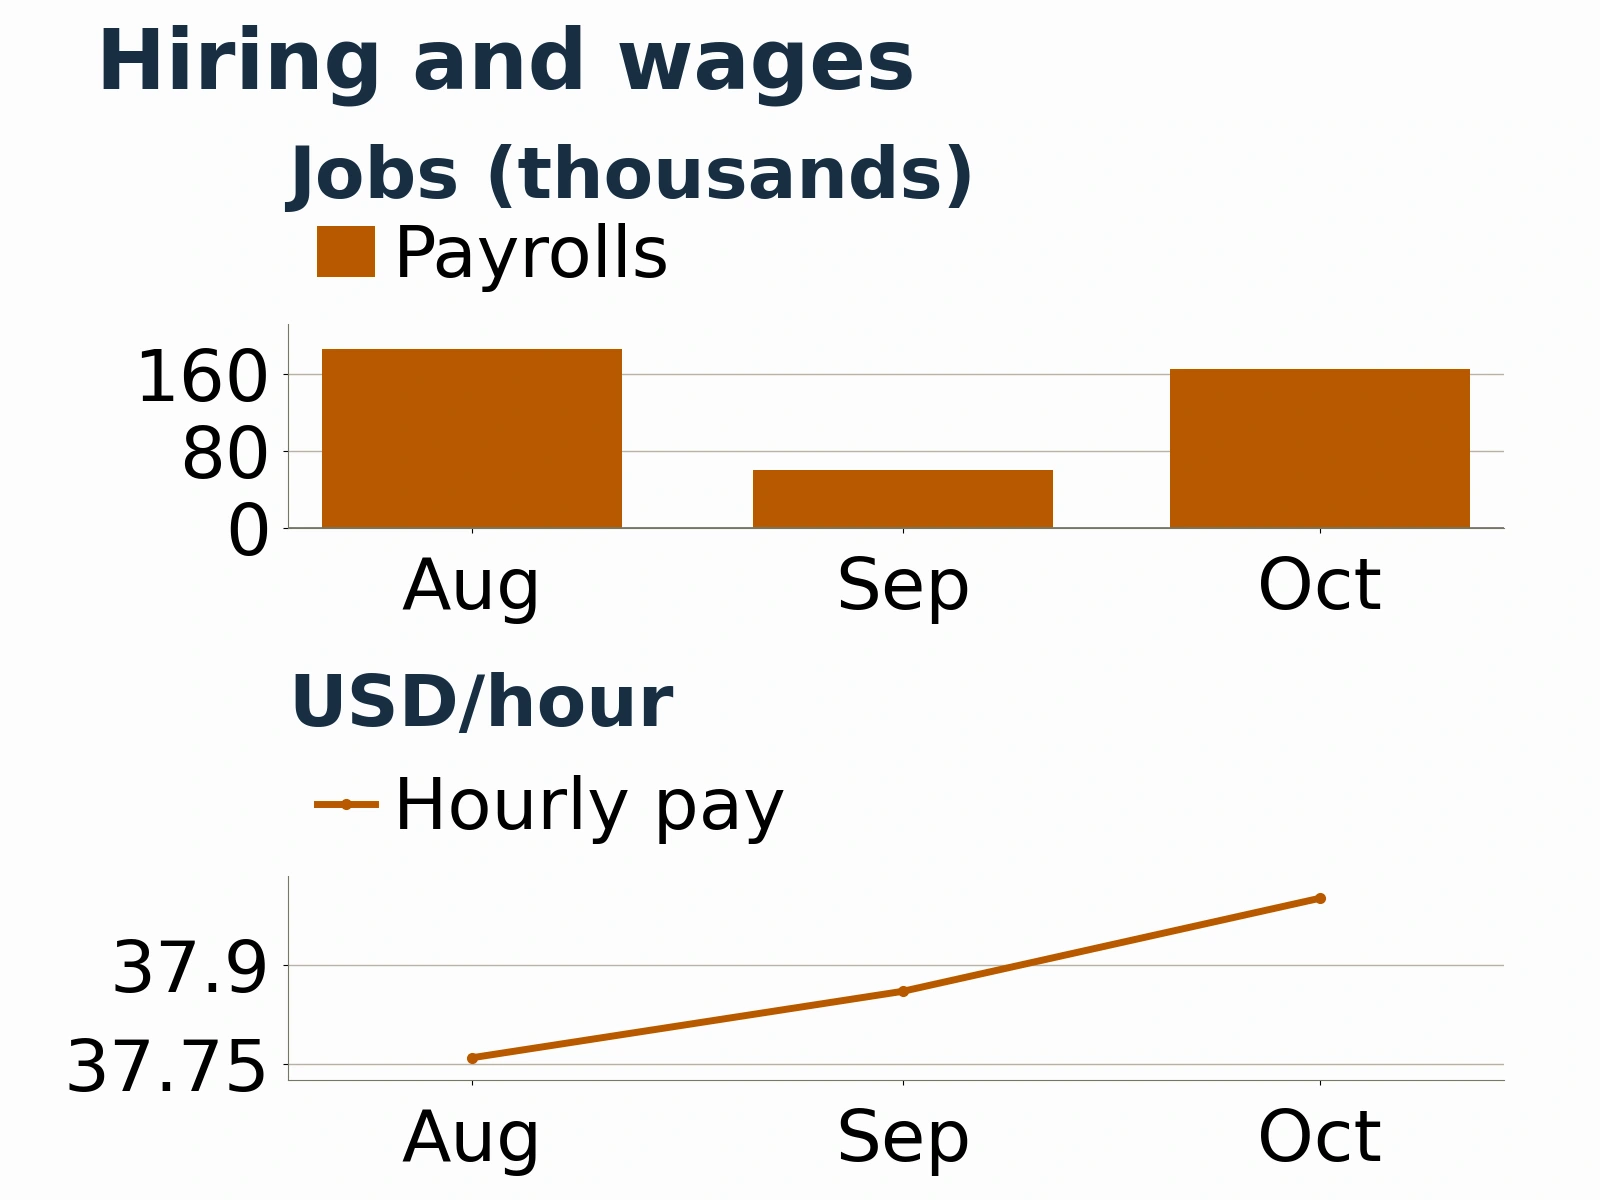
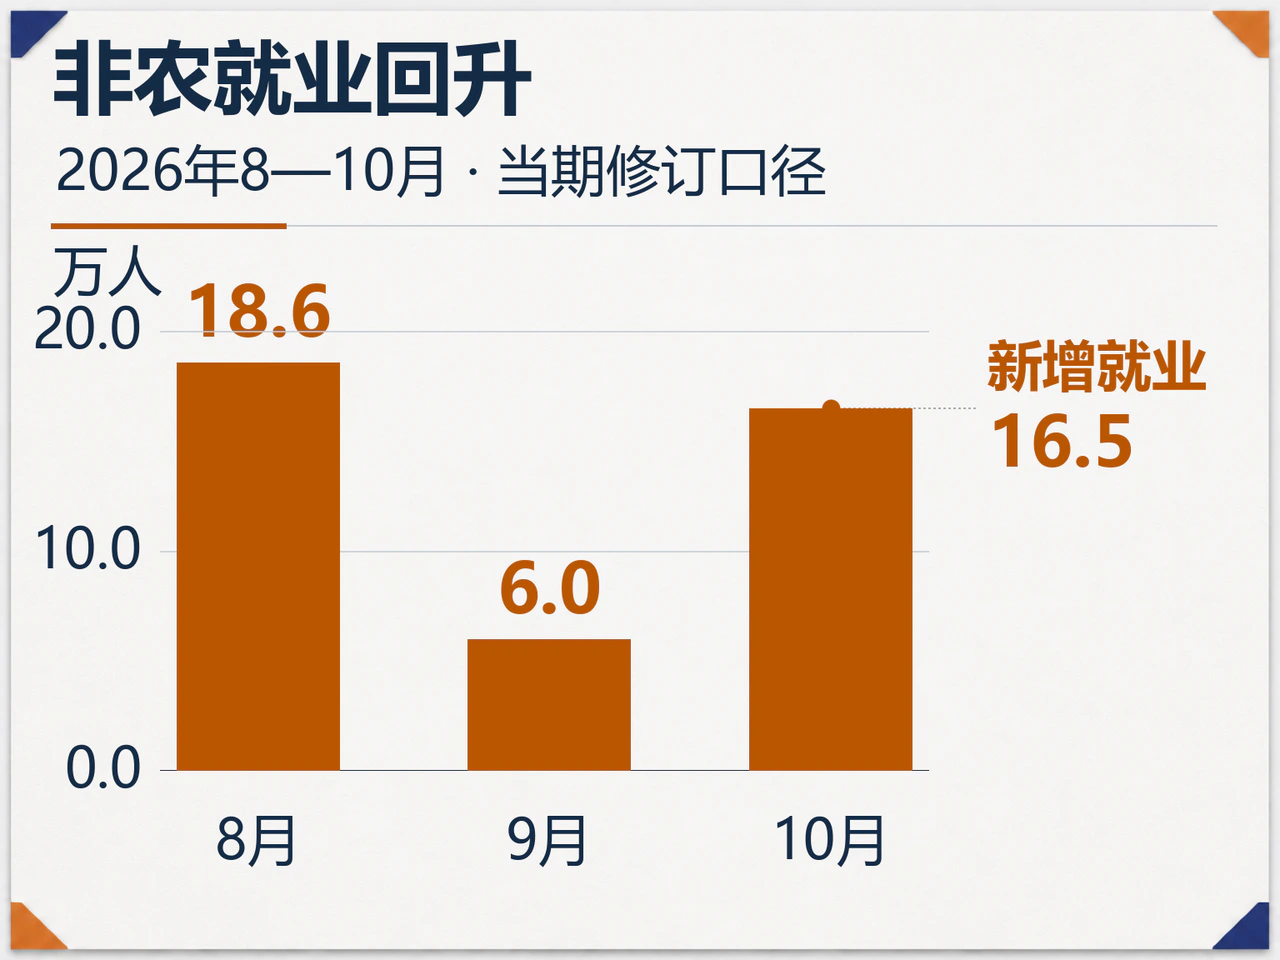
The November 6 report showed that nonfarm payrolls increased by 165,000 in October, well above the 65,000 market estimate cited by TD Economics. Payroll gains in August and September were revised up to 186,000 and 60,000, respectively, a combined upward revision of 84,000. After the revisions, monthly job gains averaged 137,000 from August through October. The October unemployment rate fell to 4.1% from 4.2%. Average hourly earnings rose 0.4% month over month, while annual growth eased to 3.1% from 3.2%. The October gains and upward revisions eased earlier fears of a rapid slowdown in hiring. The September JOLTS report, released November 3, also pointed to a resilient labor market. Job openings were about 7.5 million, hires about 5.4 million, and layoffs and discharges about 1.6 million. The figures were broadly stable, and businesses continued to hire.
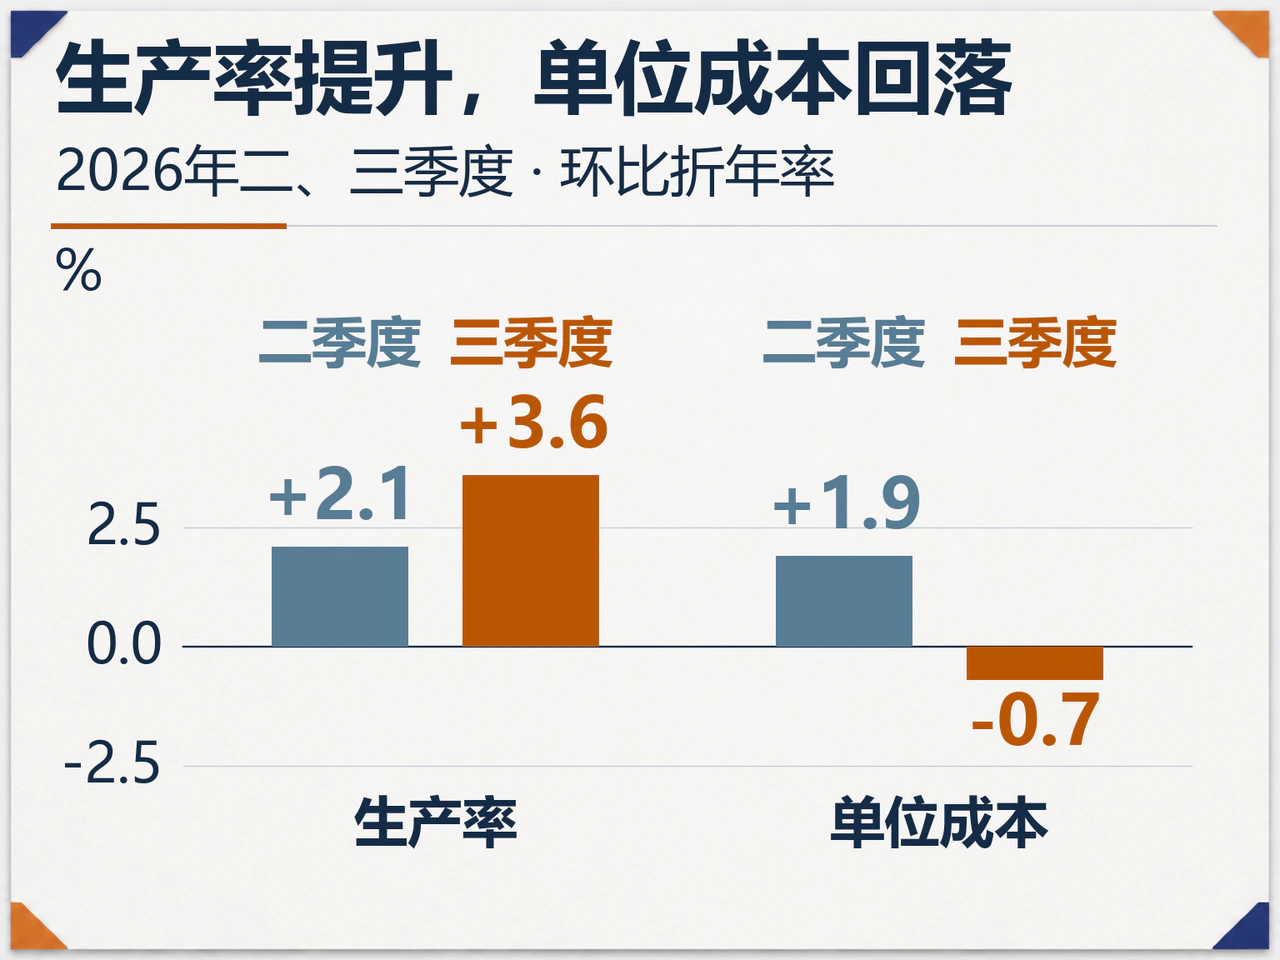
Labor costs in the business sector showed some improvement. Preliminary third-quarter figures released November 5 showed that U.S. nonfarm business productivity rose at a 3.6% annualized rate from the previous quarter, up from a revised 2.1% in the second quarter. Hourly compensation rose 2.9%, and unit labor costs fell 0.7%. Businesses produced more with hours worked nearly flat, giving them more room to absorb rising pay. Manufacturing unit labor costs still rose 2.7% in the third quarter, reflecting uneven productivity gains across industries.
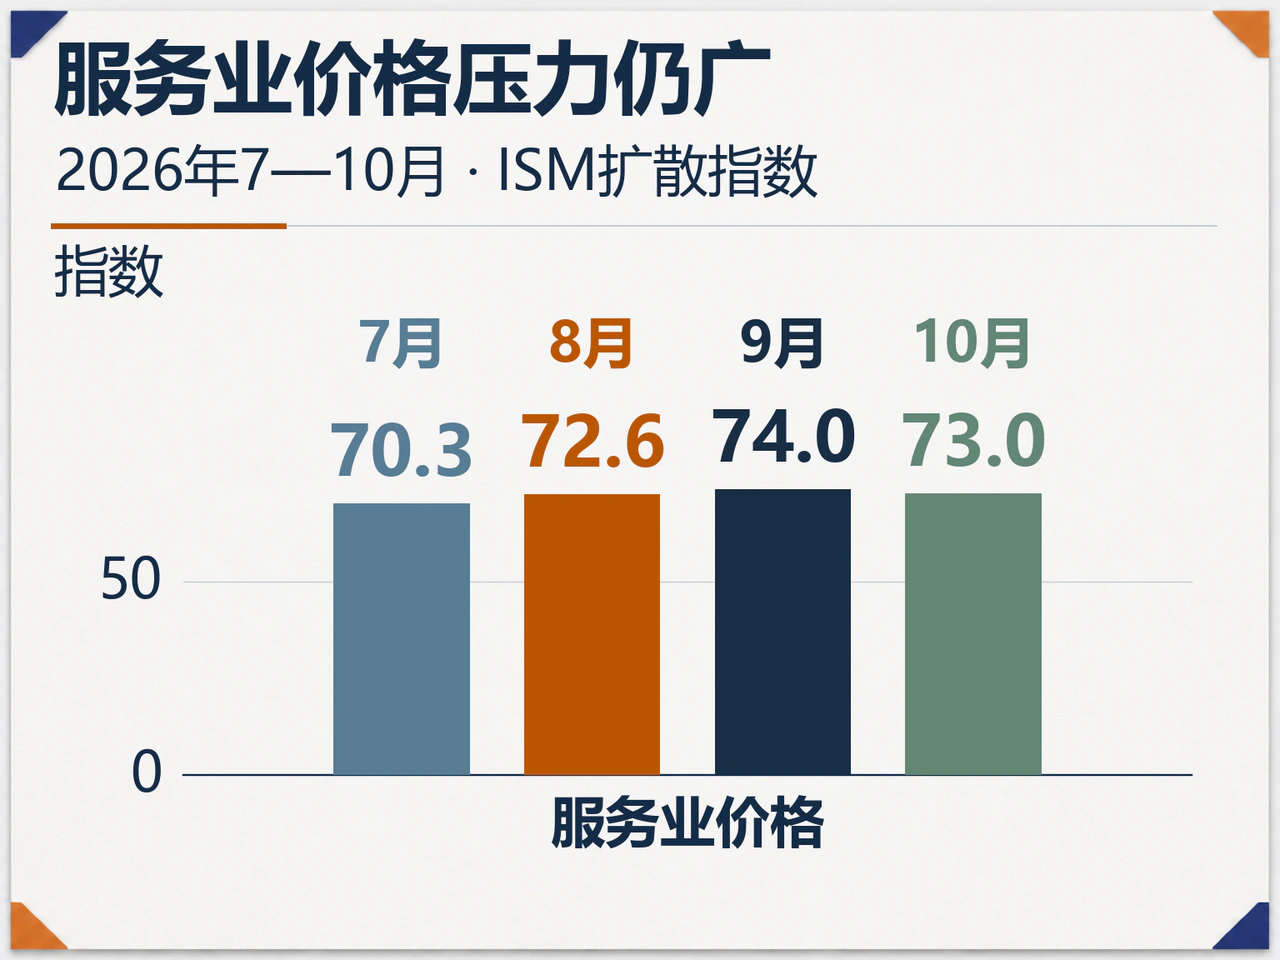
Services data showed that cost pressures remained persistent. The October ISM services index edged down to 54.5 from 54.9, and the new orders index fell to 55.9 from 59.8 as business activity expanded more slowly. The employment index rose to 51.4 from 50.1, while supplier deliveries slowed further. The services prices index eased to 73 from 74, but had exceeded 70 in seven of the past eight months, indicating that rising input costs remained widespread. The ISM survey chair said respondents repeatedly cited pressure from fuel and tariffs, and some had yet to pass those costs through in full to customers.
The sharp drop in oil prices and gains in productivity are easing some inflation pressures, but resilient hiring and elevated services costs leave little room for a rapid shift toward monetary easing. In its analysis of the payrolls report, TD Economics said the employment figures and upward revisions strengthened the case for further rate increases. Markets are now watching the October U.S. CPI release on November 10 for signs that lower energy costs are feeding through to core prices.
Ten-year breakeven inflation falls 10 basis points and high-yield spreads widen
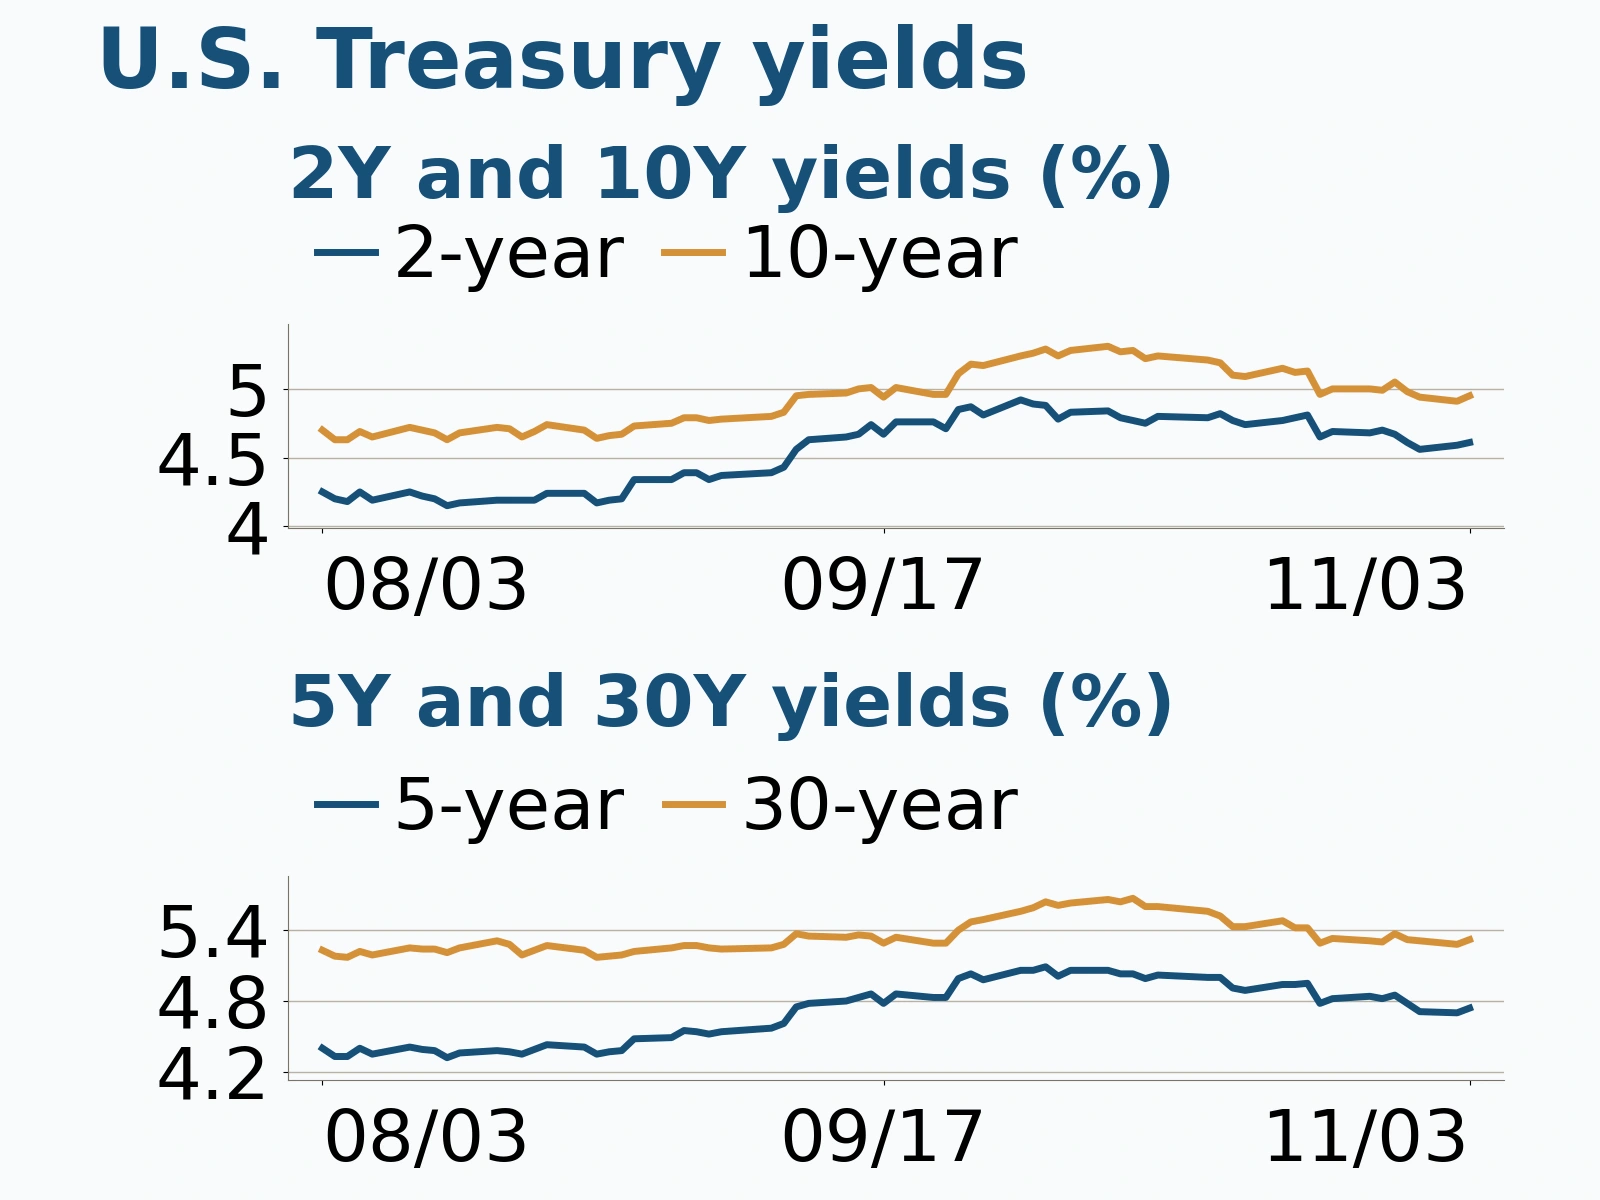
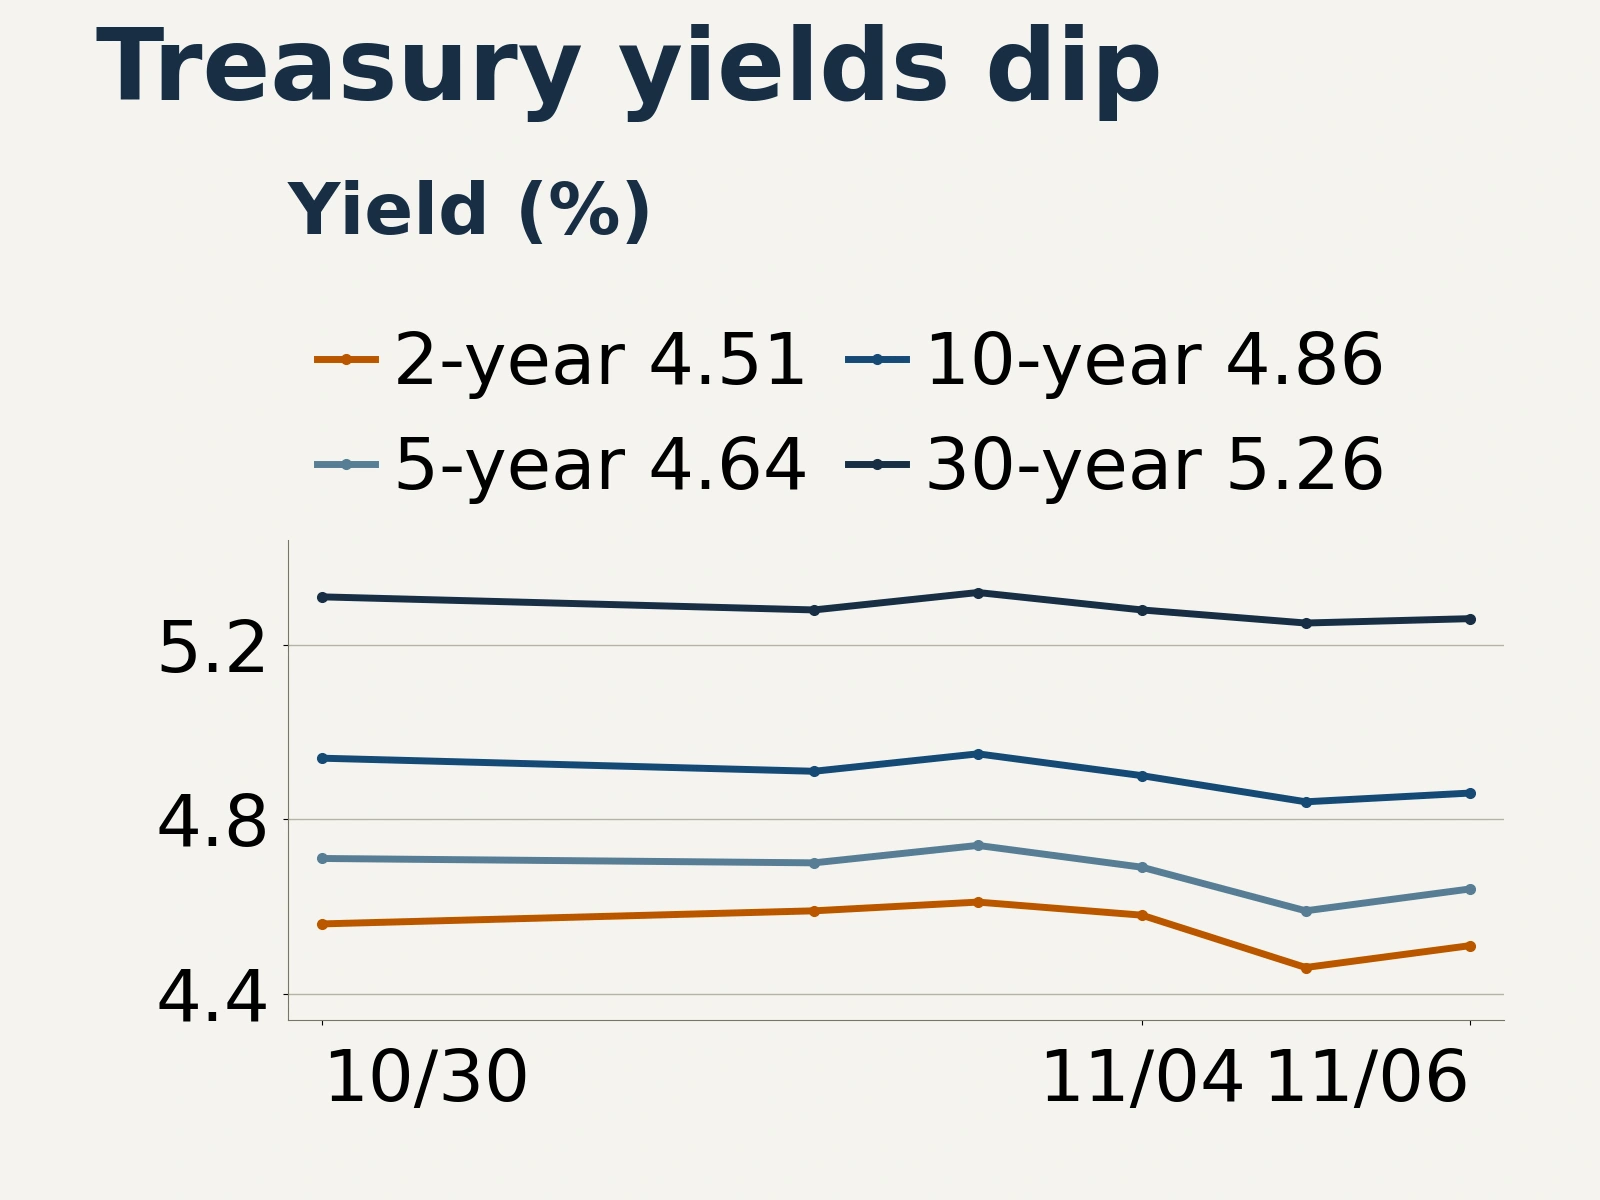
Cooling inflation expectations and safe-haven demand pulled Treasury yields lower across the curve over the week. At the November 6 close, the 2-, 5-, 10-, and 30-year yields were 4.51%, 4.64%, 4.86%, and 5.26%, down 5, 7, 8, and 5 basis points, respectively, from the previous Friday. The middle of the curve outperformed. The 10-year minus 2-year spread narrowed to 35 basis points from 38, while the 30-year minus 10-year spread widened to 40 basis points from 37.
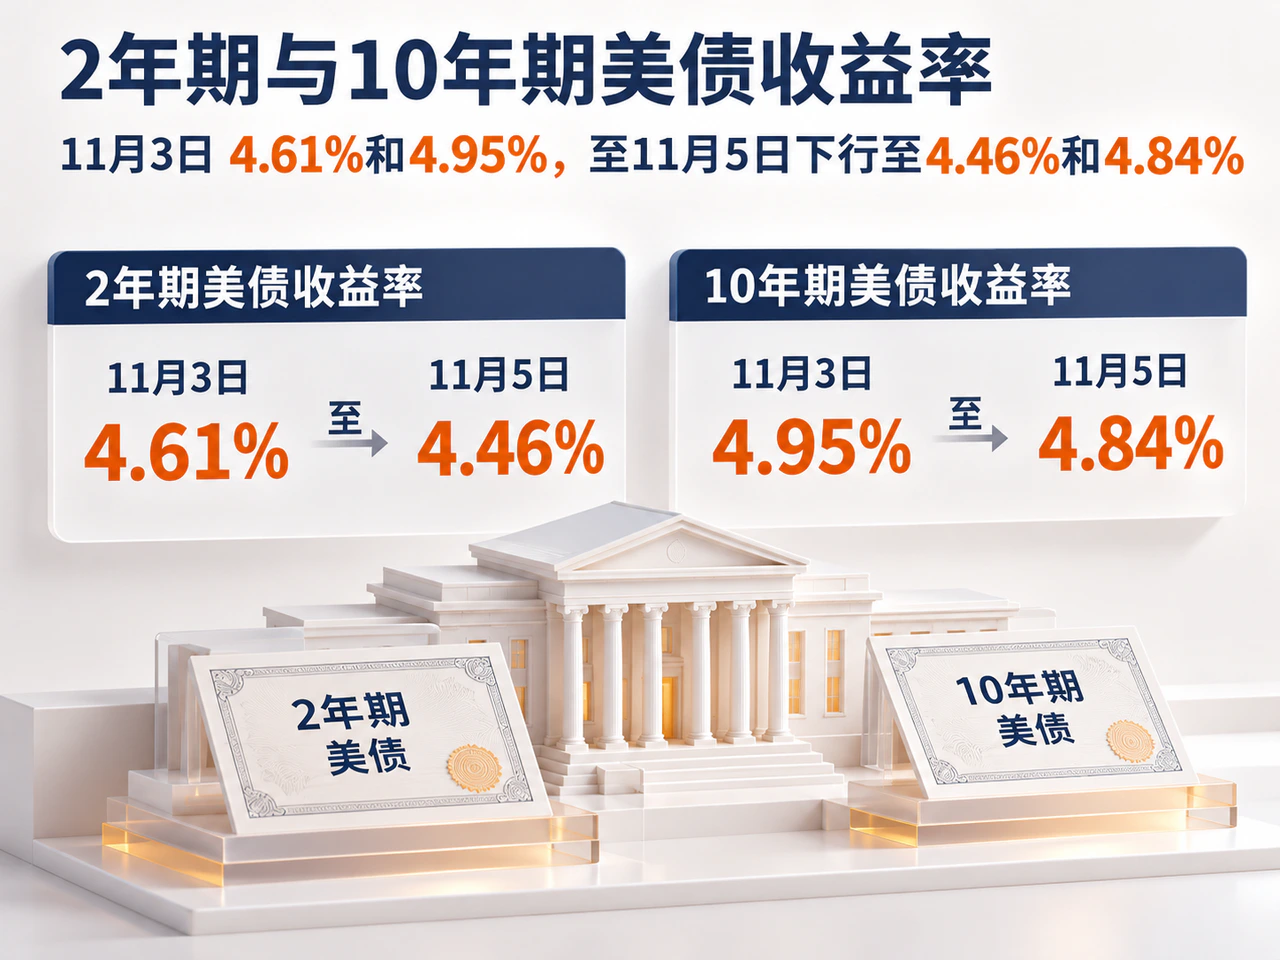
Most of the Treasury rally came midweek. The 2-year and 10-year yields stood at 4.61% and 4.95% on November 3 before falling to 4.46% and 4.84%, respectively, on November 5. After Friday’s strong payrolls report, the two yields rebounded by 5 and 2 basis points, respectively. The sharp drop and subsequent rebound at the short end reflected the tension between safe-haven demand and strong employment fundamentals.
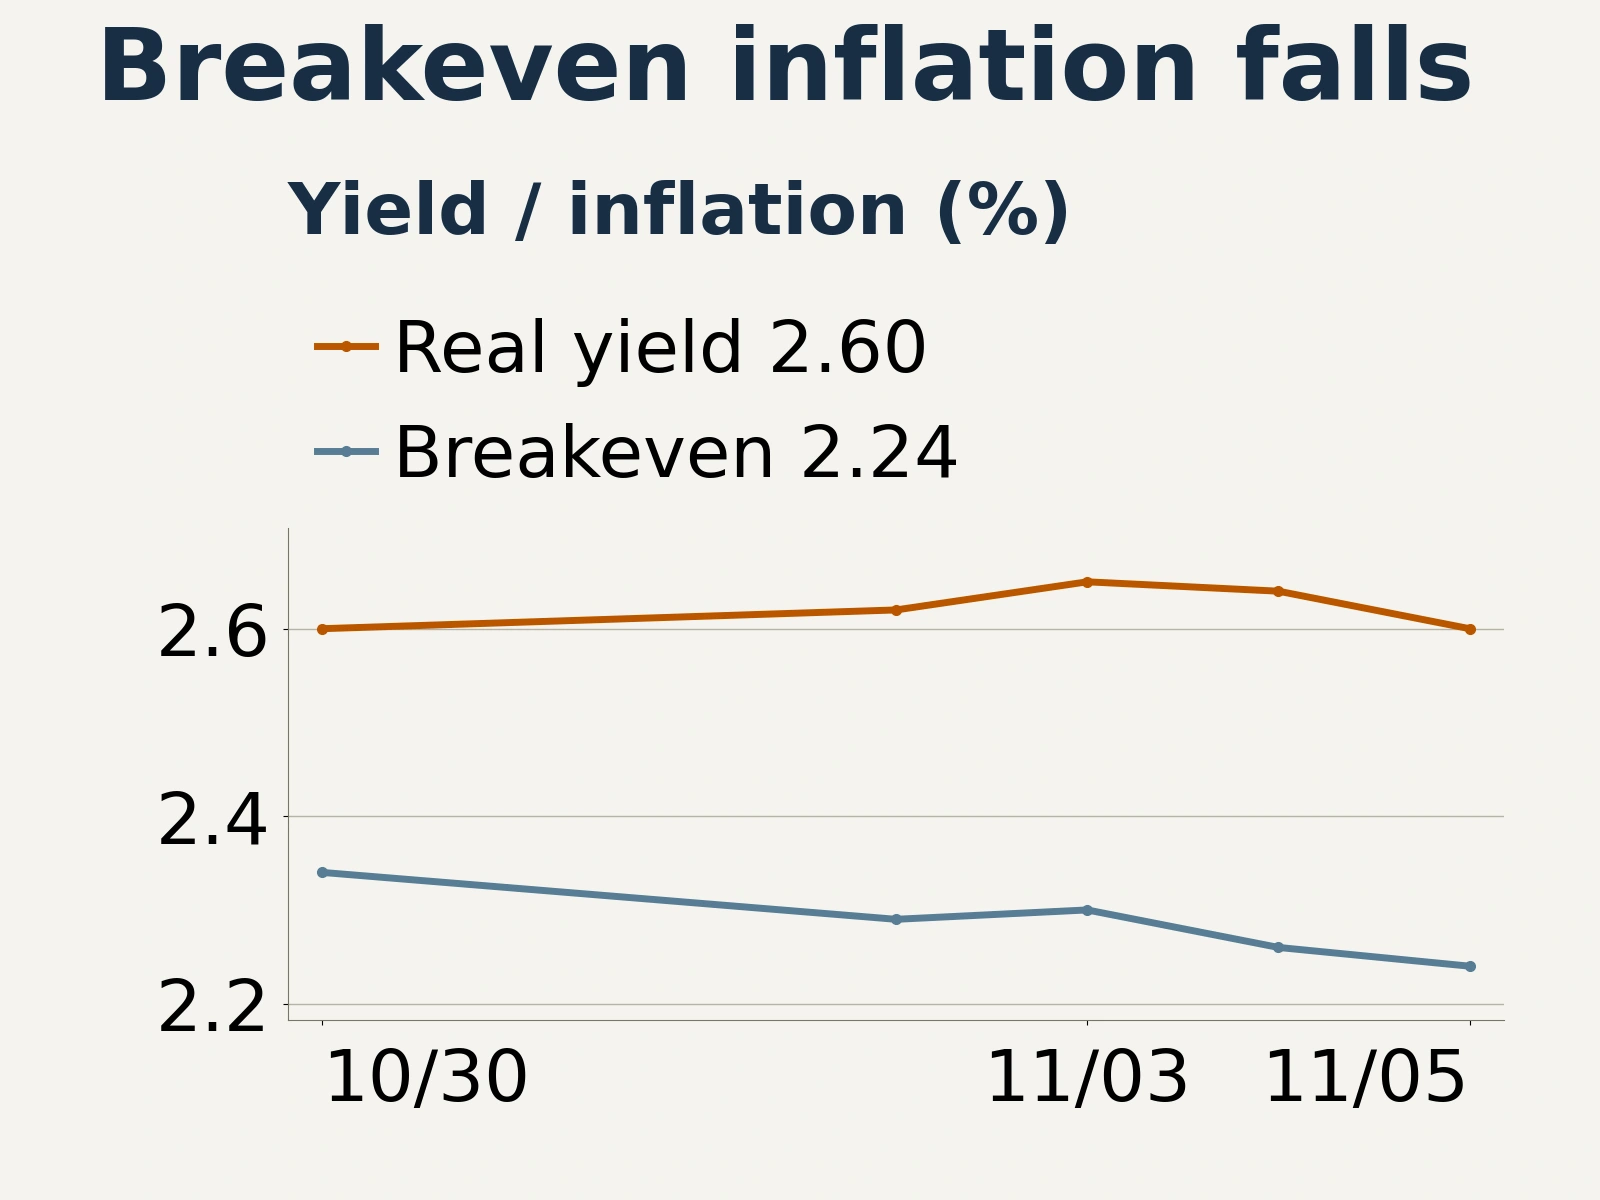
Separating real yields from inflation compensation helps explain the bond market’s move. The 10-year real yield climbed as high as 2.65% midweek before returning to 2.60% on November 5, unchanged from October 30. Over the same period, the 10-year breakeven inflation rate fell 10 basis points, from 2.34% to 2.24%. The oil sell-off pulled inflation compensation lower, while the rout in technology shares spurred safe-haven demand. Together they drove nominal yields down.
The political shift also lent Treasuries some support. After Reuters reported on November 4 that Democrats had won control of both chambers of Congress, Société Générale research head Phoenix Kalen said divided government would limit room for fiscal action and ease upward pressure on Treasury yields. That assessment concerns future policy, while fiscal financing needs remain substantial in the near to medium term.
In its November 2 estimate, the U.S. Treasury projected $618 billion in privately held net marketable borrowing for the fourth quarter, $10 billion less than projected in August, mainly because the starting cash balance was higher than assumed. Adjusting for the cash balance, borrowing needs were actually $24 billion higher. Treasury also projected $800 billion in net borrowing for the first quarter of 2027. Its November 4 quarterly refunding announcement kept nominal coupon and floating-rate note auction sizes steady for the next several quarters. Despite the lack of near-term plans for a sharp increase in issuance, the market still faces substantial recurring funding needs over the medium term.
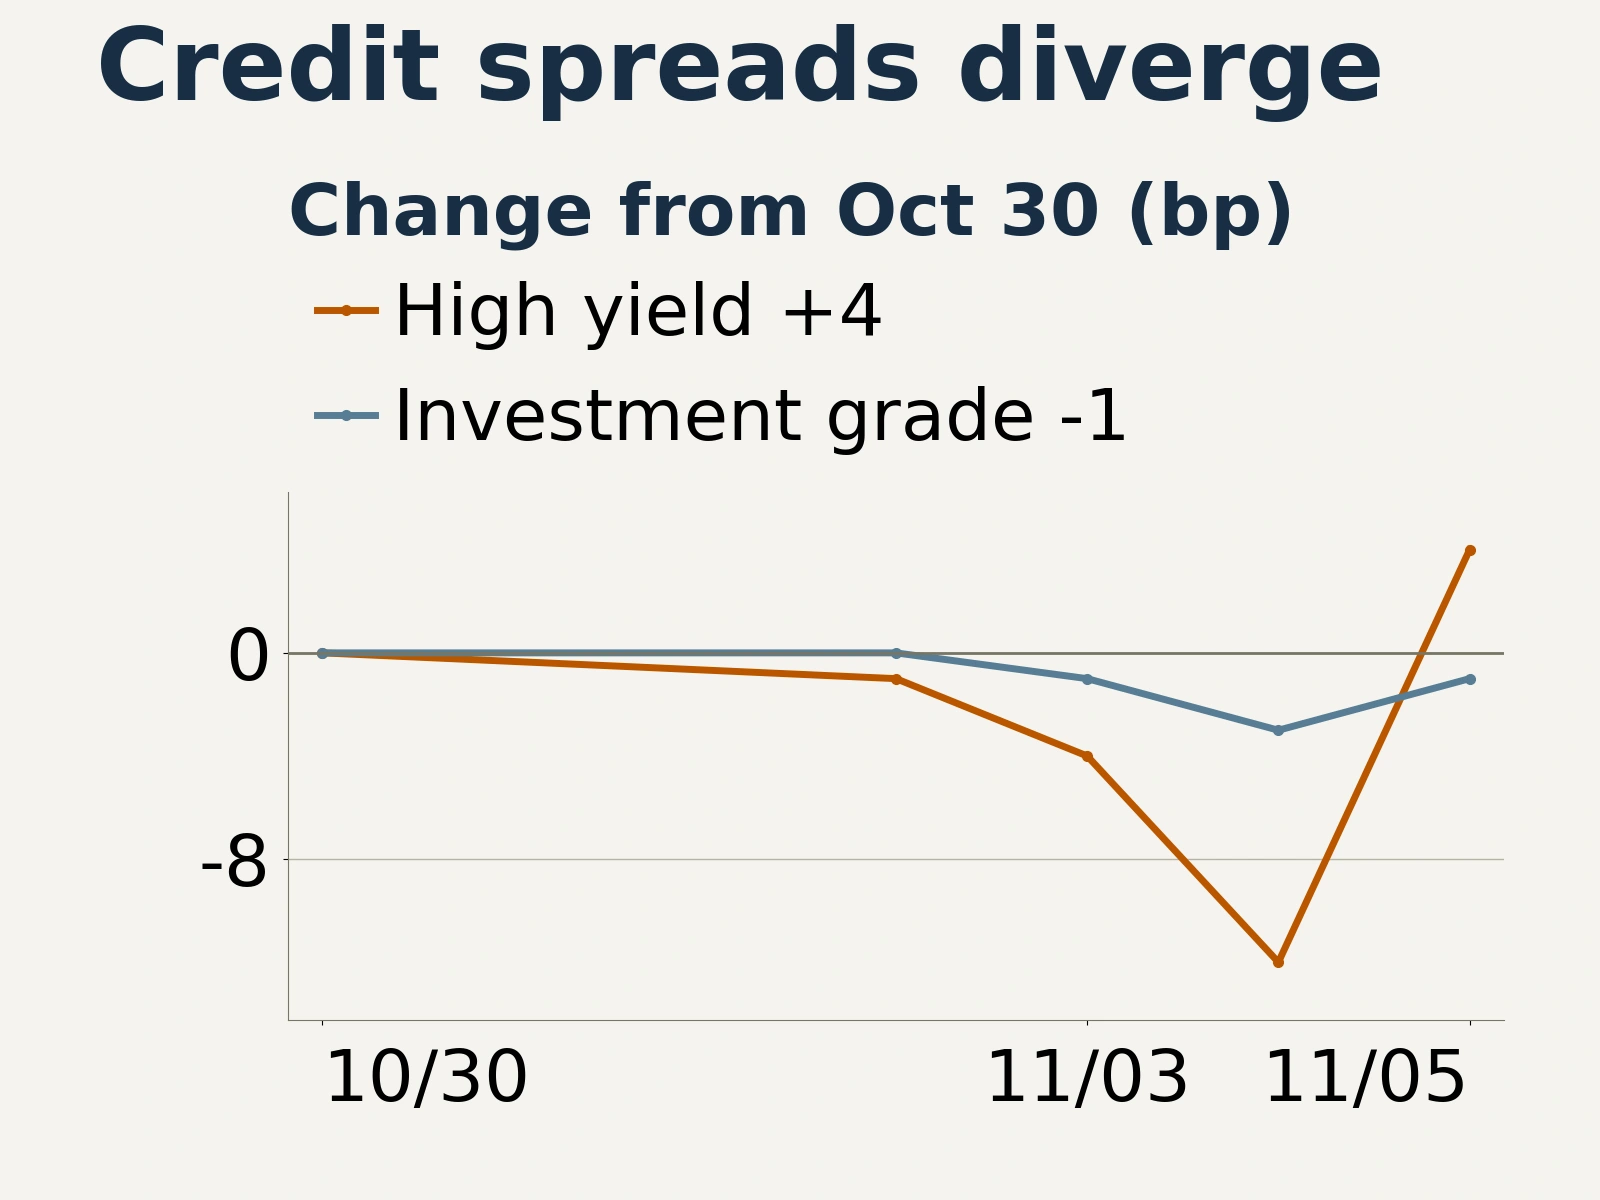
In dollar credit markets, benchmark yields fell as high-yield spreads widened. The ICE BofA U.S. High Yield Option-Adjusted Spread was 348 basis points on November 5, 4 basis points wider than on October 30 and 16 basis points wider than on Wednesday, November 4. The investment-grade spread stood at 93 basis points, 1 basis point narrower than at the previous week’s close. Bloomberg reported on November 6 that SoftBank led losses in Asian dollar bonds, showing that the repricing of AI-related stocks had spread to credit. Lower 5- to 10-year Treasury yields supported valuations for fixed-rate debt of similar maturities, though wider credit risk premiums offset some of that benefit. Issuers’ funding structures and ability to generate cash are coming under scrutiny.
Data center constraints worry investors as the Nasdaq-100 falls 4.91% despite strong earnings growth

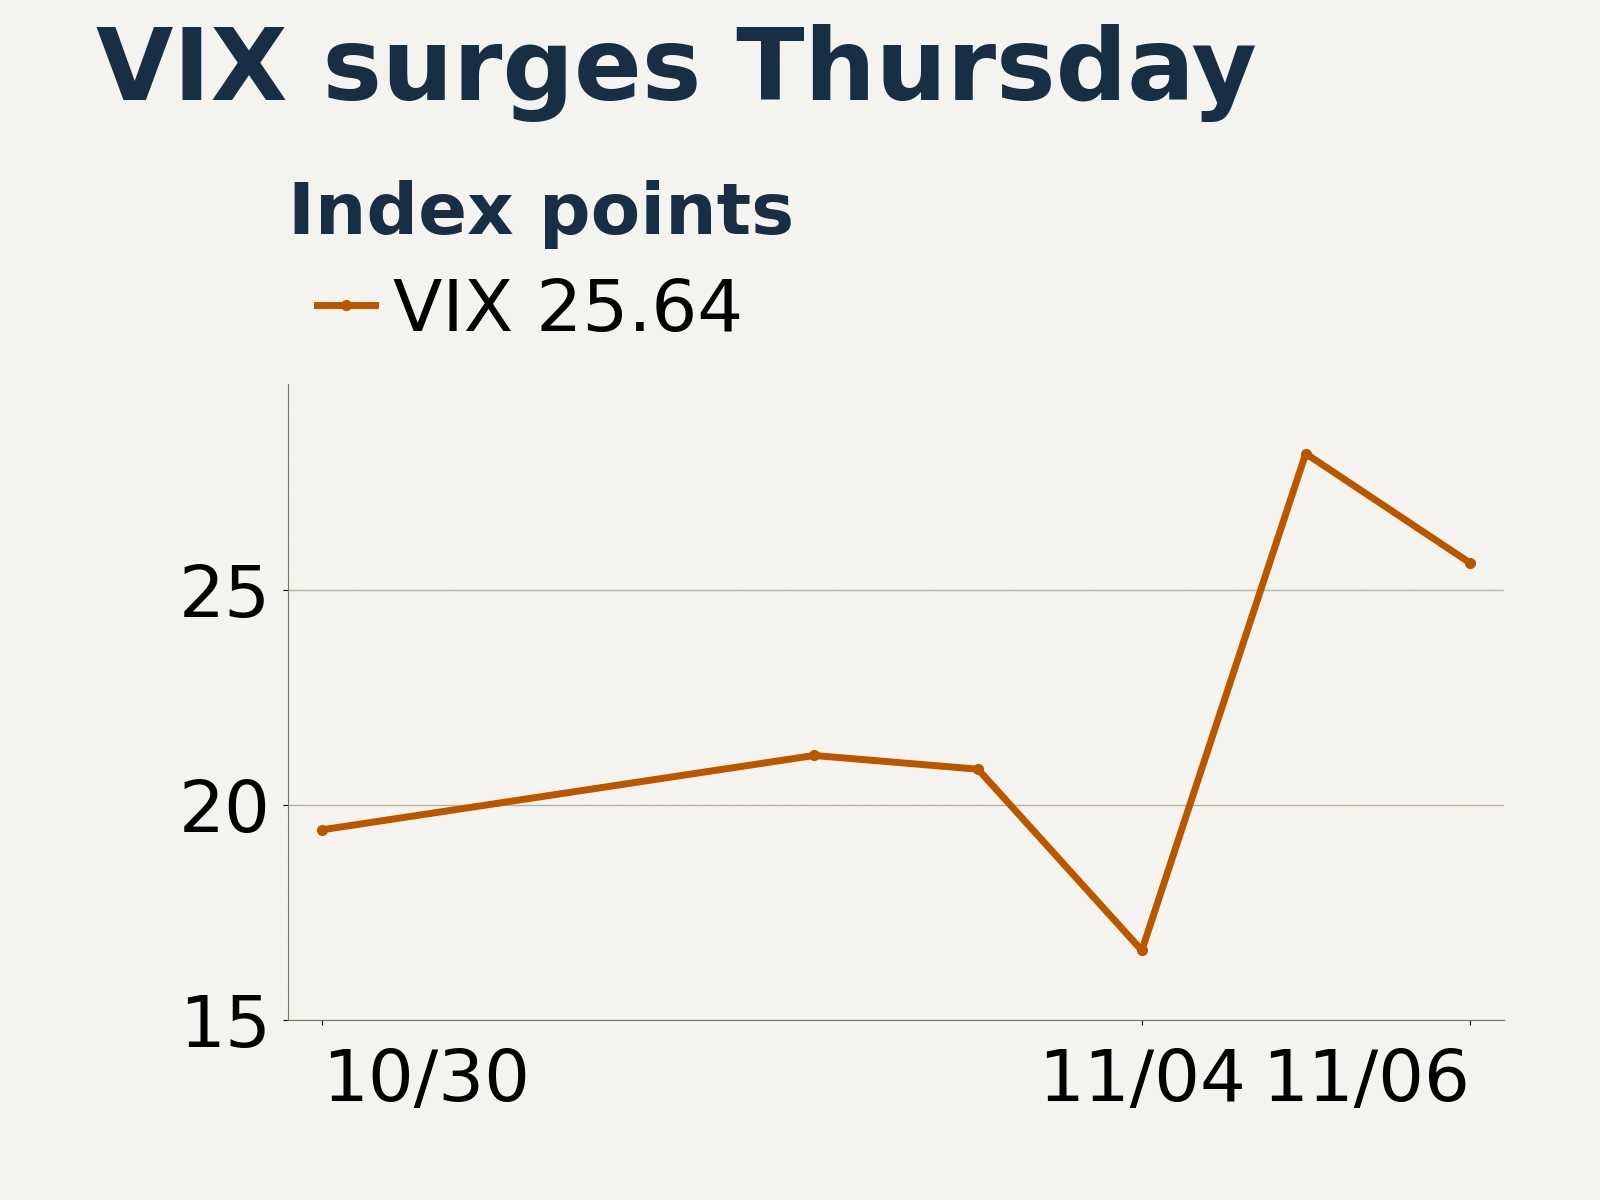
Selling in U.S. equities was concentrated in the technology supply chain before spreading to other sectors. The S&P 500 reached 7,688.62 on November 4, fell sharply to 7,353.73 the next day, and recovered slightly to 7,376.86 on Friday. The Nasdaq-100 closed at 26,989.99. The Dow Jones Industrial Average ended at 51,285.73, down 0.94% for the week, and the Russell 2000 fell 2.05%. The VIX rose from 19.42 the previous Friday to 25.64 at the end of the week, after dropping to 16.61 on Wednesday and jumping to 28.18 on Thursday.
CNBC reported that, following the midterms, investors feared tighter regulatory constraints on data center construction. Permitting, access to power, and the pace of expansion emerged as new risks for AI investment. Delays push back the conversion of orders, recognition of revenue, and collection of cash for chipmakers, hardware suppliers, and data center operators. Companies that rely heavily on external financing to expand are especially exposed to that timing mismatch.
Strong earnings releases stood in contrast to falling equity valuations. AMD reported after the November 3 close that third-quarter revenue had climbed 45% year over year to about $13.38 billion. Data center revenue jumped 97% to about $8.5 billion. The company projected fourth-quarter revenue of about $17 billion, plus or minus 3%. Palantir reported after the November 2 close that third-quarter revenue rose 96% year over year to $2.313 billion, with U.S. commercial revenue up 148%. Rapid growth already delivered by AI chip and enterprise software companies did little to prevent investors from marking down their forward valuations.
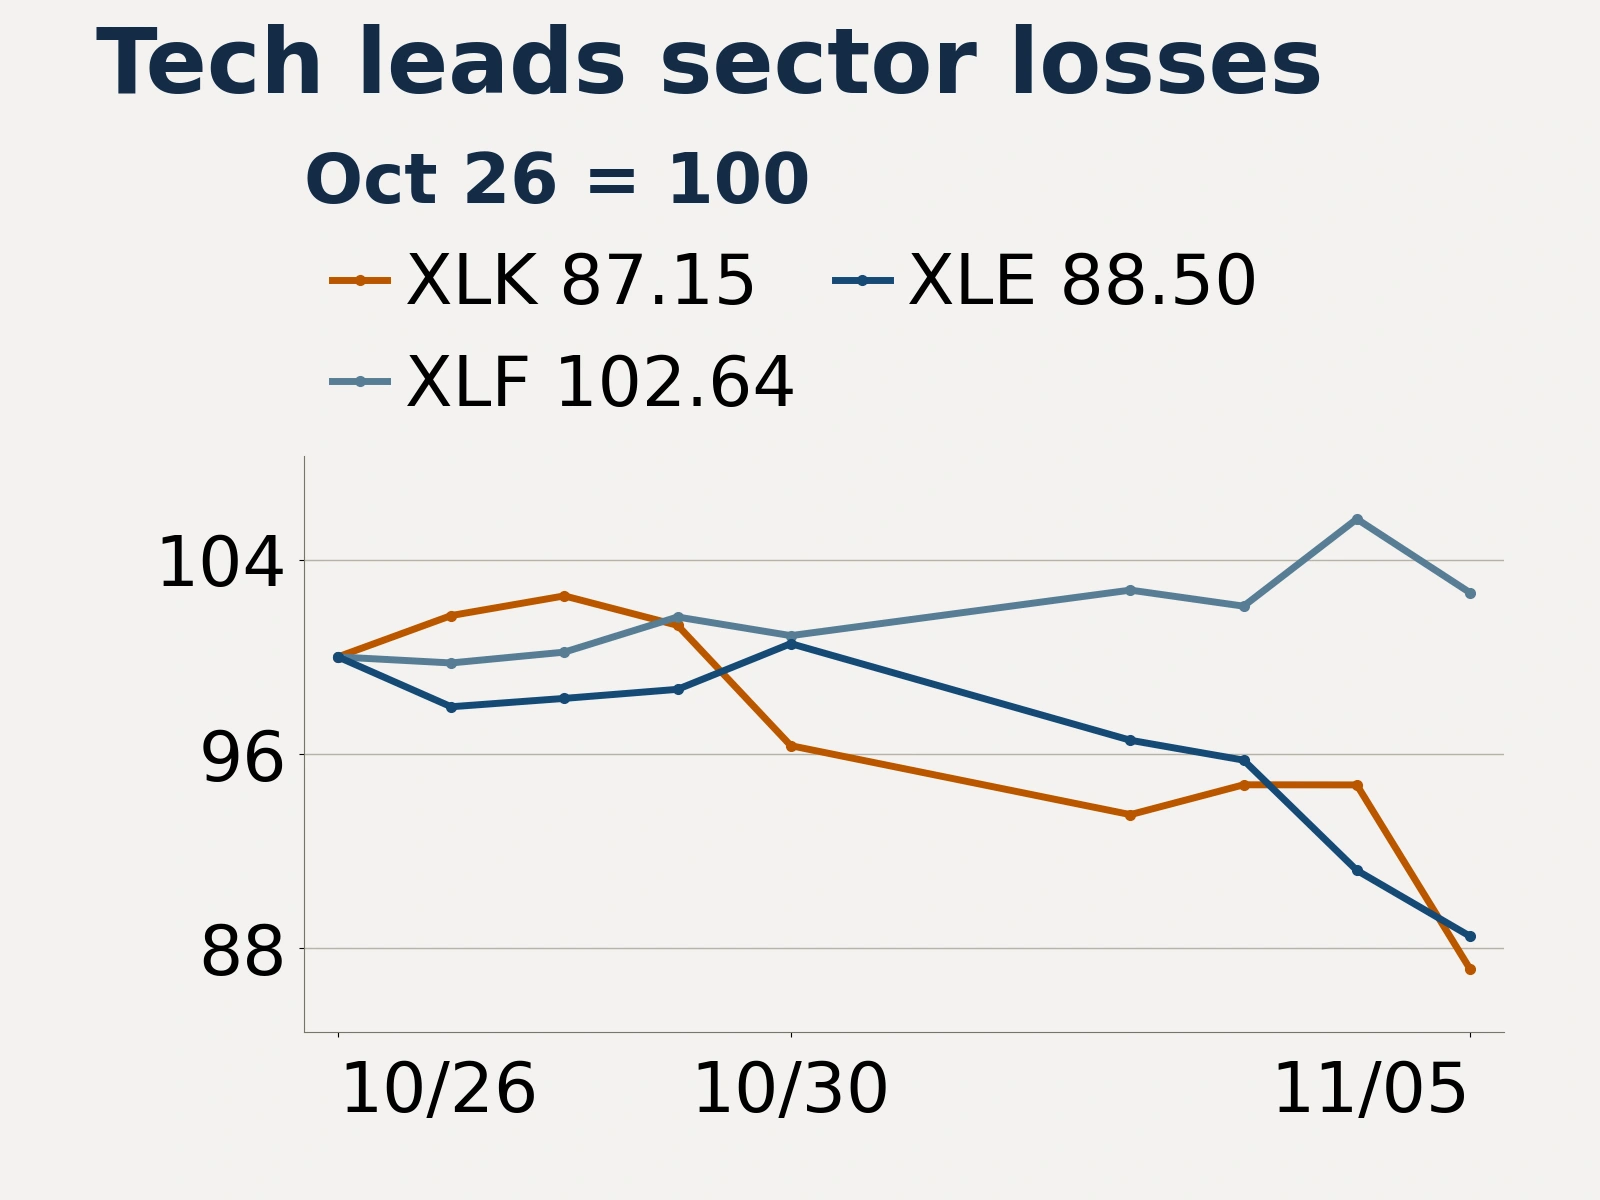
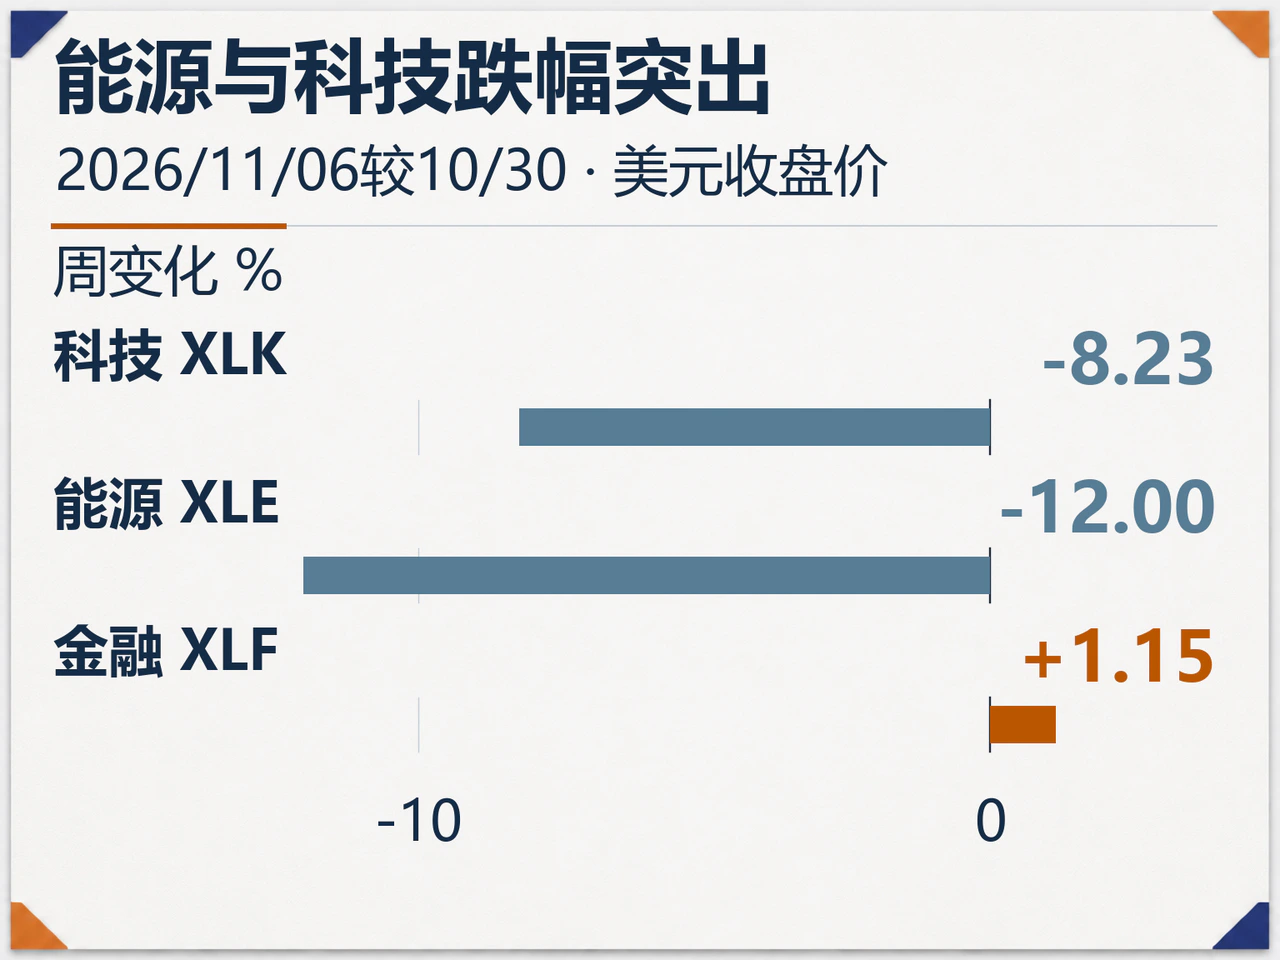
Sector ETFs also showed a shift in positioning. Based on U.S. dollar closing prices, the technology ETF XLK fell 8.23% for the week, the energy ETF XLE dropped 12.00%, and the financials ETF XLF bucked the trend with a gain of 1.15%. Energy faced both the plunge in global oil prices and a reassessment of future electricity demand from data centers. Technology was directly exposed to the risk of a slower infrastructure buildout and downward revisions to forward earnings assumptions.
Wall Street firms differed on how long these constraints might last. Macro Research Board said investors had begun to question overly optimistic forward earnings expectations and that the AI valuation adjustment had further to run. Yardeni Research argued that markets had priced in too much political resistance and stressed the distinction between projects already permitted and under construction and projects still on the drawing board. Jefferies also said incoming governors were more likely to introduce standards and restrictions than to ban data center construction outright.
After a week of sharp repricing, investors are applying a tougher test across the AI supply chain. Strong current revenue growth remains a baseline. The resilience of individual valuations increasingly depends on whether orders are backed by approved capacity or tied to future plans, and whether expansion is funded by operating cash flow or by external debt and equity.
Crude drops more than 12% as the risk premium unwinds, while rates and safe-haven demand lift gold 4.51%
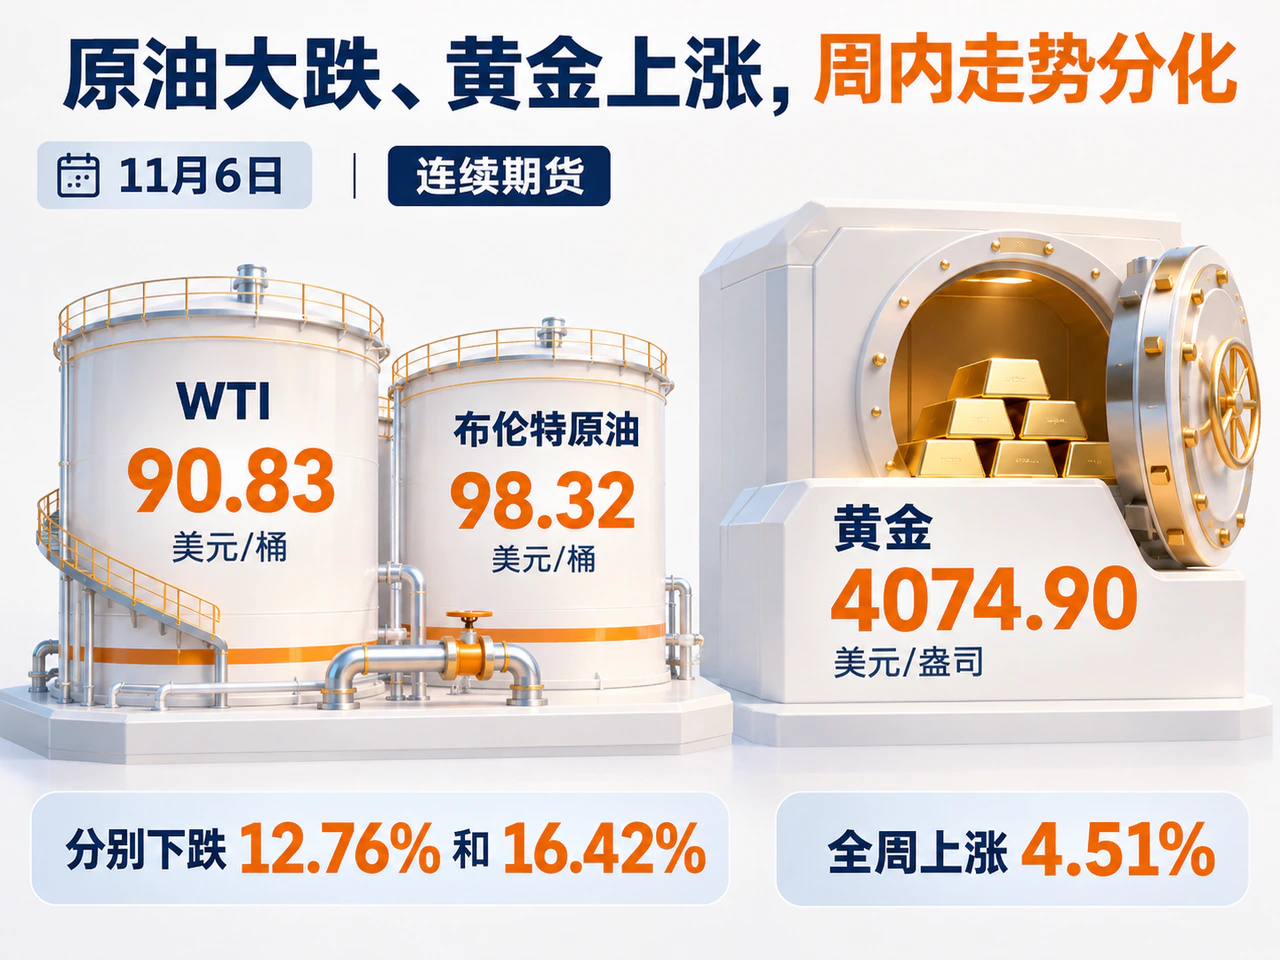
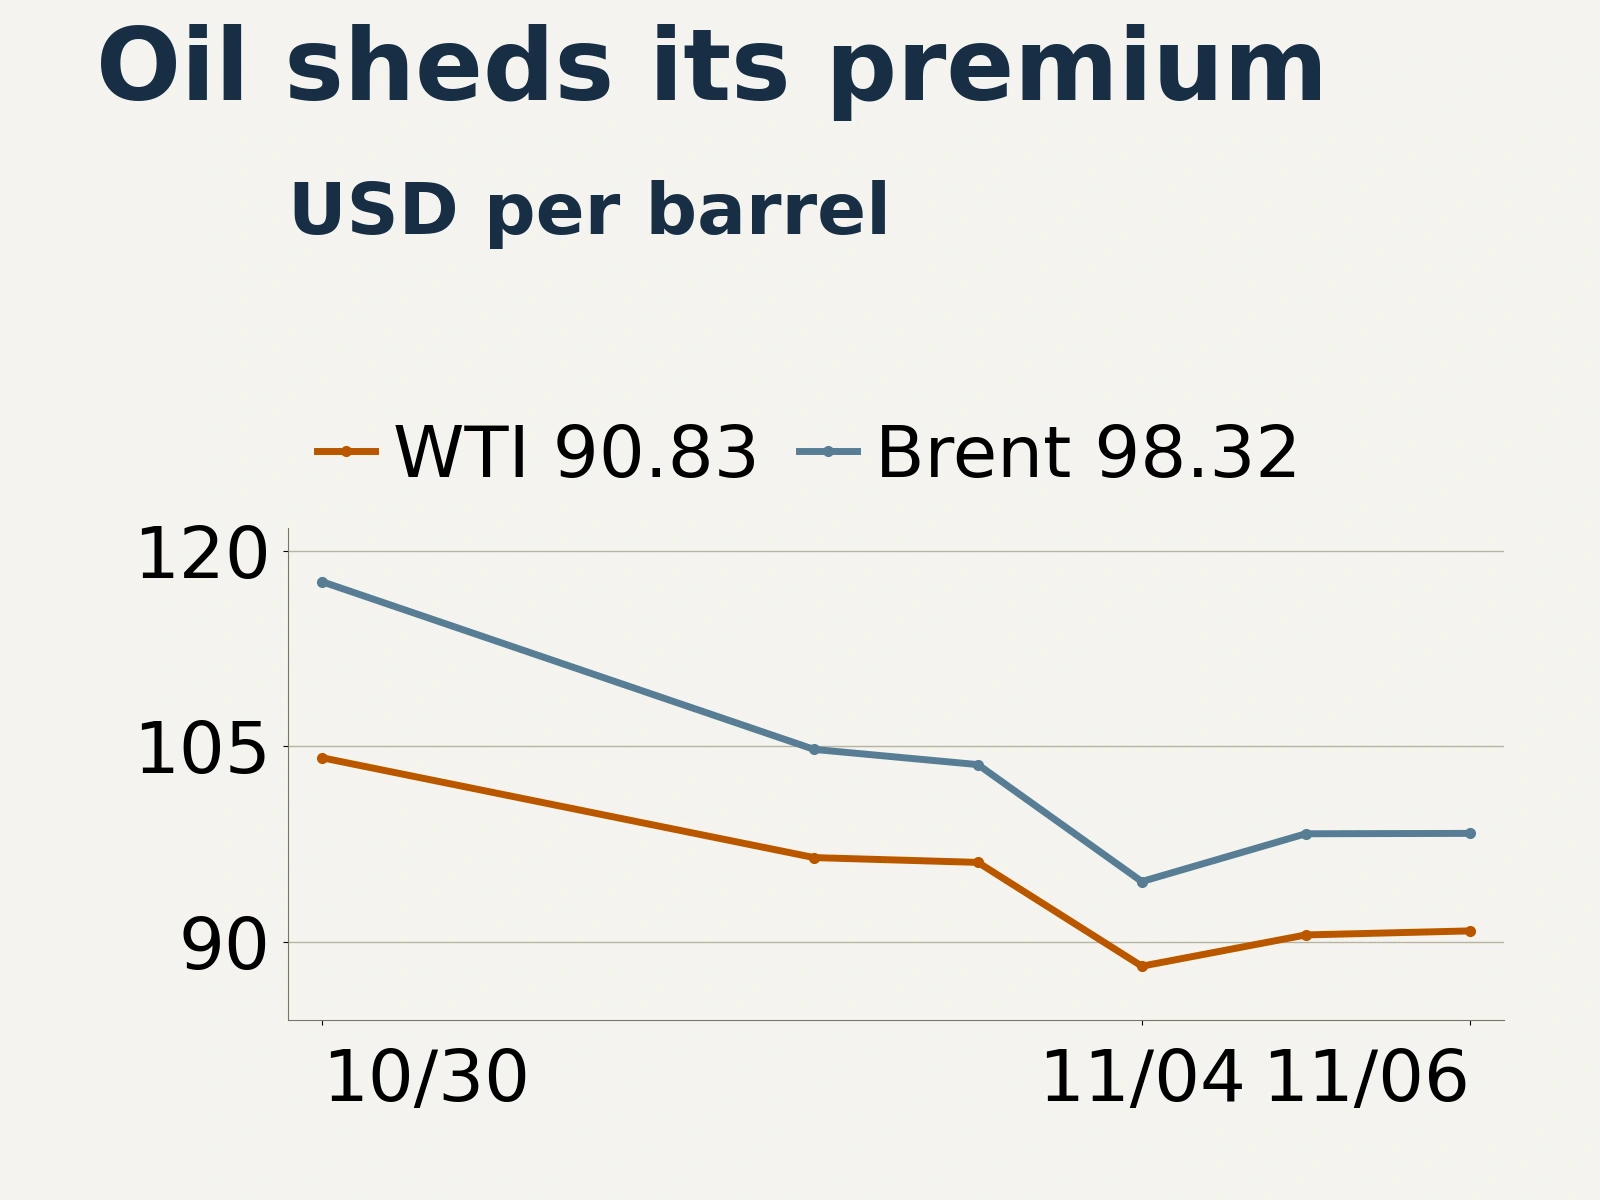
Oil and gold moved sharply in opposite directions. On November 6, the data provider’s daily continuous-futures close was $90.83 per barrel for WTI and $98.32 for Brent, down 12.76% and 16.42%, respectively, from $104.12 and $117.64 at the previous week’s close. Contract rolls may have affected the weekly changes, but the midweek drop in futures was also pronounced. On November 4, WTI and Brent fell to $88.12 and $94.62 per barrel, respectively. Reuters attributed the sharp decline that day to growing post-election expectations of renewed U.S.–Iran talks and improved Middle Eastern energy supplies. Any actual increase in supply still hinges on substantive progress in diplomacy and shipping arrangements.
U.S. inventory data showed little sign of easing in the physical market. EIA data released November 4 showed that in the week ended October 30, commercial crude inventories fell by 865,000 barrels to 409.8 million barrels. Gasoline inventories fell by 222,000 barrels and distillate stocks by about 3.6 million barrels, while refinery utilization rose to 94.5%. The continued drawdown in product inventories and high refinery utilization suggest the weekly oil sell-off mainly reflected a reversal of the geopolitical supply risk premium. The physical data did not point to a collapse in near-term consumption.
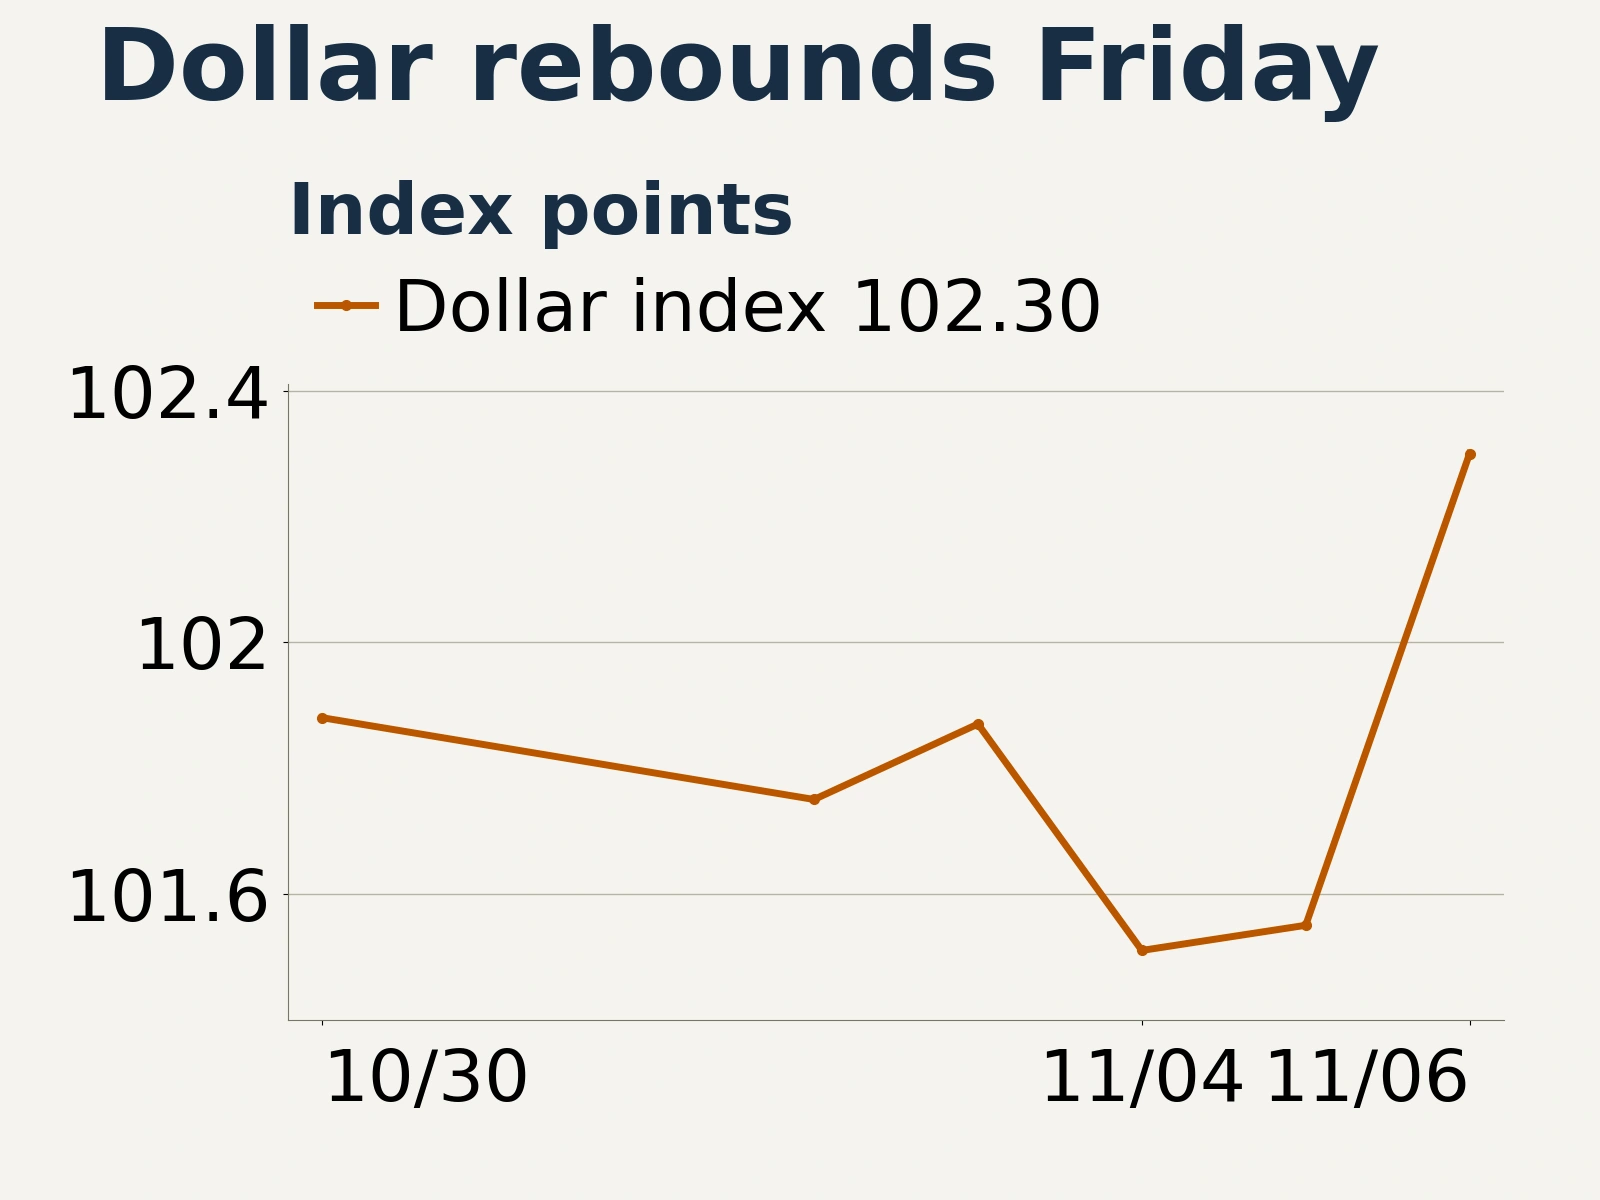
Continuous gold futures rose 4.51% for the week, from $3,898.90 to $4,074.90 per ounce. From Tuesday to Thursday, November 3–5, gold rose from $3,940.40 to $4,113.50 per ounce. Over that stretch, the U.S. Dollar Index slipped from 101.87 to 101.55 and the 10-year Treasury yield fell from 4.95% to 4.84%, lowering the opportunity cost of holding gold, which pays no interest. The dollar and Treasury yields rebounded on Friday after the strong payrolls report, and gold gave back some of its gains.
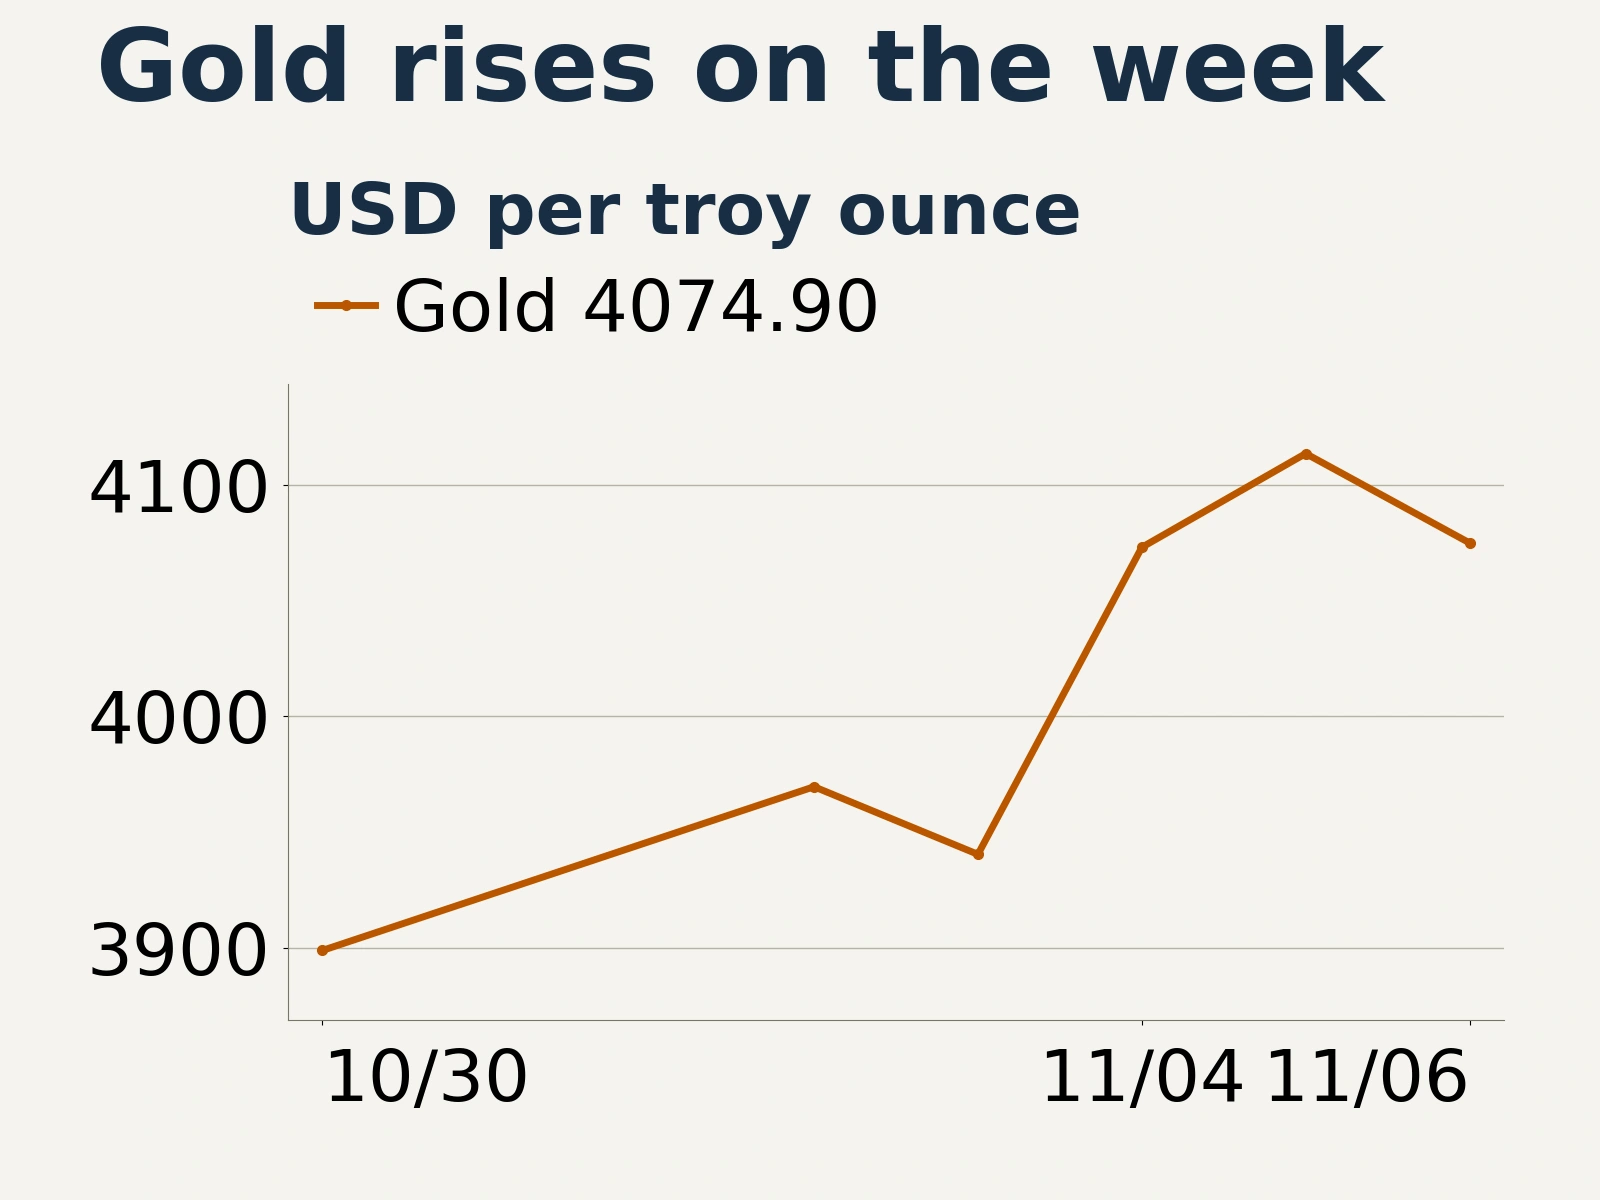
For the week as a whole, the Dollar Index rose 0.41% to 102.30, yet gold still posted a substantial gain. A midweek decline in yields, a jump in equity volatility, and investors’ reassessment of growth and inflation risks all helped draw money into gold.
Japan and South Korea fall more than 9% on the AI sell-off, while policy and tariff expectations lift the Hang Seng 5.10%

Major Asia-Pacific indices diverged sharply over the week. Comparing the November 6 and October 30 local closes in local currency, Hong Kong’s Hang Seng Index rose 5.10% to 24,481.86. Japan’s Nikkei 225 fell 9.25% to 57,434.77 and South Korea’s KOSPI dropped 11.71% to 5,059.69.
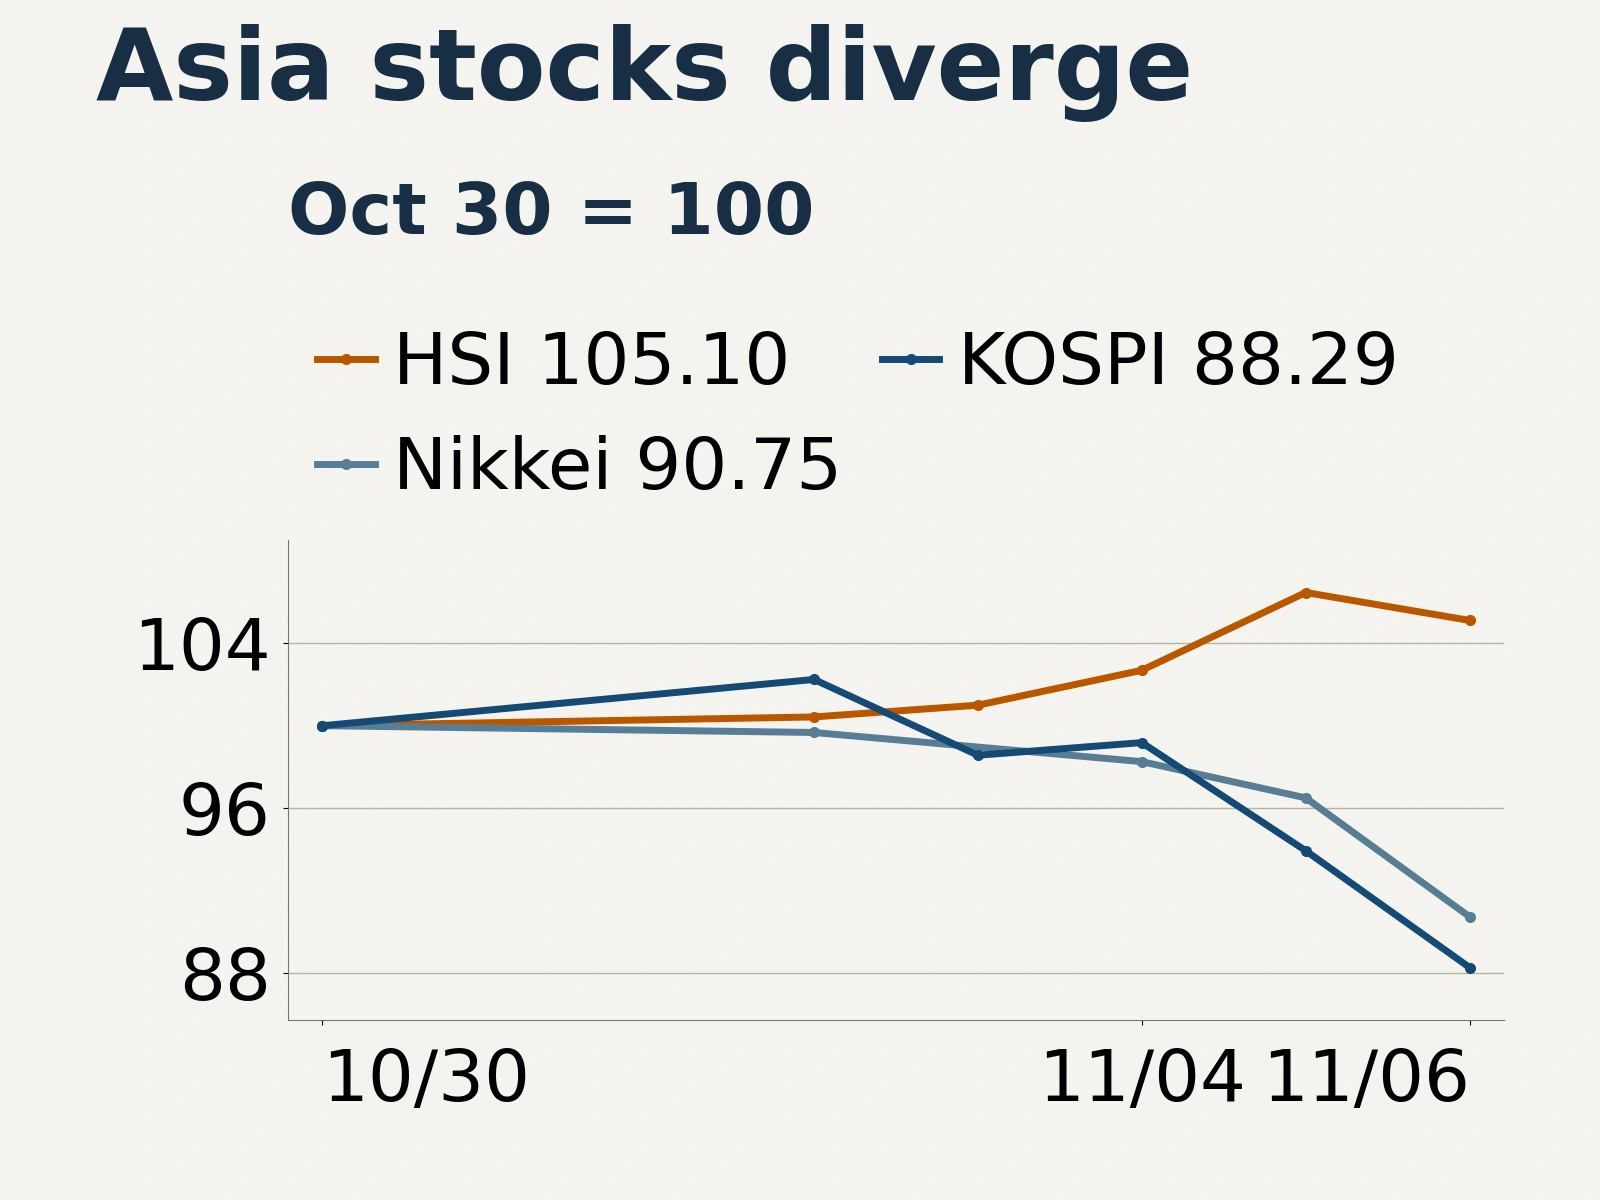
With large semiconductor and hardware weightings, Japanese and South Korean equities were directly exposed to the reassessment of U.S. AI capital spending. The Associated Press reported that on November 5, South Korea’s Samsung Electronics and SK Hynix fell 7.6% and 9.4%, respectively. In Japan, Tokyo Electron declined 9.5%, and chip-testing equipment maker Advantest tumbled 15%. Memory chipmakers and suppliers of wafer fabrication and testing equipment are highly sensitive to construction progress and the fulfillment of orders tied to North American data center projects. Hong Kong’s different sector mix and valuations left it less exposed to the direct effects of the global hardware sell-off.
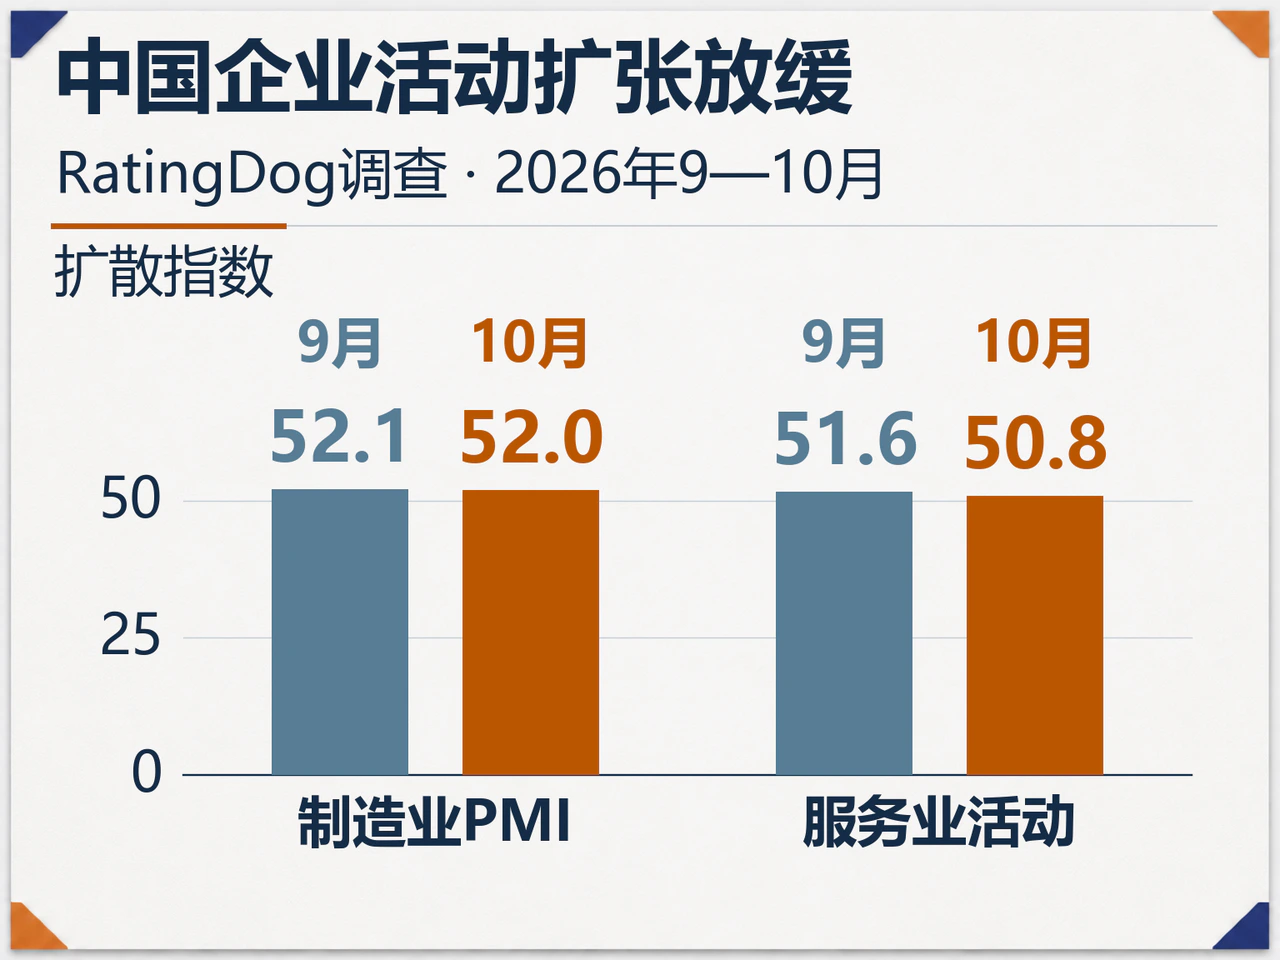
China’s data showed output expanding even as margins came under pressure. The October RatingDog China manufacturing PMI, released November 2, eased to 52.0 from 52.1 in September, though output expanded at the fastest pace since April. The services business activity index, released November 4, fell from 51.6 to 50.8. New business and employment in services continued to expand, but input cost inflation reached a five-month high and selling prices fell for the second straight month. Whether steady output growth translates into profits depends on pricing power and operating efficiency as companies contend with rising costs and falling selling prices.
China offered additional policy support to its capital markets during the week. On November 4, the People’s Bank of China cut the rate on its relending facility for share buybacks and stake increases by 0.25 percentage points to 1%. Xinhua Finance reported that after a meeting on the facility, commercial banks had submitted quota applications totaling more than RMB 200 billion. Lower funding costs make it easier for listed companies to carry out buybacks and stake increases. The effect on market liquidity will depend on how much credit is actually extended and how quickly companies act.
Shifting expectations for U.S. trade policy also lifted sentiment in Hong Kong. Swissquote analyst Ipek Ozkardeskaya said the relative strength of Chinese and European equities partly reflected investor expectations that a change in congressional control would increase pressure on the U.S. administration to adjust tariffs. On November 8, CNBC reported that Democrats were preparing legislation for the next Congress to restore congressional authority over trade and planned to prioritize tariffs on Canada. The proposals still face Senate procedural hurdles and the possibility of a presidential veto, leaving exporters to operate under existing tariffs for now.
Across markets, the unwinding of the energy risk premium eased the hit from imported costs, even as investors demanded greater certainty about future returns and cash flows. For Treasury yields to keep falling, growth would need to slow and core inflation would need to ease. For U.S. technology stocks to stabilize, companies will need to translate rapid reported revenue growth into free cash flow. And the divergence across Asian markets shows that any recovery in valuations driven by shifts in expectations for U.S. trade policy ultimately needs support from stronger local corporate earnings.