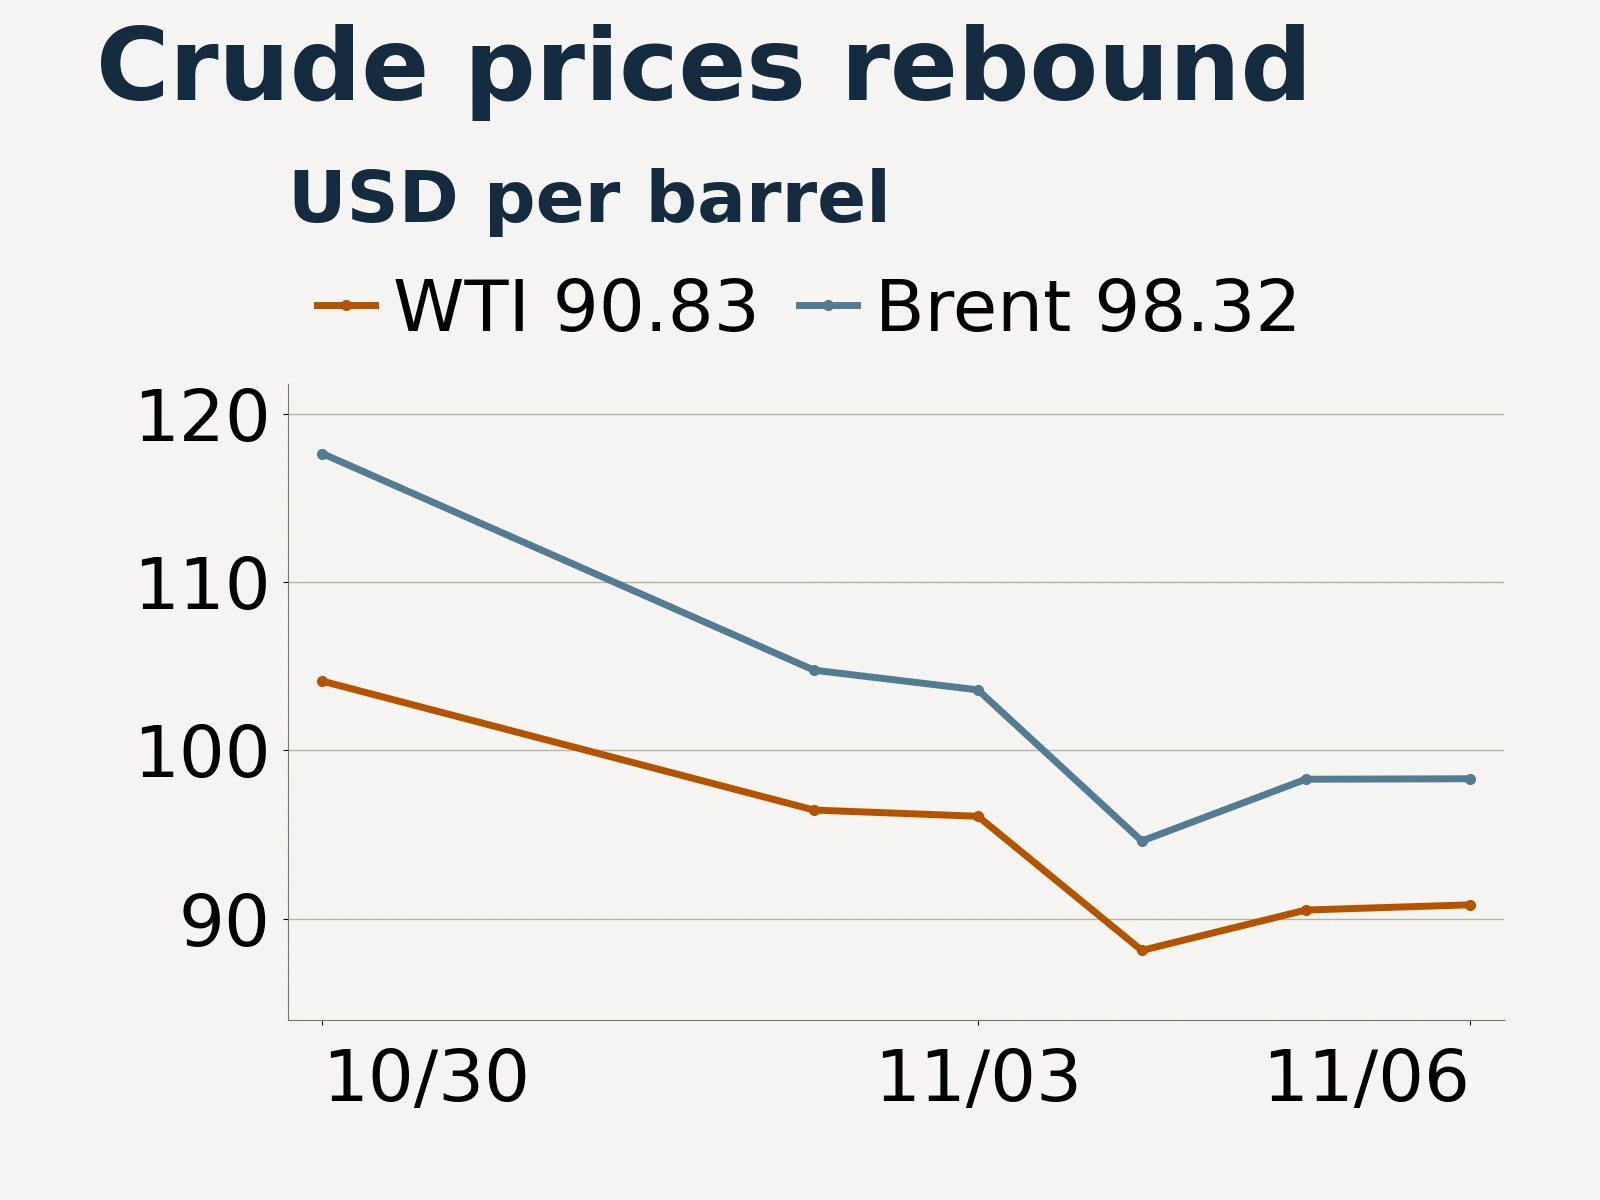
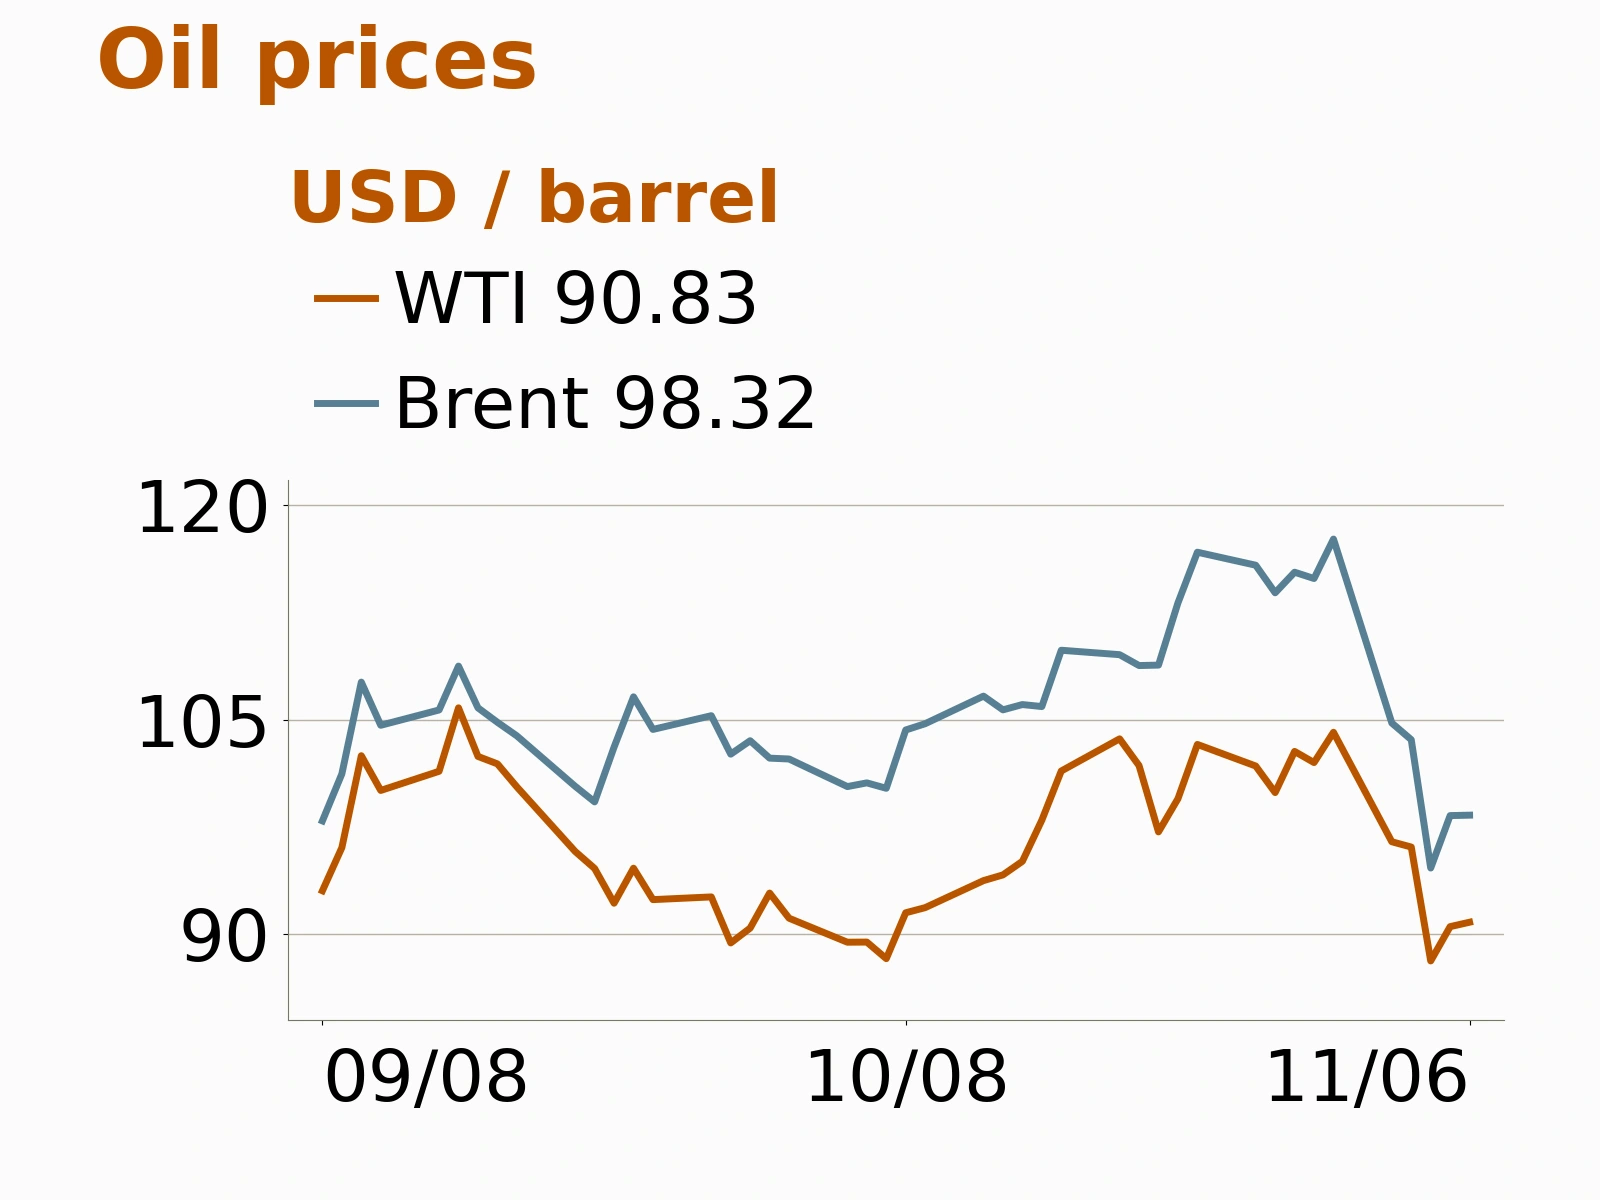
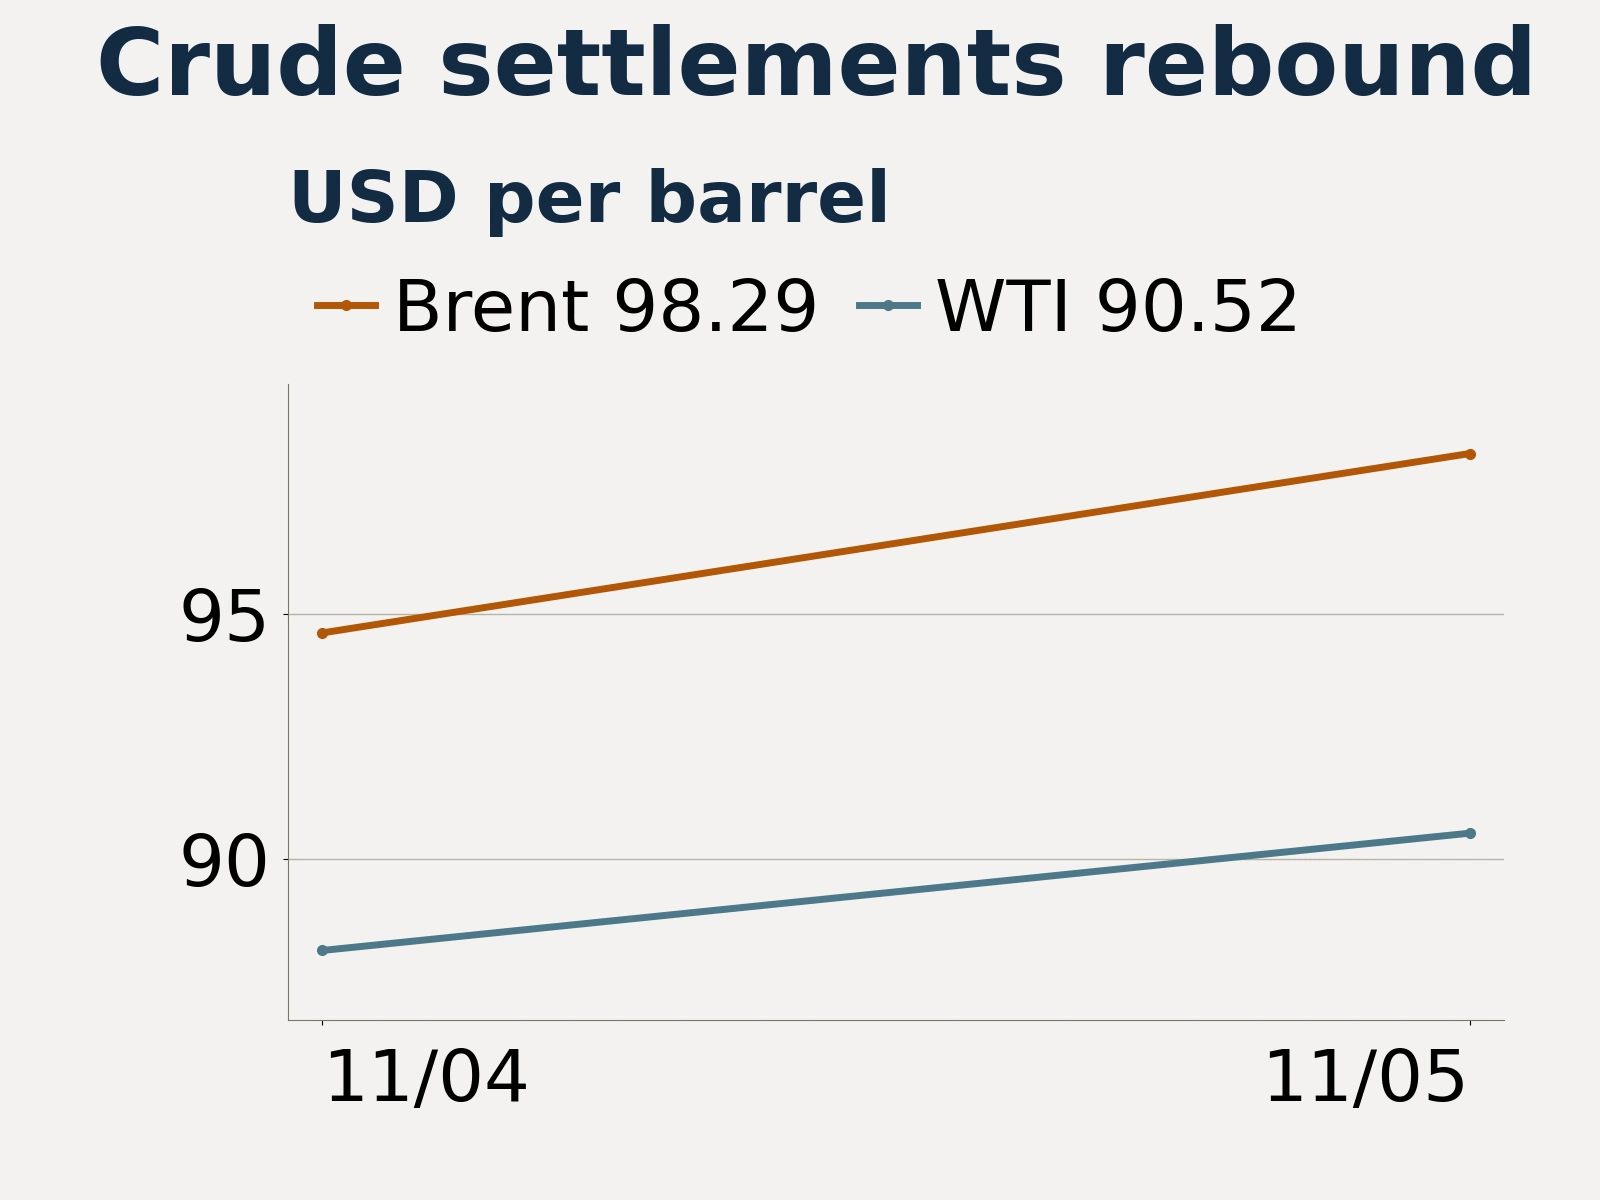
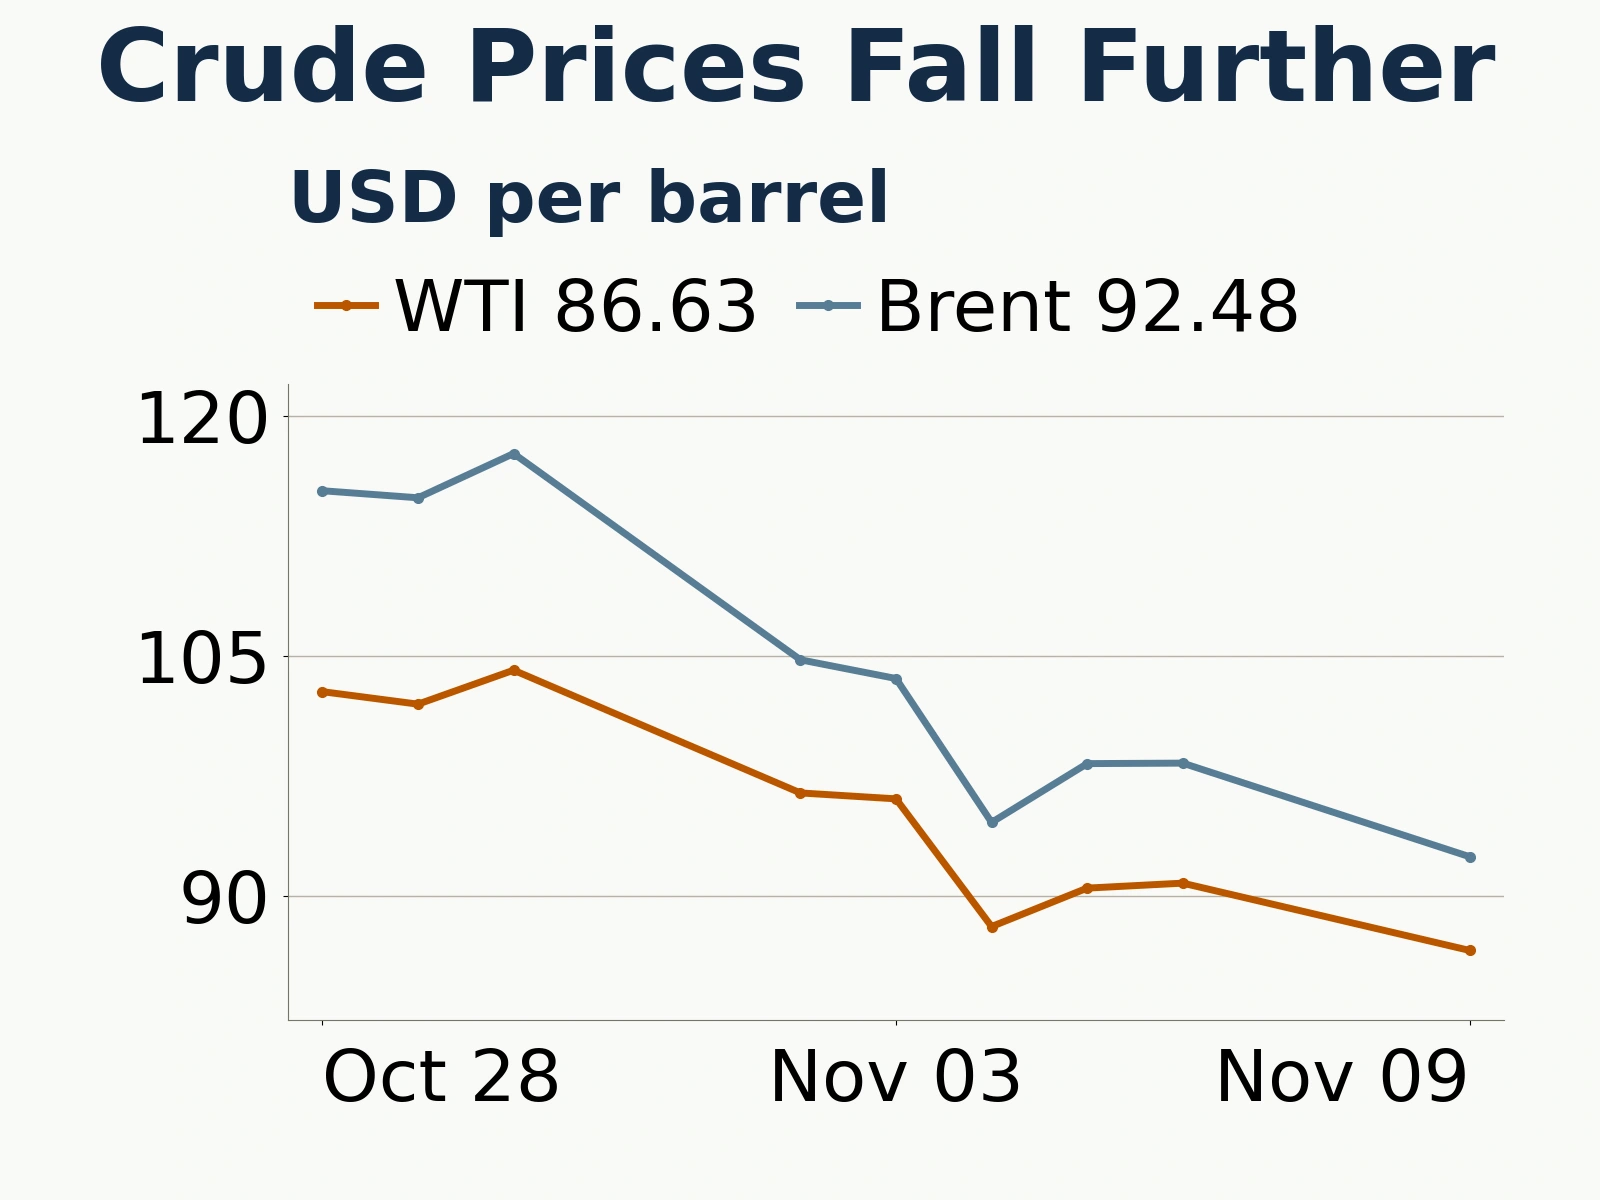
On November 9, 2026, global crude prices fell further. Using Yahoo Finance’s vendor-reported daily closes for continuous futures contracts, WTI closed at $86.63 a barrel, down 4.62% from November 6, while Brent fell 5.94% to $92.48. Both closed below every session of the previous week on the same basis. The market is pricing in a smaller premium for the conflict in the Middle East, and the recovery in physical supply is adding fundamental pressure to the selloff.
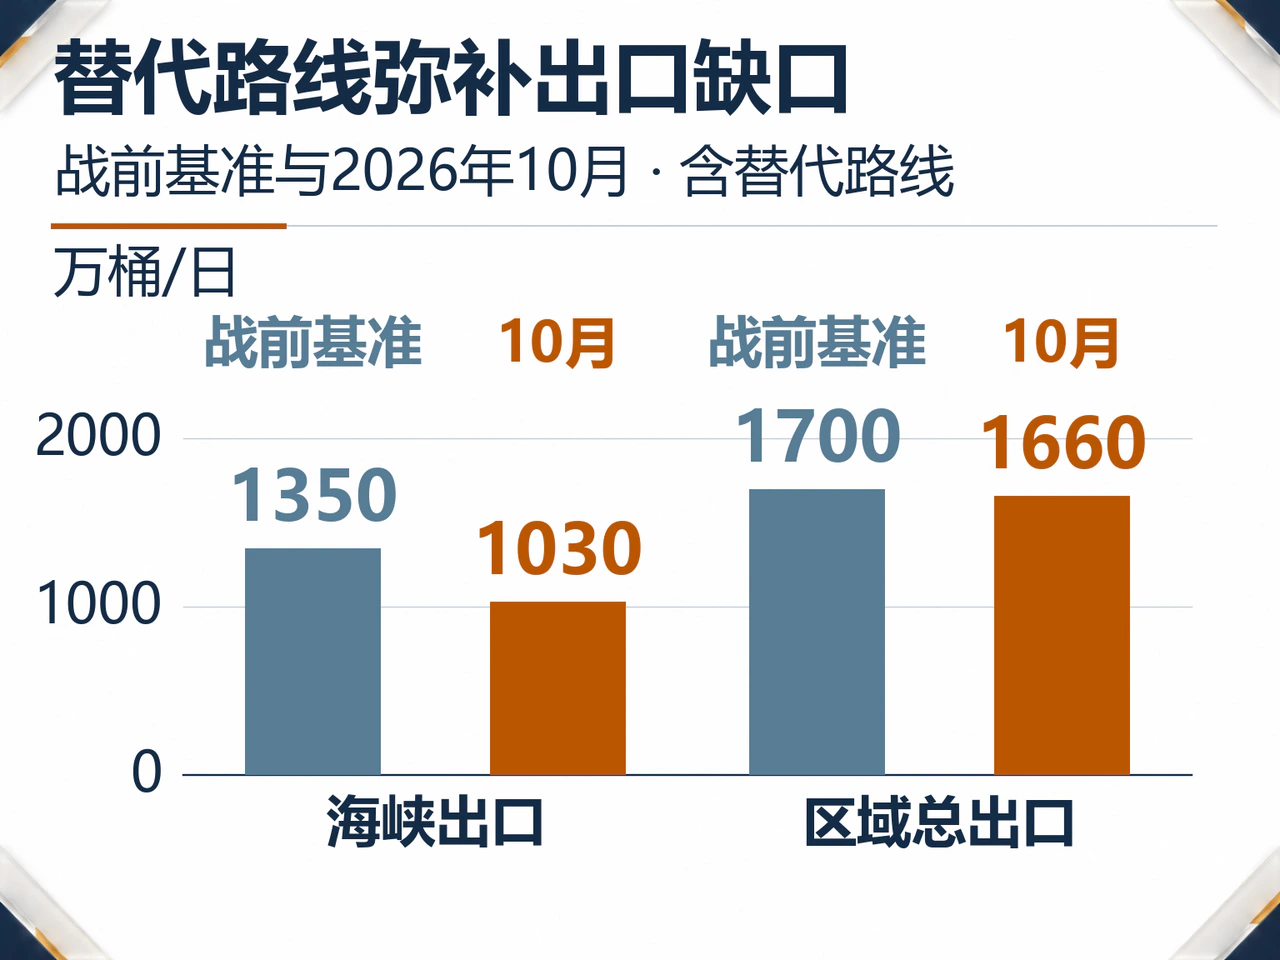
Hormuz exports fall to 10.3 million barrels a day, while alternative routes lift the regional total to 16.6 million barrels a day

Reuters reported that Trump said on Sunday he was “highly unlikely” to order another attack on Iran as long as talks to end the conflict made progress. Oil prices extended their decline after the remarks. Shipping security has yet to improve in step. Both the United States and Iran continued to report attacks on vessels near the Strait of Hormuz, and Iran said talks depended on the United States first meeting certain conditions.
The shift in oil flows has a more direct effect. Iraq’s foreign minister said on Sunday that Iraq had reached an understanding with the United States allowing Iraqi oil to transit the strait via a shipping lane near Oman. After an attack on Saudi Arabia’s East–West Pipeline, a Saudi energy sector source said the fire had been extinguished and pipeline operations were unaffected. So far, the pipeline attack and restrictions on passage through the strait have affected oil prices mainly through risk and costs, with no comparable new loss of supply yet.
A Reuters column citing Kpler data put October crude exports through the Strait of Hormuz at an average of 10.3 million barrels a day, down from 13.5 million before the war. Including alternative routes through Saudi Arabia’s port of Yanbu and the UAE’s Fujairah, regional crude exports reached 16.6 million barrels a day, close to the prewar level of 17 million. Strait traffic alone overstates the export loss. Rerouting, pipelines and transshipment are restoring supply that can reach buyers.
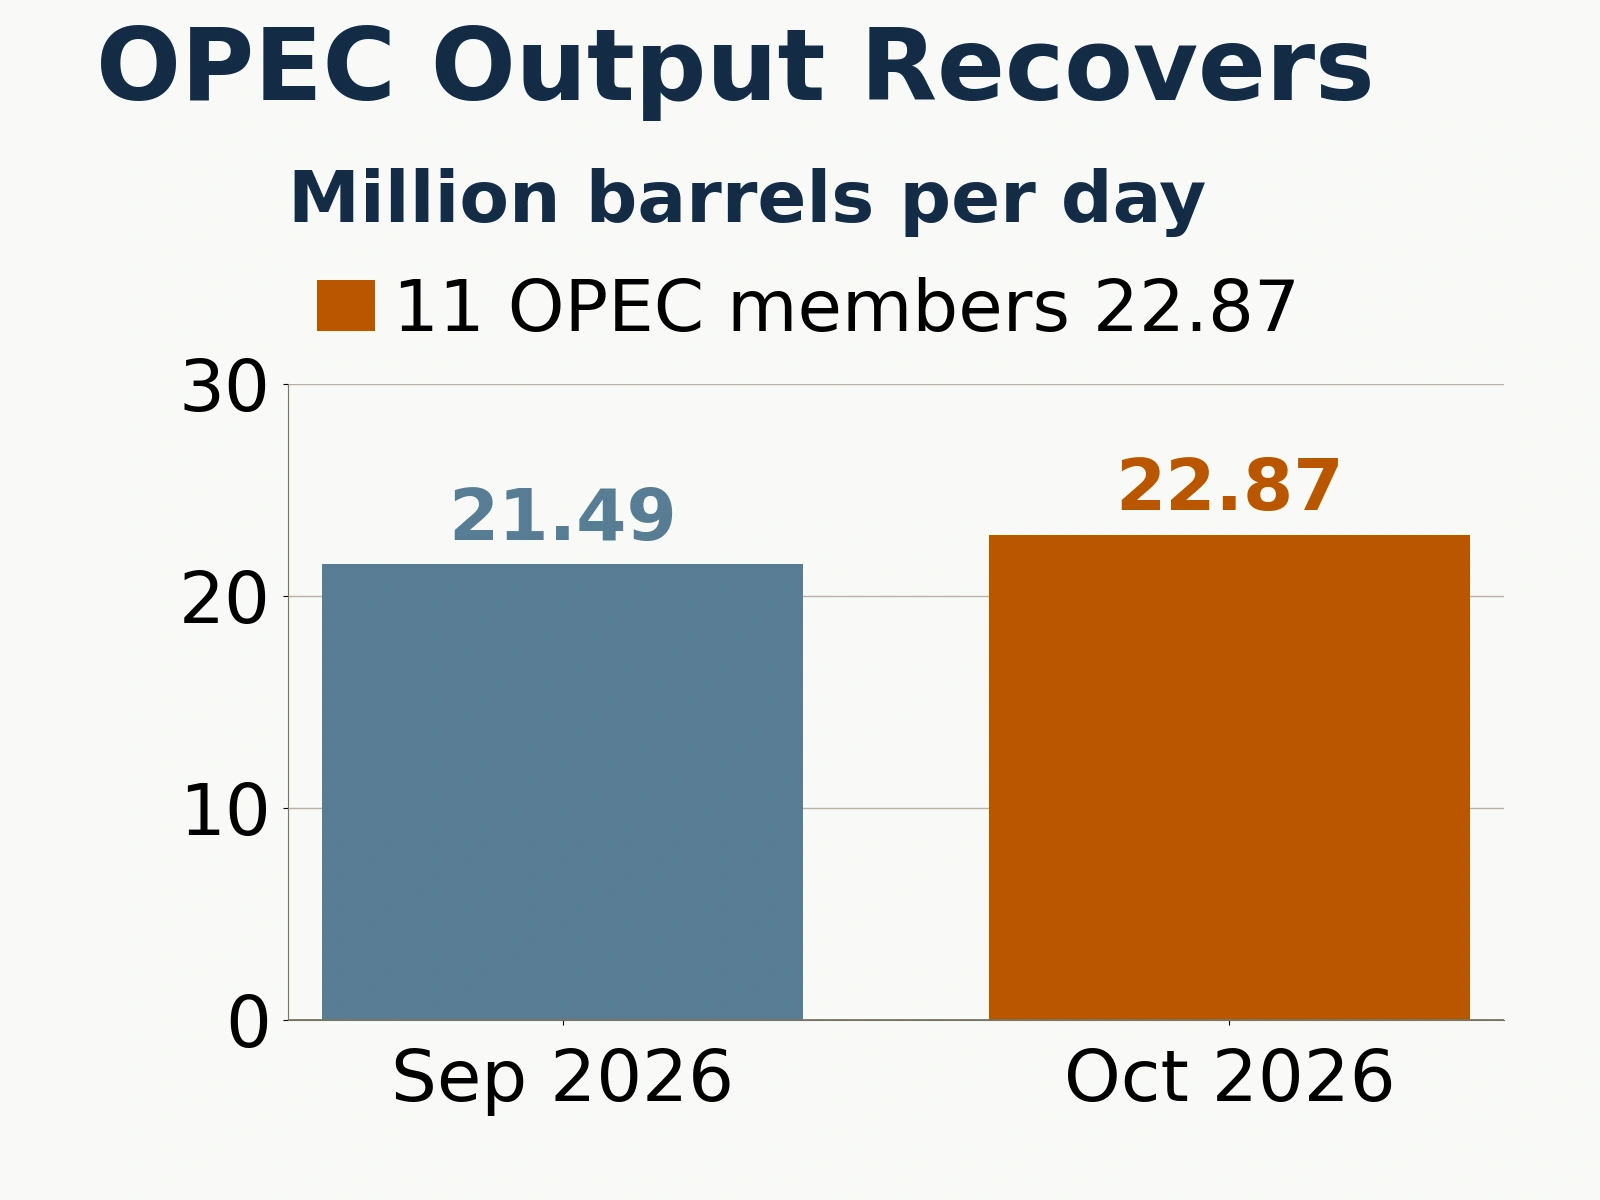
Production is also recovering. A Reuters survey put October crude output from 11 OPEC members at 22.87 million barrels a day, up 1.38 million from September, with Saudi Arabia, Kuwait and Iraq accounting for most of the increase. On November 1, seven OPEC+ countries decided to keep December’s required production at September levels. Production targets remain steady as actual output and exports recover.
Physical crude moves to a discount while Brent futures stay backwardated

The supply recovery is first putting pressure on physical sellers’ bargaining power. Morgan Stanley said in a Monday report that Dated Brent, a benchmark used to price crude cargoes globally, had slipped to a discount to front-month Brent futures. Weaker prices for physical cargoes suggest that news of the talks explains only part of the selloff. Buyers have more cargoes to choose from.
Demand and refining capacity have recovered more slowly. The Reuters column noted that high oil prices have held back consumption, while damage to some refineries in the Middle East and Russia has limited crude processing capacity. The resumption of crude shipments may take time to translate into higher gasoline and diesel output. With refineries limited in how much they can buy, the pressure will show up first in crude.
Meanwhile, front-month Brent still trades above later-dated contracts, keeping the futures curve backwardated. The physical discount compares cargo prices with front-month futures, while backwardation measures the spread between futures for different delivery months. The physical discount reflects pressure in spot trading. The futures spread still prices in the risk of near-term shipping disruption, low inventories and renewed conflict. Lower deferred prices also make it less profitable to buy crude for storage and sell it later, increasing the need to find buyers for additional supply now.
Strategic reserves hit their lowest since 1982, with no broad easing evident in inventories
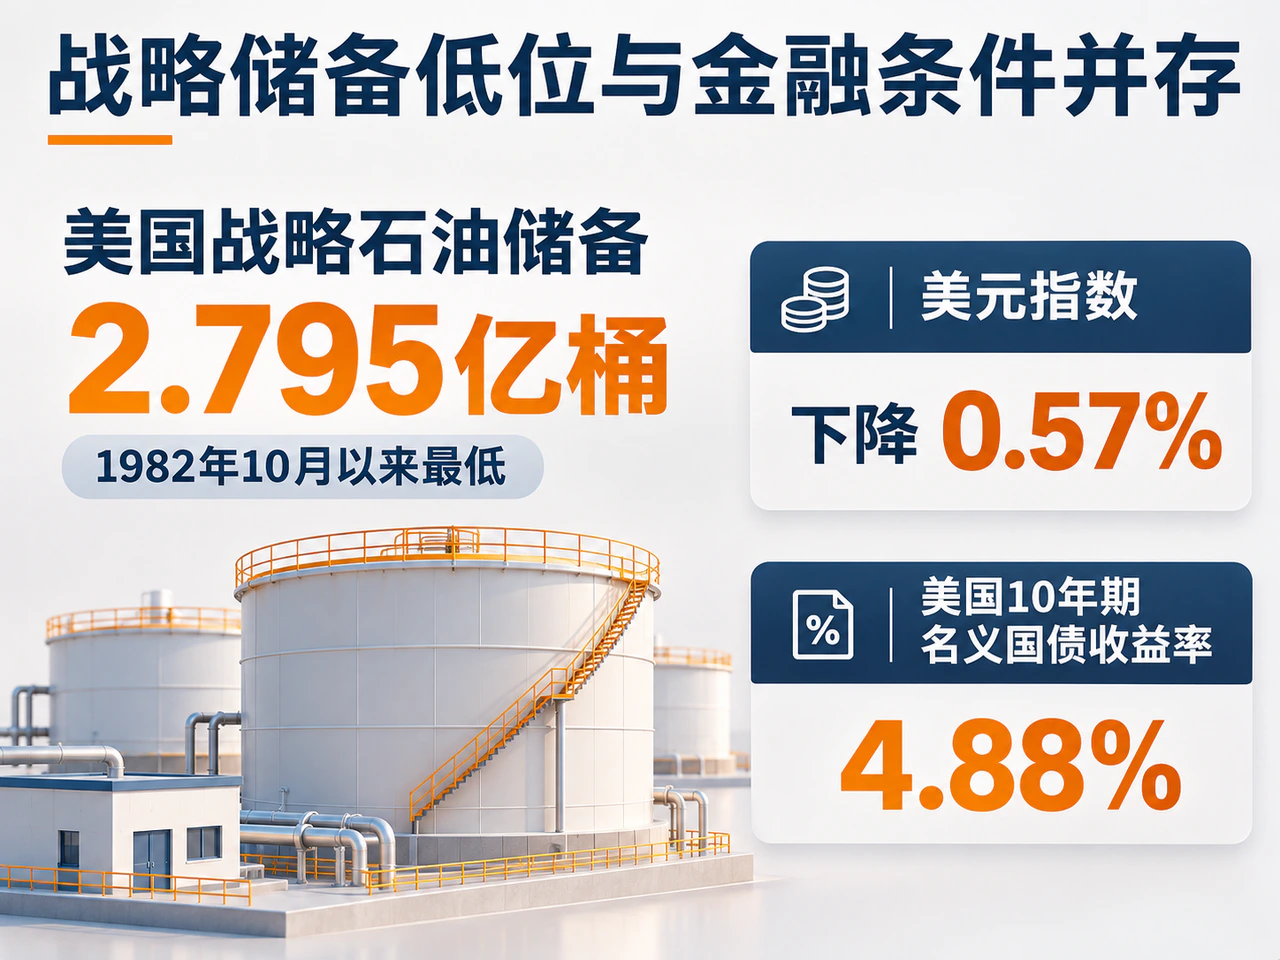
Inventories have yet to confirm that supply has loosened across the market. Reuters reported on Monday that the U.S. Strategic Petroleum Reserve had fallen to 279.5 million barrels the previous week, its lowest level since October 1982. The figure covers strategic stocks and excludes commercial inventories. In its October monthly report, the EIA forecast a further drawdown in global inventories in the fourth quarter. The next update is due November 10.
Financial conditions offer a mixed explanation for the selloff. On the same daily-close basis, the U.S. Dollar Index fell 0.57%, a move that would typically lower the cost of oil for buyers using other currencies. The nominal yield on the 10-year U.S. Treasury rose 2 basis points to 4.88%. With crude falling sharply even as the dollar weakened, the recovery in supply and changes in the risk premium offer a better explanation for the move.
Supply flows are recovering while inventories remain low. That makes it easier for oil prices to adjust lower, but another shipping disruption could quickly interrupt the decline.
Will exports hold up, and will inventories start to build?

Actual export volumes through the strait and alternative routes will determine whether the supply recovery can last. The Dated Brent discount and the spread between near- and longer-dated futures will show whether looser supply is feeding through from cargoes into the futures curve. Commercial inventories and refinery utilization will indicate whether refineries are processing the additional crude or it is starting to accumulate in storage. Revisions to production outages and the inventory outlook in the EIA’s next monthly report will show whether its forecasts are keeping pace with the recovery.
If exports keep rising, the physical discount persists and inventories start to build, supply and demand will give oil prices a firmer basis to move lower. If shipping is disrupted again, or if restarting refineries increases crude purchases faster than supply recovers, today’s low inventories will amplify any rebound. For now, the return of supply has begun to weigh on prices, while shipping security and inventories have yet to recover fully.