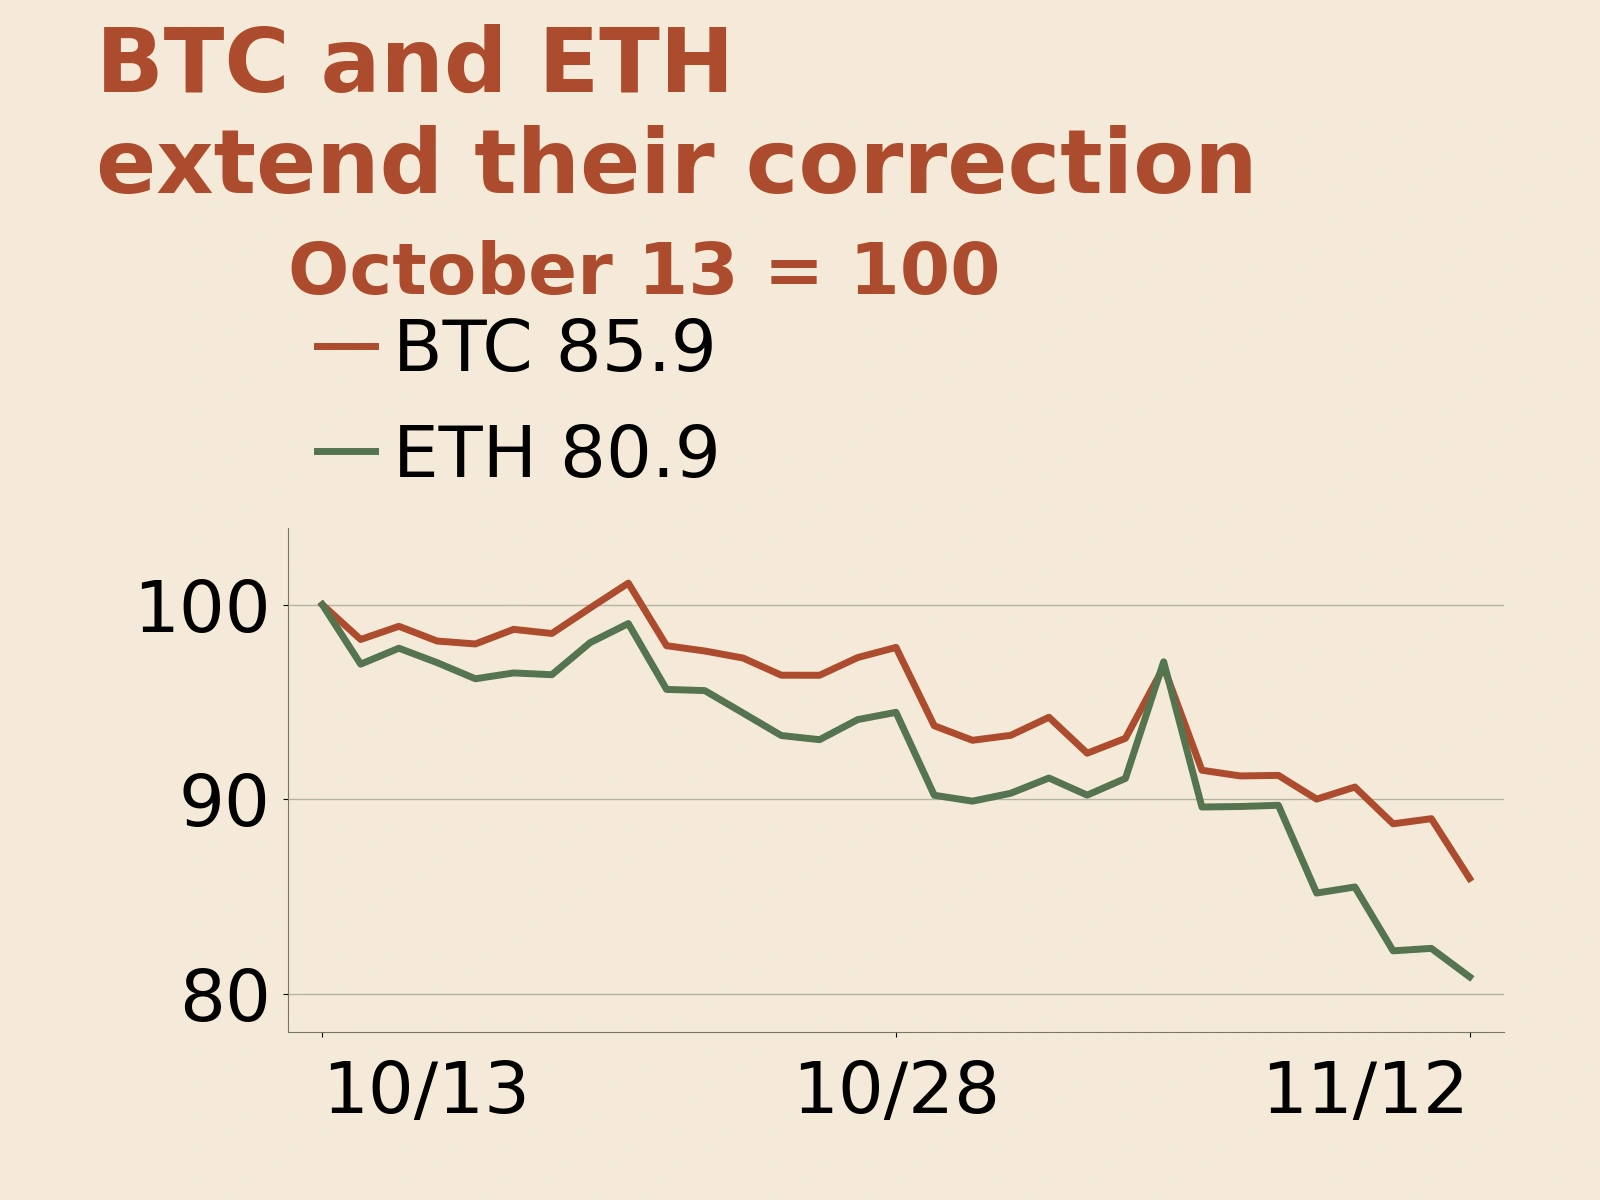
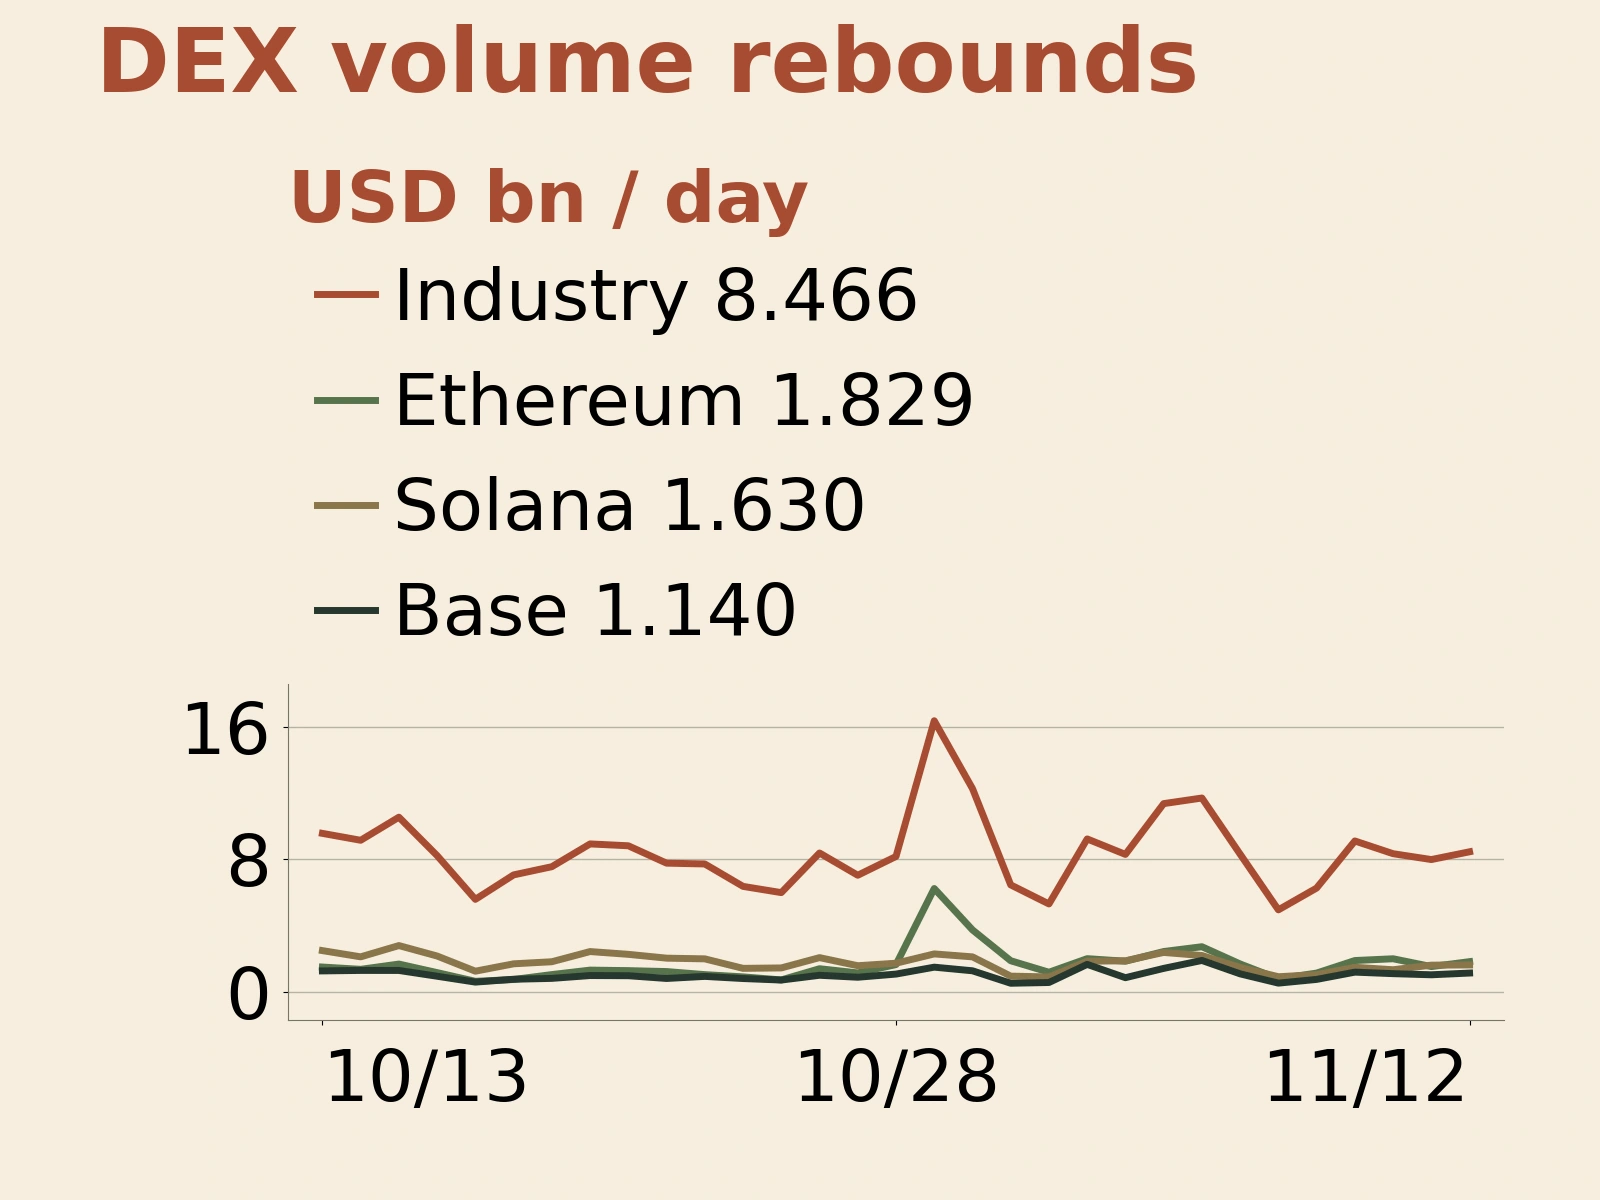
On November 12, 2026, Binance's UTC daily spot candle showed Bitcoin closing at 71,460 USDT, down 3.45% from the previous day. All three settled funding rates for Binance's BTCUSDT perpetual contract were positive that day. Bitcoin's price fell, yet leveraged longs continued to pay, while investment allocations and cash within the market kept contracting. The latest complete figures for US spot ETFs and stablecoins also point to capital withdrawals: the appetite to hold risk assets and bet on a rebound has not entirely faded, but the fresh cash available to absorb selling is weakening.
ETFs record five straight days of net outflows; stablecoin supply falls $14.747 billion in 30 days
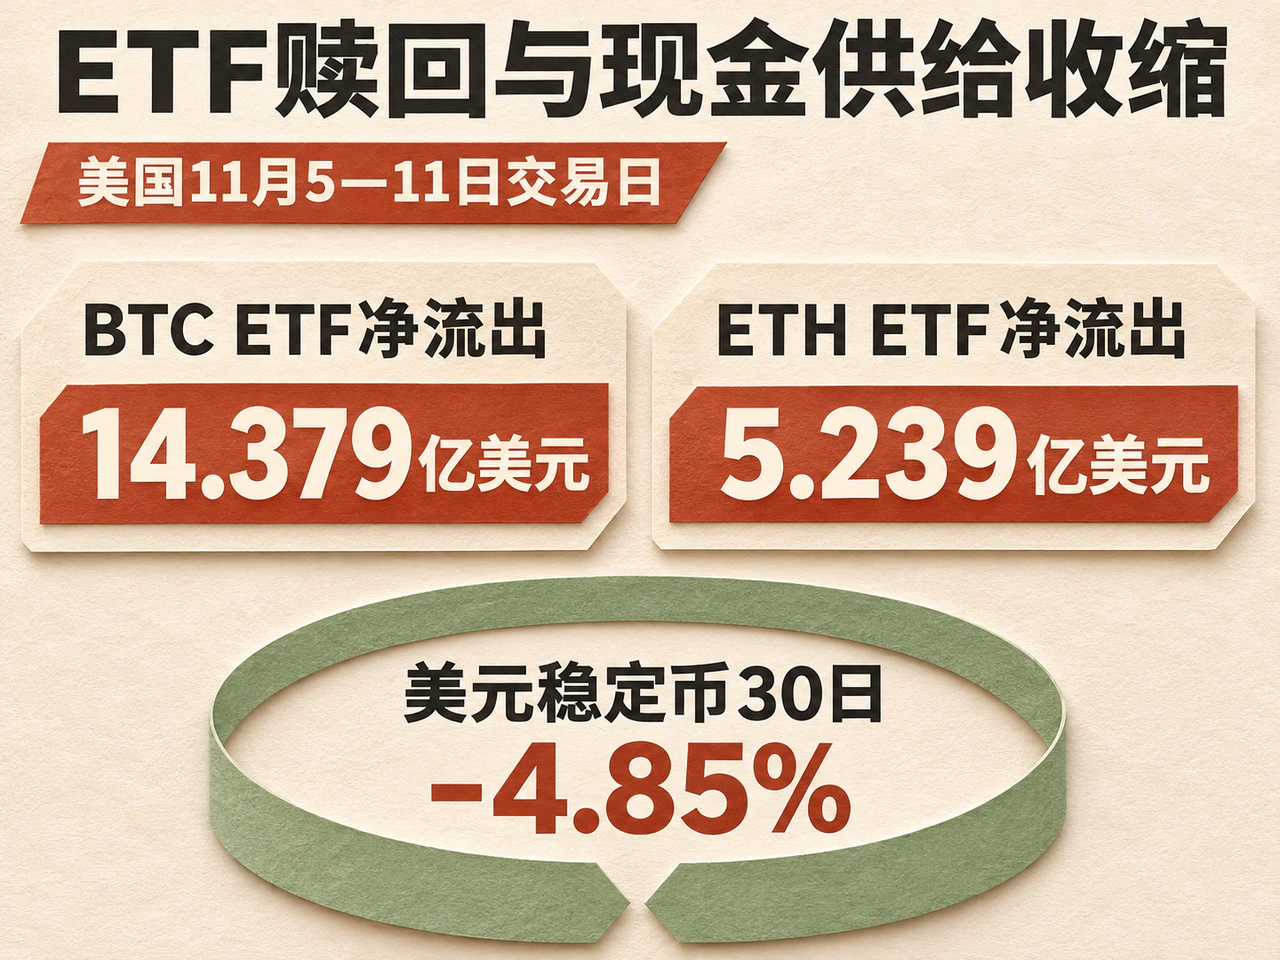
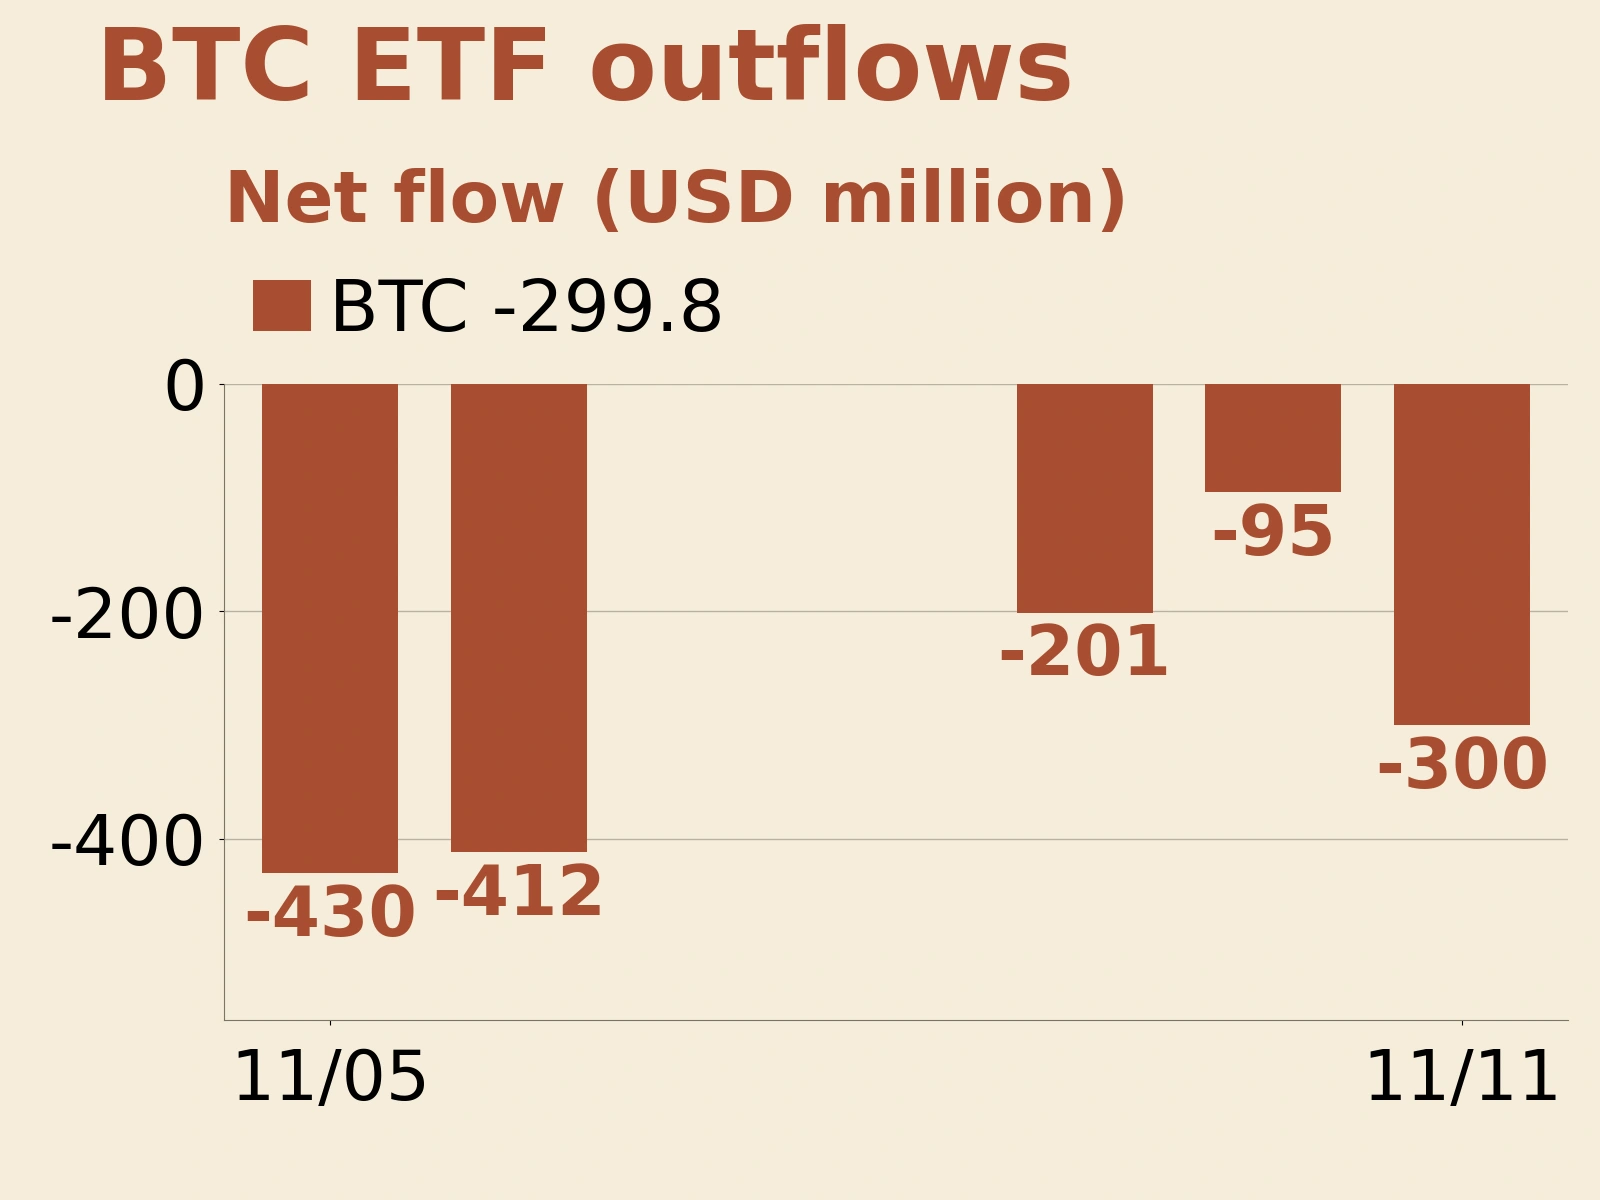
Farside data show that US spot Bitcoin ETFs recorded net outflows of $299.8 million in the November 11 US trading session, their fifth consecutive trading day of net withdrawals. Across the five trading days from November 5 to 11, cumulative net outflows reached $1.4379 billion, with money leaving every day. Net outflows briefly narrowed to $95 million on November 10 before widening again on November 11; a sustained narrowing trend has yet to emerge.
Outflows came mainly from the larger products. On November 11, BlackRock's IBIT recorded net outflows of $269.7 million and Grayscale's GBTC lost $39.1 million, while Morgan Stanley's MSBT attracted net inflows of $9 million. Subscriptions and redemptions in an individual product can also reflect its client mix, trading arrangements and the unwinding of arbitrage positions. Nevertheless, several consecutive days of industry-wide net outflows indicate that this channel has recently been reducing its overall Bitcoin exposure; subscription and redemption figures alone cannot identify the specific motives for selling.
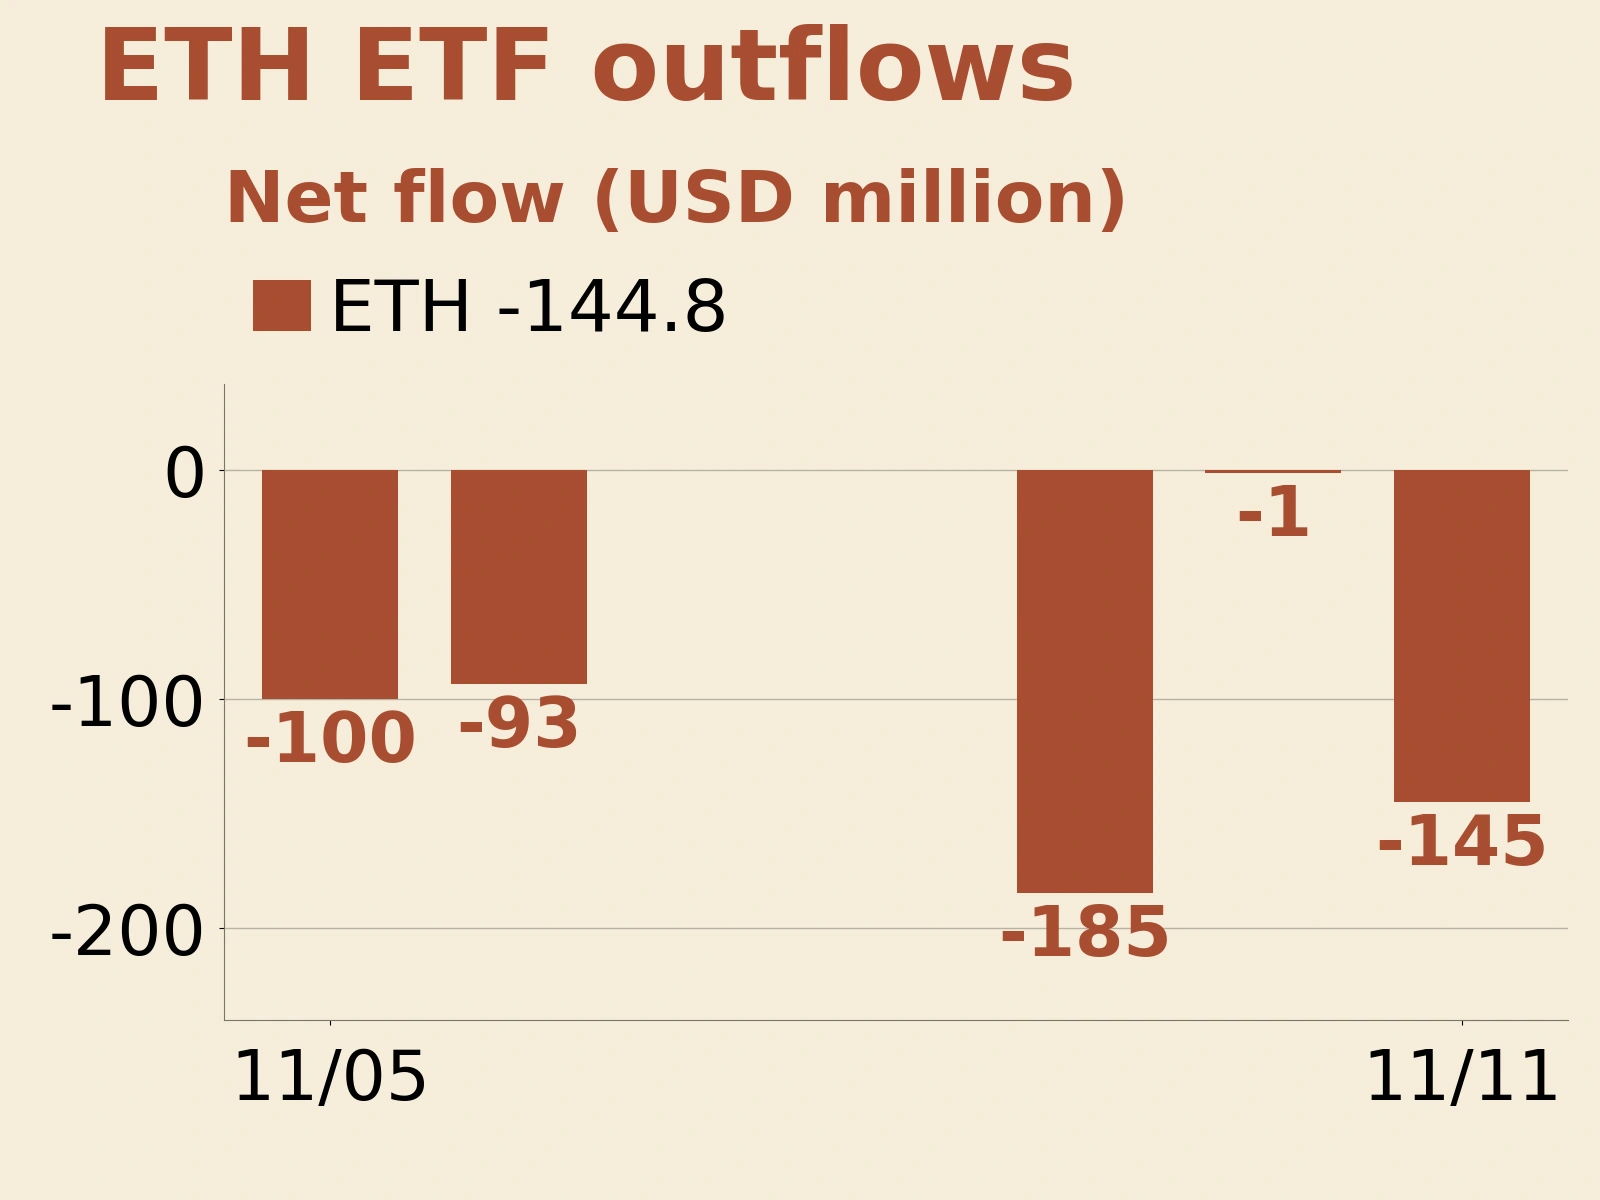
Spot Ethereum ETFs also face redemption pressure. In the November 11 US trading session, the market recorded net outflows of $144.8 million, including $129.8 million from ETHA. Cumulative net outflows over the latest five trading days totaled $523.9 million. The contraction in investment allocations now encompasses both Bitcoin and Ethereum, with ETF flows yet to show a broad rotation from the former into the latter.
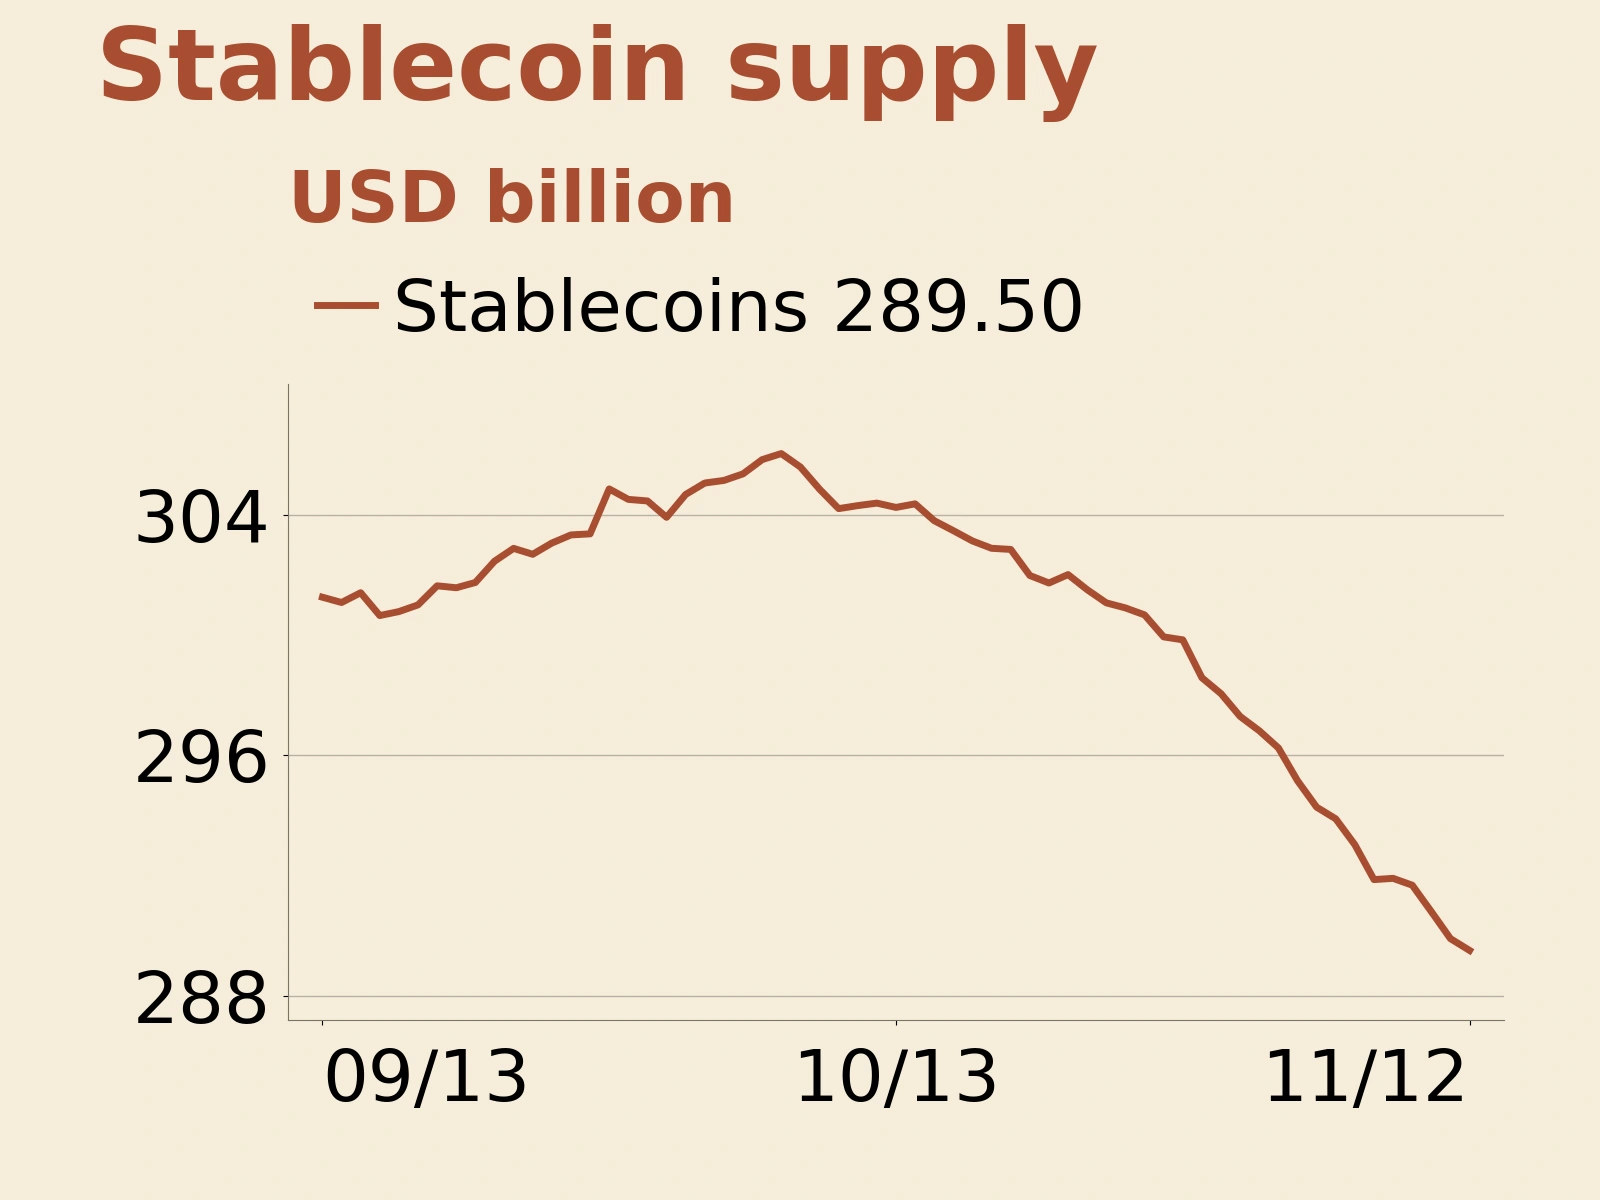
The supply of dollar tokens within the market is contracting as well. DefiLlama's series, labeled by UTC date, shows that the circulating face value of dollar-pegged stablecoins stood at $289.503 billion on November 12, down $4.381 billion from seven days earlier and $14.747 billion, or approximately 4.85%, from 30 days earlier. This measure compares circulating face values and excludes valuation changes caused by stablecoin prices deviating from par.
Stablecoins serve trading, payments, collateral and settlement, so a change in their outstanding supply cannot be converted into an equivalent amount of Bitcoin selling. For funding conditions, the measure captures the supply of dollar tokens available for use on-chain and on trading platforms. Reduced ETF holdings and falling stablecoin circulation weaken sustained buying support through the investment-allocation and trading-cash channels, respectively. Capital may still be seeking opportunities within the market, but a broad advance requires stronger spot demand to offset redemptions and the contraction in cash.
In its weekly report published on November 11, Glassnode had already linked stablecoin contraction and ETF net selling to weak US spot demand, using data through November 9. The updated ETF and stablecoin figures in this report show that the same direction persists. Whether cash supply can stop declining offers a more meaningful test of the market's ability to attract outside capital again than a one-day price rebound.
Bitcoin funding rises to 0.008904%; options notional open interest falls 1.47%
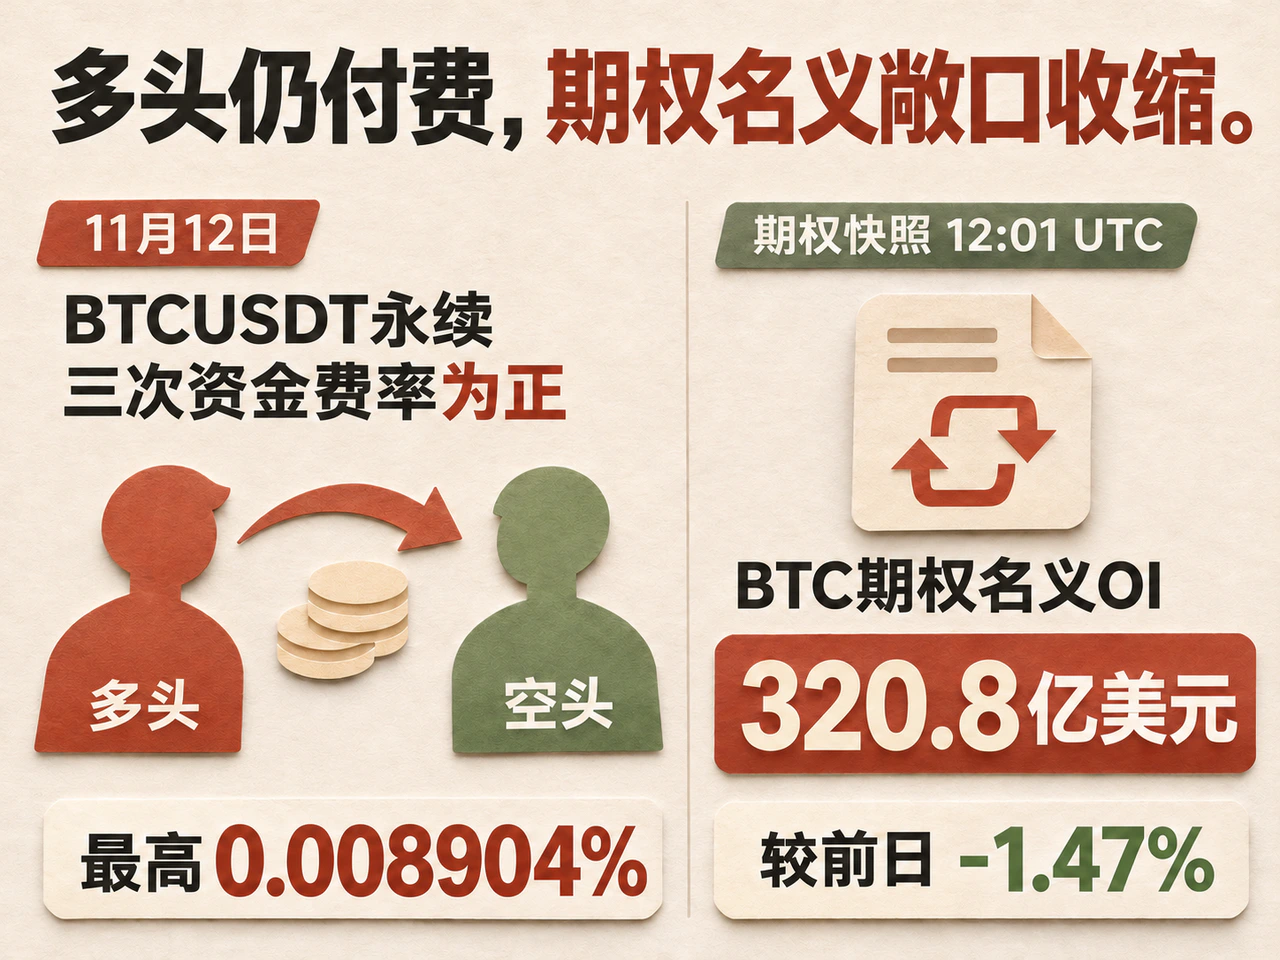
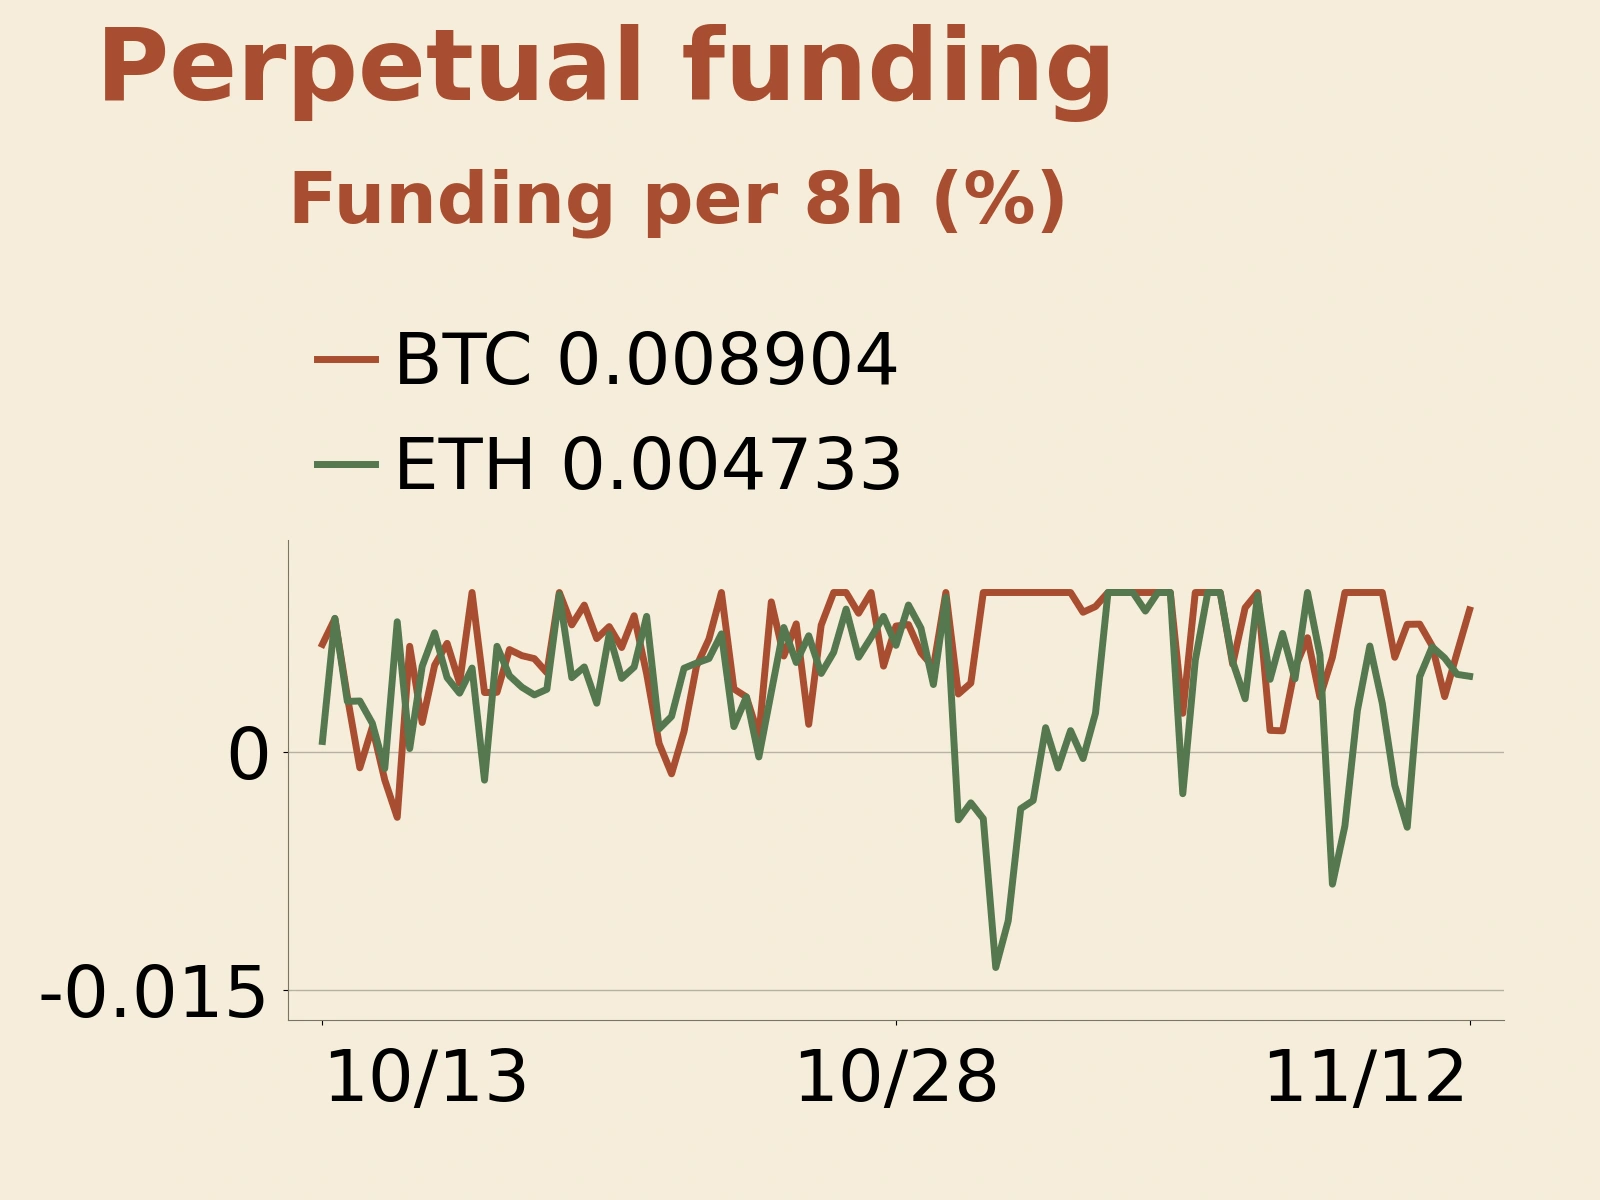
The settled funding rates for Binance's BTCUSDT perpetual contract at 00:00, 08:00 and 16:00 UTC on November 12 were 0.003453%, 0.006220% and 0.008904%, respectively. All were positive, meaning longs paid shorts. The three rates for the ETHUSDT perpetual contract that day were 0.005883%, 0.004854% and 0.004733%. Longs paid in all three periods as well, though the rate declined with each settlement.
Funding rates followed different paths for the two assets: as Bitcoin's price fell, the rate paid by longs in the day's final period exceeded that in the first, whereas Ethereum's rate eased. Funding rates reflect the pricing of perpetual contracts relative to spot and demand for long and short positions; they do not measure the size of newly established long positions. At least on Binance, however, the price decline has not turned funding rates universally negative, and positions betting on a rebound are still paying to stay open.
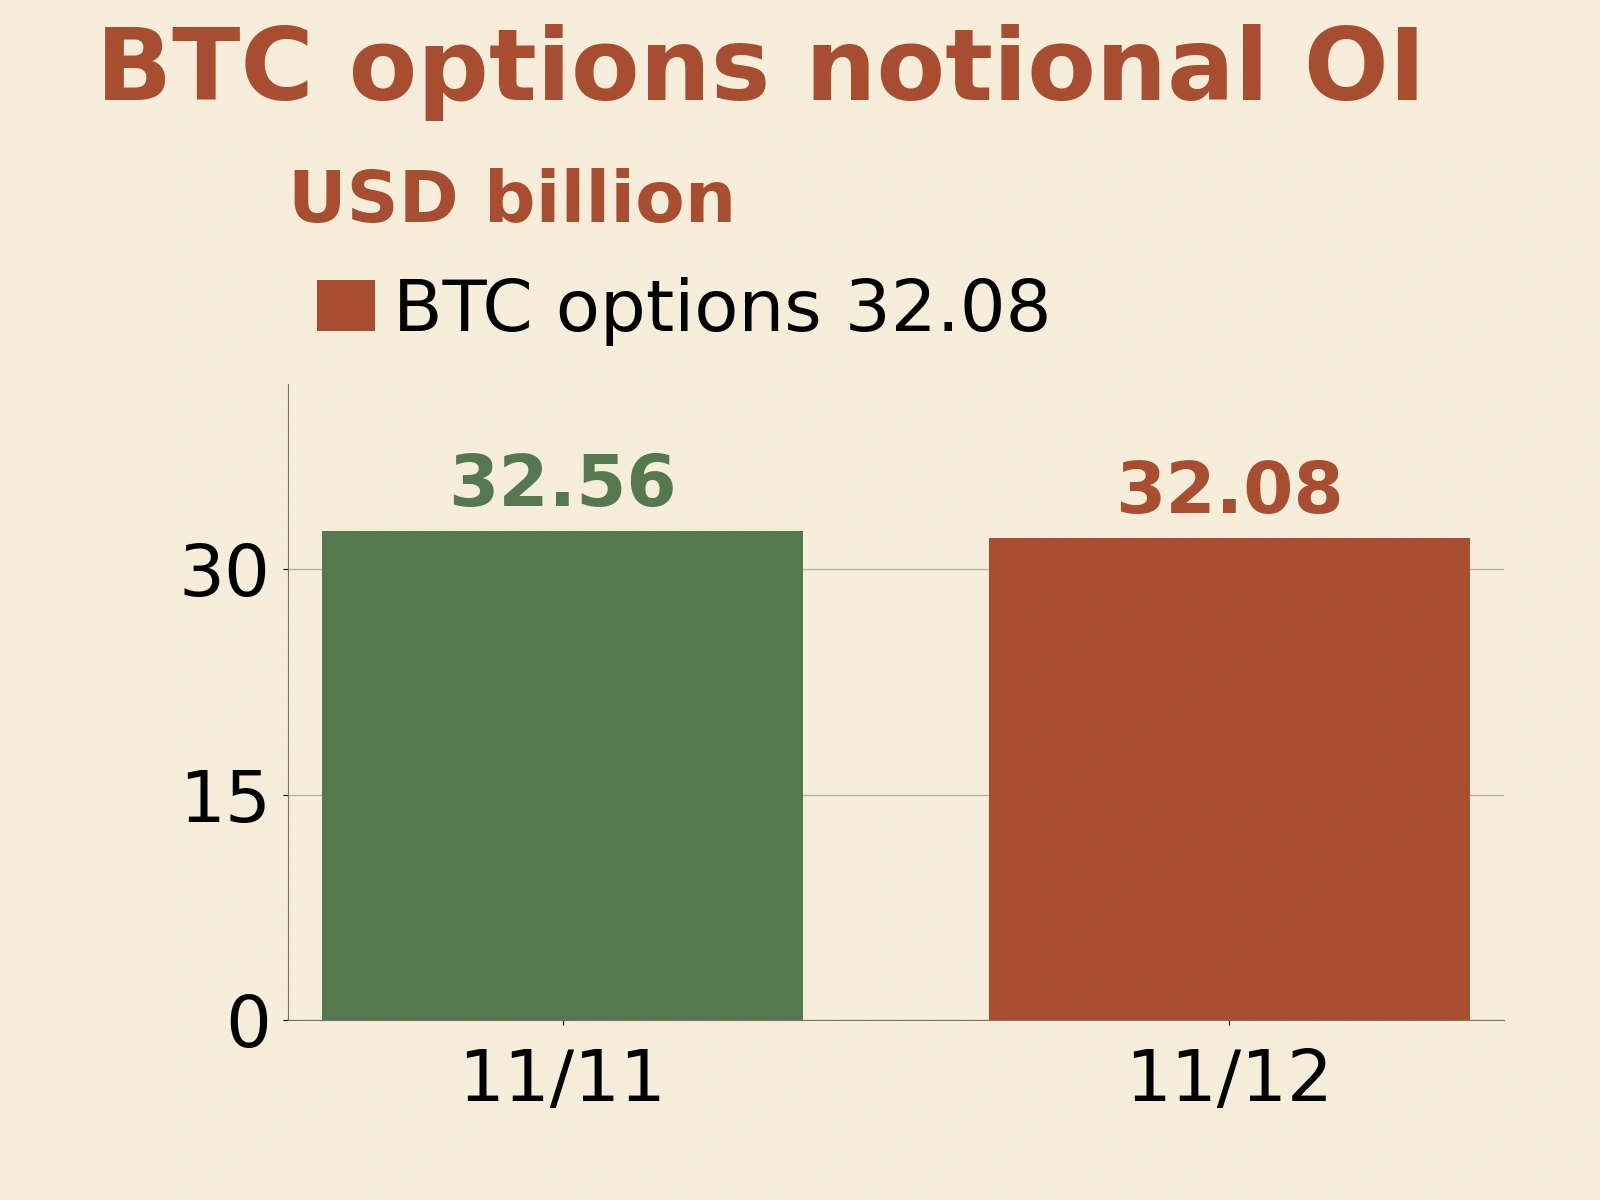
The options market, meanwhile, shows a reduction in notional risk exposure. TokenPost, citing CoinGlass data, reported that Bitcoin options notional open interest stood at $32.08 billion as of 12:01 UTC on November 12, down 1.47% from $32.56 billion the previous day. Calls accounted for 56% of open interest. Active contracts that day included $80,000 calls expiring in December as well as $70,000 and $74,000 puts expiring the following day, showing that longer-dated upside exposure coexists with demand for near-term protection.
Notional open interest changes with the underlying asset's price, and call positions may also be established by sellers, so the position mix alone is insufficient to confirm that the market has turned bullish. Read alongside funding rates, the more defensible interpretation is that the way traders take risk is changing: some retain exposure to a rebound, some seek short-term protection, and investment capital continues to withdraw.
This combination can support a rebound, but derivatives alone are less likely to produce a sustained uptrend. Short covering can lift prices rapidly, and long positions paying positive funding can provide near-term buying support. If ETF redemptions and stablecoin contraction continue, however, a rebound will still need sustained support from the existing pool of cash. A material improvement in funding conditions should show up in a sustained narrowing of ETF outflows, stabilization in stablecoin circulation and stronger spot buying. The better-supported assessment at this stage is that leveraged capital is still trying to buy the decline, while cash supply and investment allocations have yet to provide support in the same direction.
Click “Read the original” for the full details.