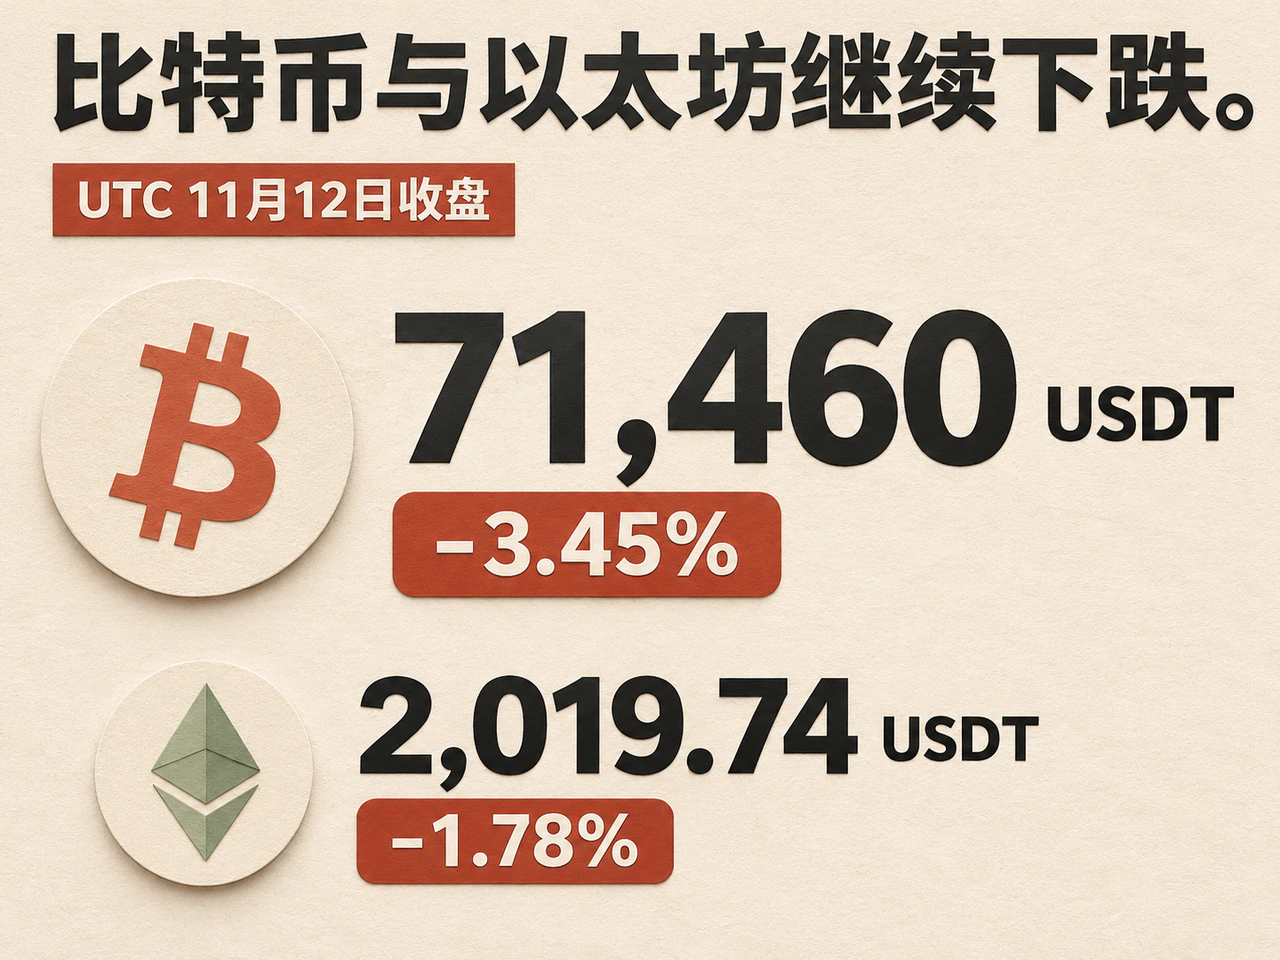
On November 12, 2026, the full UTC trading day for Binance spot USDT pairs closed at 8 a.m. Beijing time on November 13. The market figures below are calculated from UTC daily candles. BTC closed at 71,460 USDT, down 3.45% from the previous day; ETH closed at 2,019.74 USDT, down 1.78%. The modest recovery in the previous session was quickly interrupted, extending the market’s correction over the past week.
Pressure came from both outside and within the market. A leadership change at Nvidia unsettled technology stocks, while expectations of tighter interest-rate policy raised funding costs for risk assets. Crypto itself lacked the spot investment flows needed to absorb selling consistently. Together, these factors left short-term rebounds more vulnerable to fresh selling pressure.
Technology stocks recover most of their losses, but BTC still closes down 3.45%

On November 12, Nvidia announced that Jensen Huang had resigned as president, chief executive officer and director, with chief financial officer Colette Kress taking over as interim CEO. Reuters reported that Nvidia shares fell nearly 12% at one point before narrowing their closing loss to about 4.3%; the S&P 500 and Nasdaq Composite closed down 0.35% and 0.39%, respectively. Technology stocks recovered most of their intraday losses, but crypto assets failed to stabilize alongside them.
The main link between the two markets lies in risk budgets. When a large technology company faces an unexpected shock, investors may reduce risk exposure, preserve cash or cut leverage. Bitcoin, with its longer trading hours and relatively deep liquidity, can also become part of that adjustment. Dow Jones Newswires linked Bitcoin’s decline that morning to weakness in Nasdaq futures. The subsequent stabilization in technology stocks, while crypto prices remained weak, suggests that the external shock explains only part of the move: the crypto market’s own capacity to absorb spot selling matters as well.
Interest-rate expectations further increased the cost of holding positions. According to Reuters’ closing report, after inflation data exceeded expectations earlier in the week, markets had fully priced in a rate increase of at least 25 basis points in December and assigned roughly a 15% probability to a 50-basis-point increase. These probabilities reflected market pricing at the time, rather than a policy decision. Higher rates make cash and short-term bonds more attractive and increase the cost of maintaining leveraged positions, leaving assets without stable cash flows more dependent on new capital.
MSCI to remove Strategy as large buyers remain largely absent

Meanwhile, MSCI will remove Strategy from its global indexes effective November 30, adding uncertainty to the corporate-treasury channel for Bitcoin purchases. Index-tracking funds will need to adjust their equity holdings, with the immediate effects falling on demand for Strategy shares and its financing conditions. If pressure on its share price weakens its ability to raise money through equity issuance, its capacity to buy more Bitcoin could also be constrained. The actual effect will depend on the scale of index-fund adjustments, the company’s other funding sources and its execution arrangements. For now, the main implication is a possible constraint on incremental buying funds.
The market’s focus therefore turns to sustained buying. In a report published by The Block that day, Wintermute OTC trader Jasper De Maere said large buyers had yet to enter in a meaningful way and that major cryptocurrencies needed ETF flows to turn positive for several consecutive days to improve support. This assessment shifts attention from any single technical price level to persistent spot demand: equity-market volatility can trigger selling, but whether a rebound lasts depends on how much new capital steps in to absorb it.
ETH/BTC gains 1.73% in a day; Bitcoin ETFs lose $1.438 billion over five days
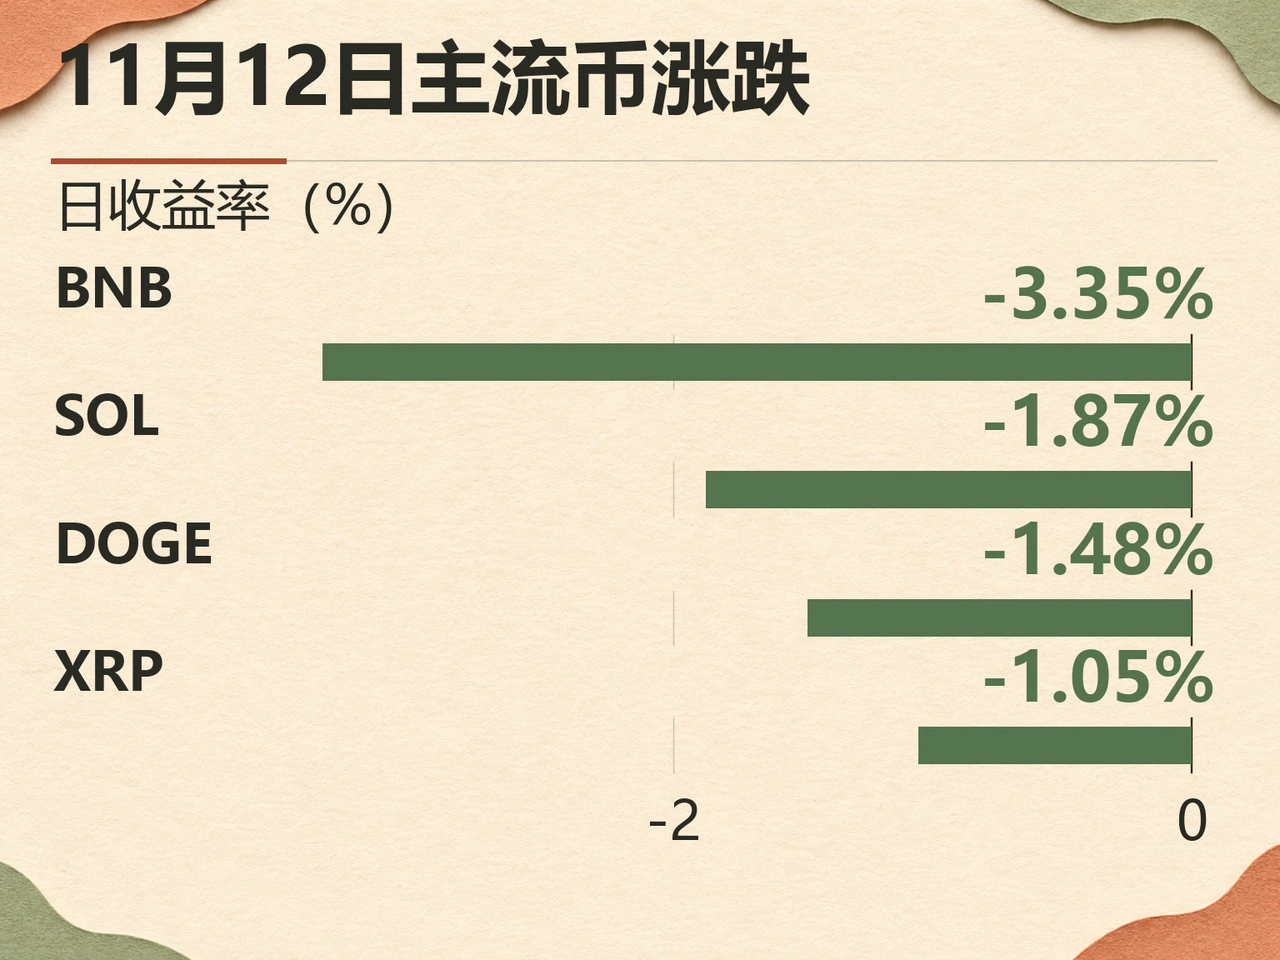
Every asset in the fixed, highly liquid sample on Binance fell over the same full trading day: BNB declined 3.35%, SOL 1.87%, DOGE 1.48% and XRP 1.05%. BTC was among the larger decliners in this group; there was no clear flight toward Bitcoin as a safe haven that day.
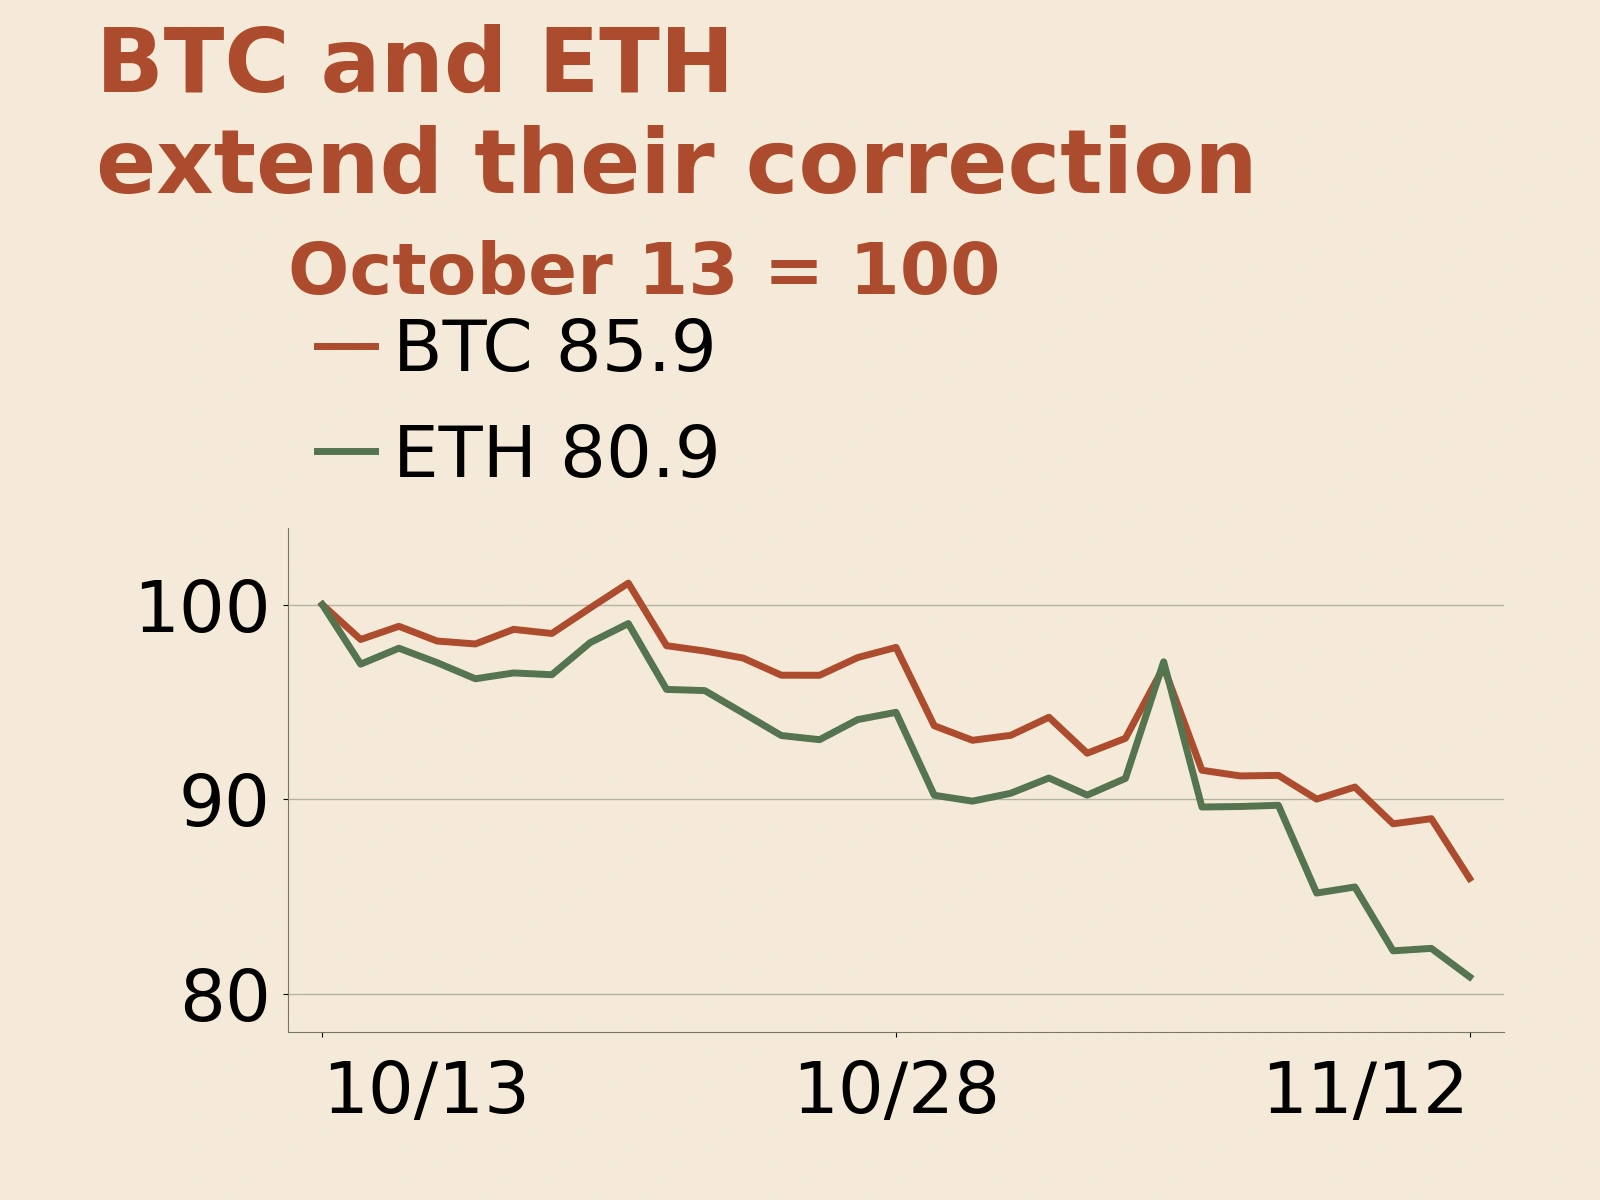
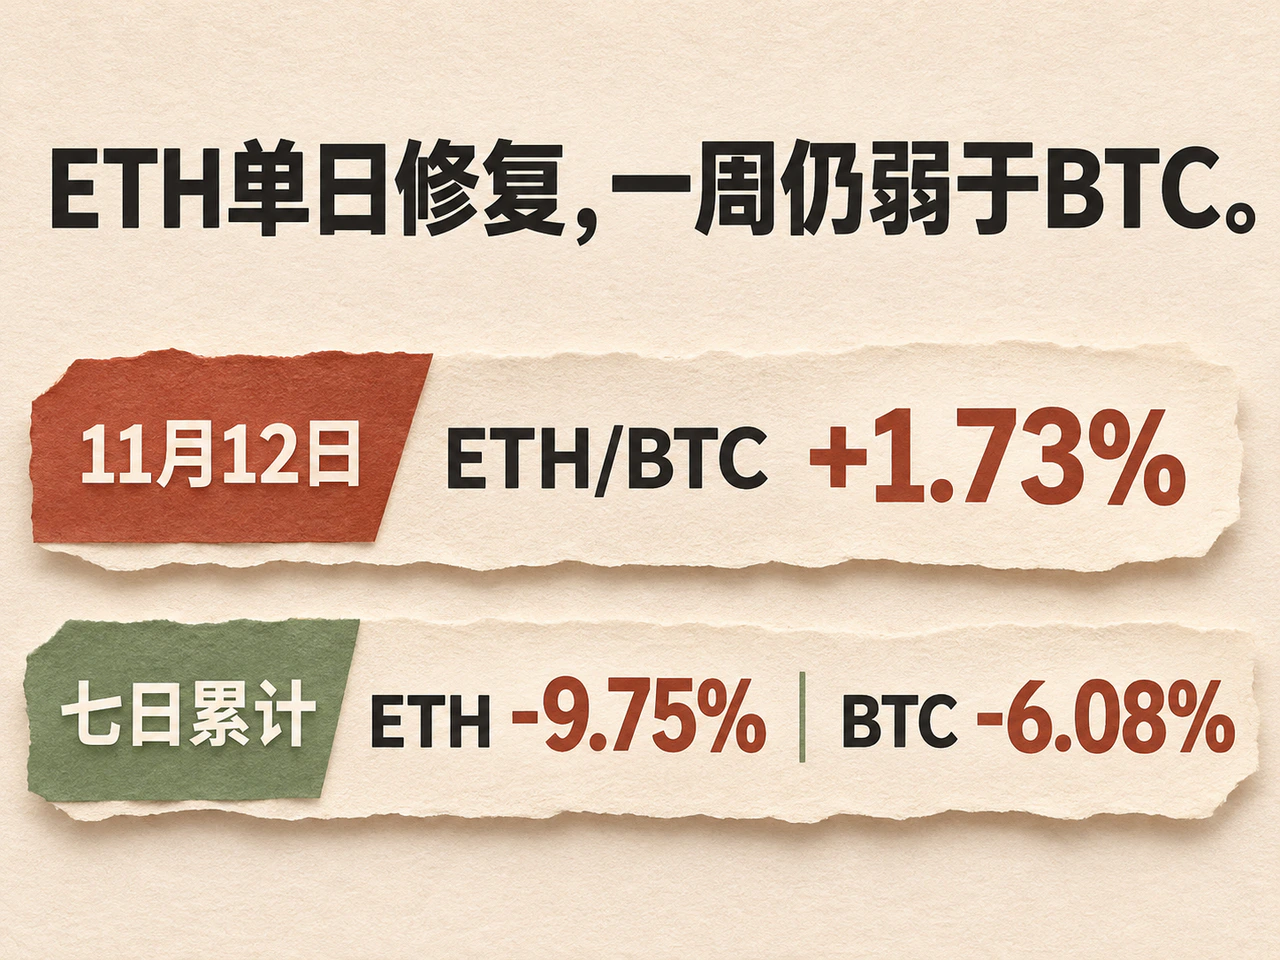
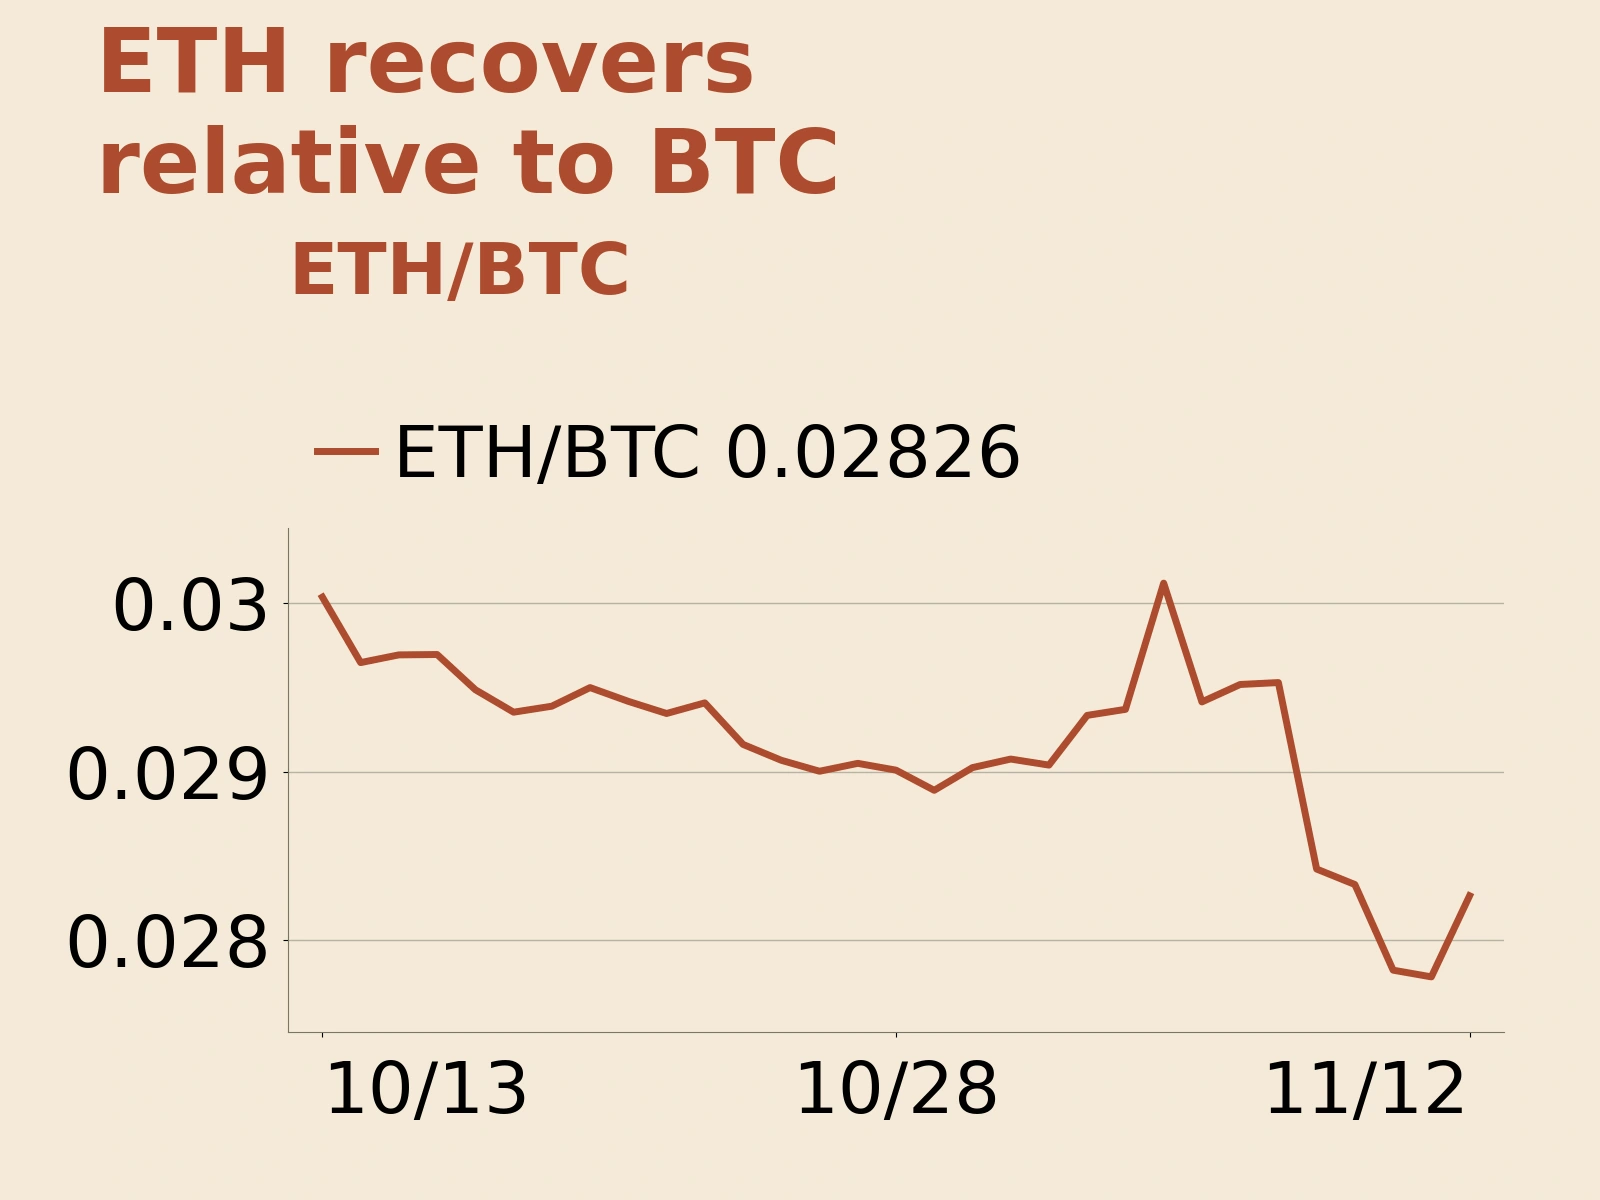
ETH did recover relative to BTC. ETH/BTC rose from approximately 0.02778 in the previous session to 0.02826, a daily gain of about 1.73%. But over the seven full UTC trading days through November 12, ETH fell a cumulative 9.75%, still underperforming BTC’s 6.08% decline; XRP and SOL fell 13.74% and 8.52%, respectively, over the same period. A single day of relative recovery has yet to reverse the weakness of the preceding week.
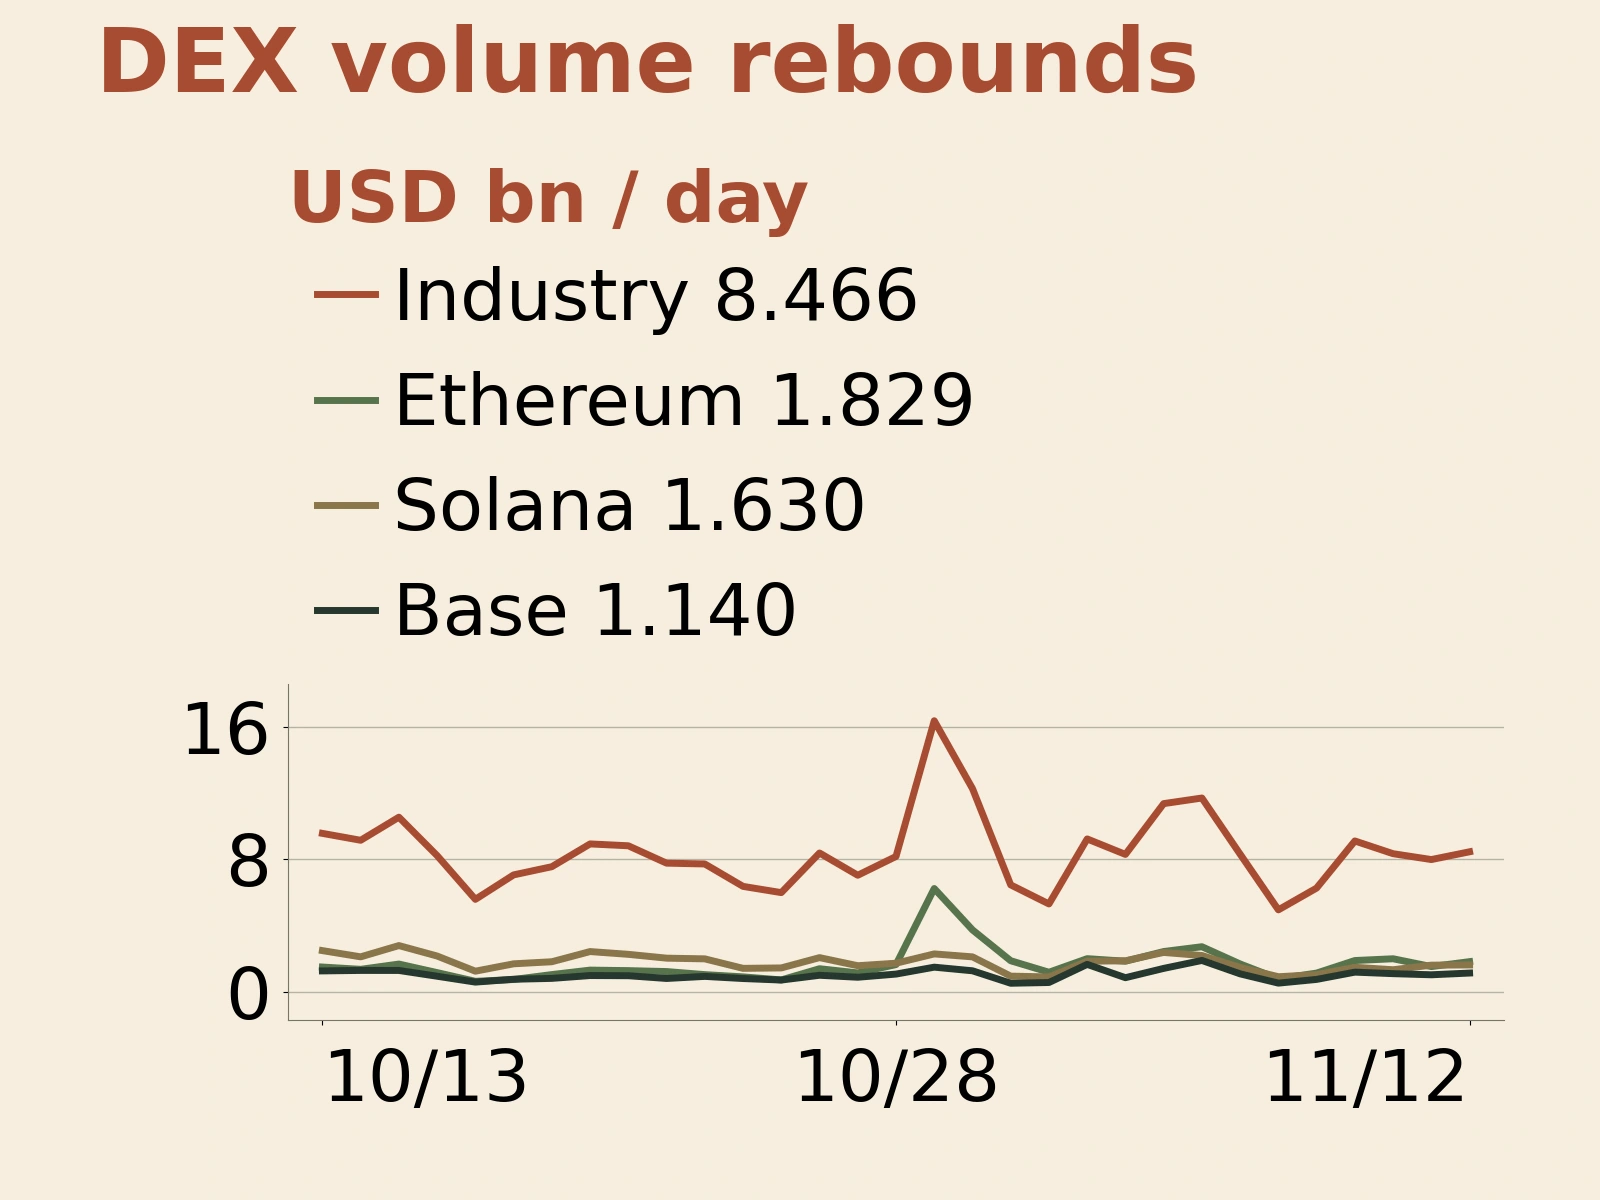
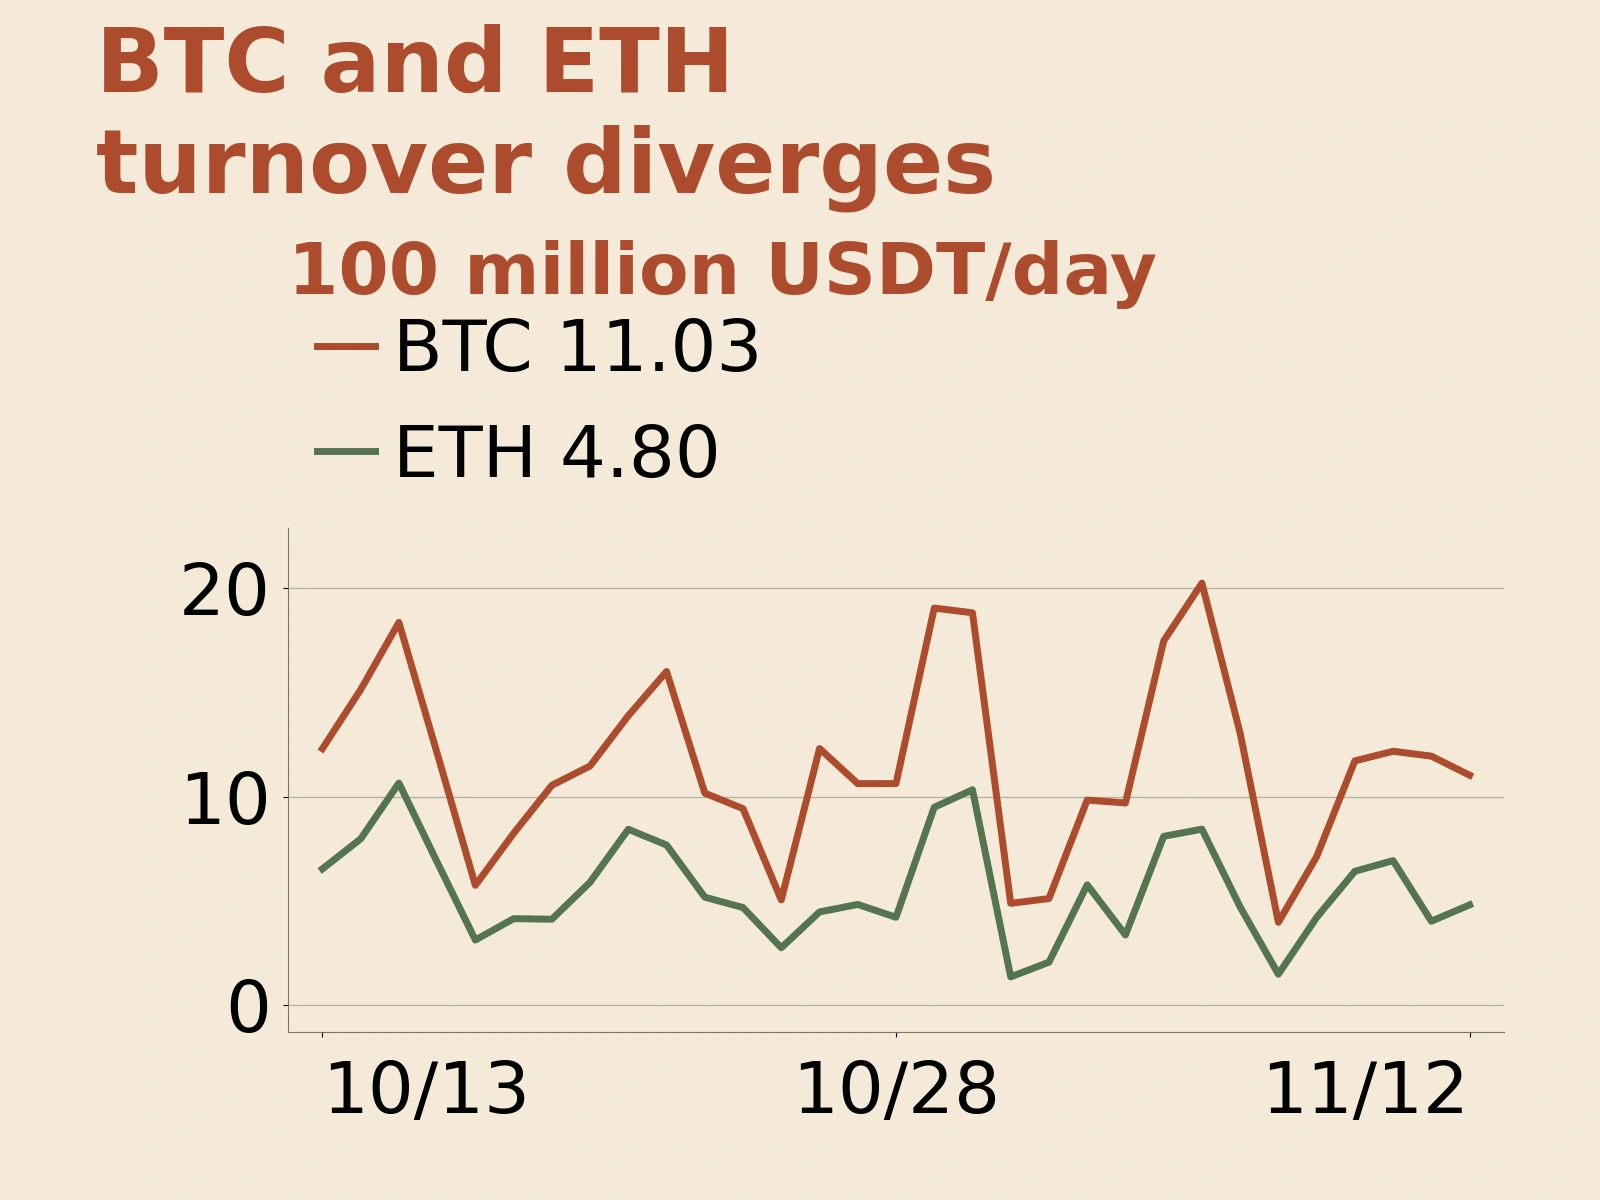
Turnover moved in opposite directions for the two largest cryptocurrencies. BTC’s Binance spot turnover was approximately 1.103 billion USDT, down 7.67% from the previous day; ETH’s was approximately 480 million USDT, up 19.61%. ETH’s increase in trading activity accompanied a price decline, while BTC fell as turnover contracted. Turnover measures only the value of completed trades. Assessing the direction of demand still requires prices, ETF subscriptions and redemptions, and other spot-market indicators.
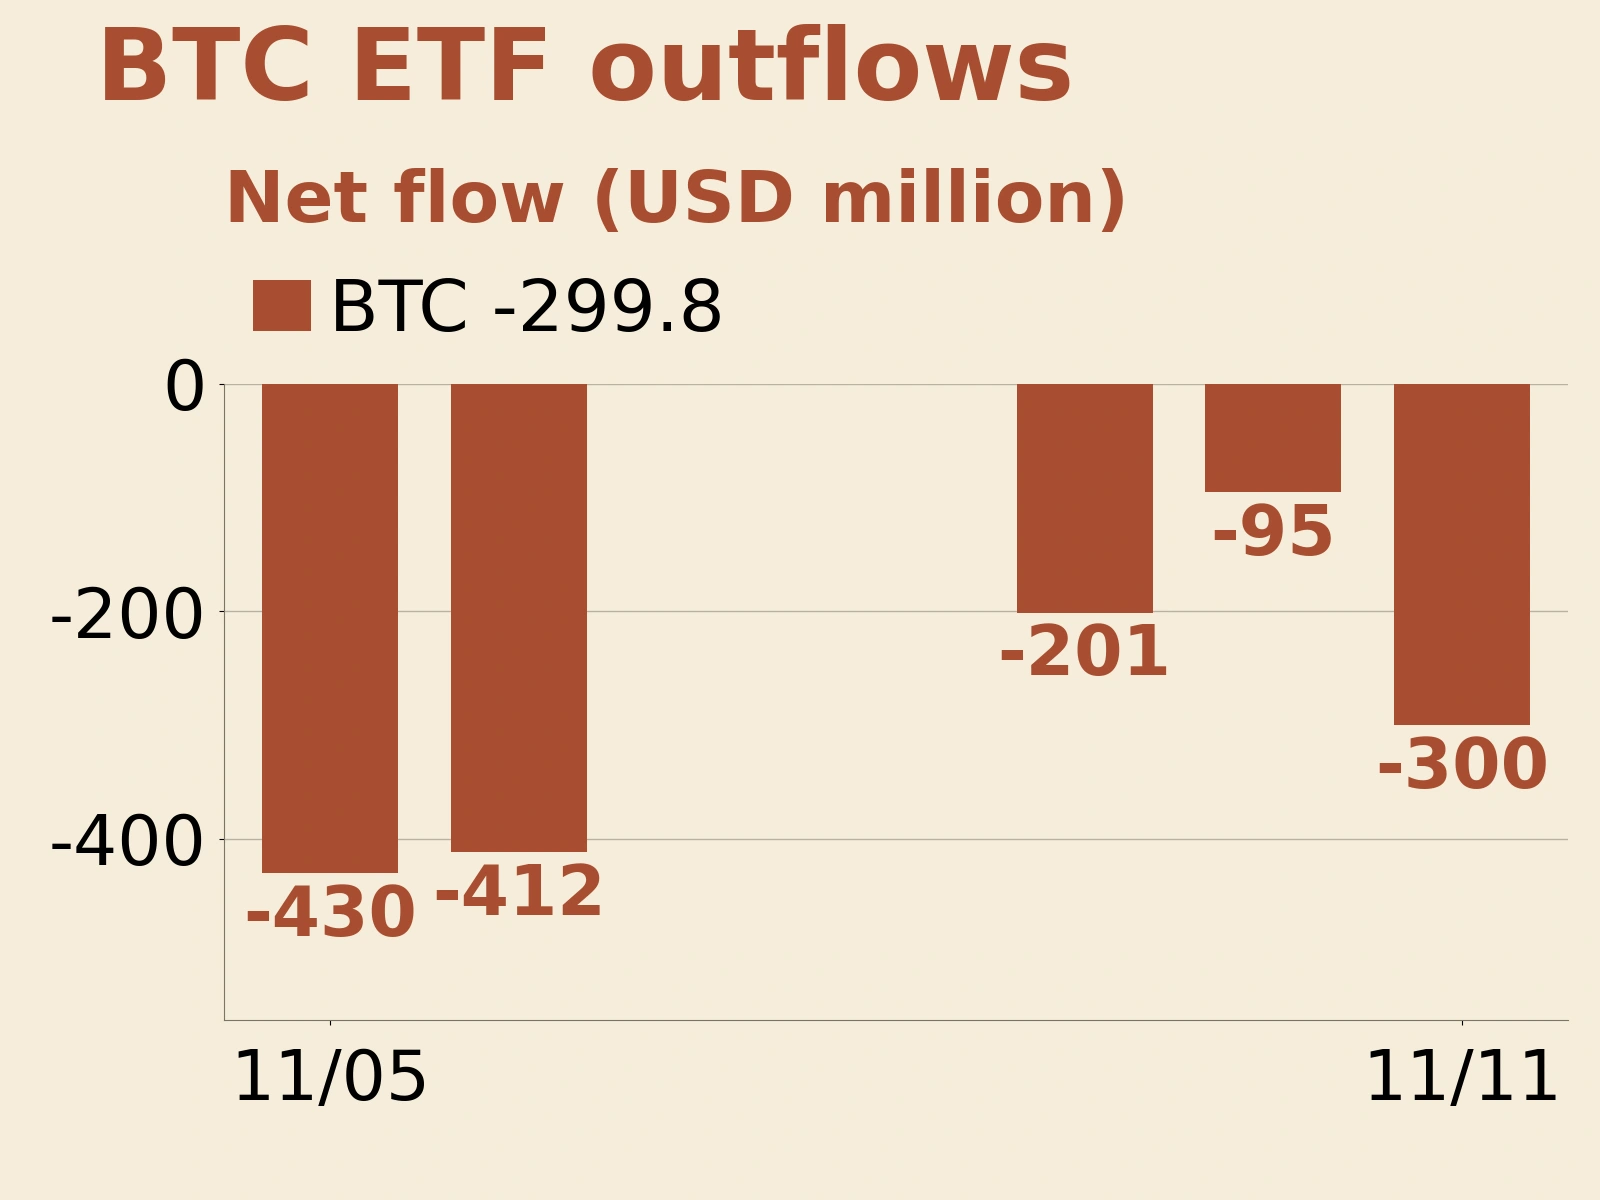
ETF data further show investment capital continuing to leave. Complete Farside data indicate that US spot Bitcoin ETFs recorded approximately $300 million in net outflows on November 11, bringing cumulative net outflows over five consecutive trading days to about $1.438 billion. At this edition’s cutoff, not all funds had reported their November 12 figures. The statistics therefore run through November 11 and provide the known flow backdrop for this edition’s market moves.
Institutional research and professional traders remain divided over whether the market is approaching a near-term low. Citing research from CryptoQuant and Glassnode, BeInCrypto reported that features such as a sharp drop in demand and a partial unwinding of leverage have historically appeared near local lows. However, weak US spot demand and shrinking stablecoin liquidity are also eroding the foundations for a rebound. Crypto.news cited trader Daan Crypto Trades as saying that high open interest measured in BTC could trigger a squeeze in either direction. Oversold conditions, liquidations and high open interest can all amplify short-term volatility; a sustained rally still requires an improvement in spot demand.
Overall, the November 12 decline reflected both an external shock and insufficient buying within the market to absorb selling. The technology-stock shock and tighter rate expectations added pressure, while investment outflows weakened the market’s ability to digest supply. The key developments to watch are whether ETFs can return to sustained net inflows, whether reliable spot buying emerges when major cryptocurrencies pull back, and whether ETH’s relative recovery can continue. Until funding conditions improve, rapid rebounds remain vulnerable to existing selling pressure.
Click “Read the original” for details.