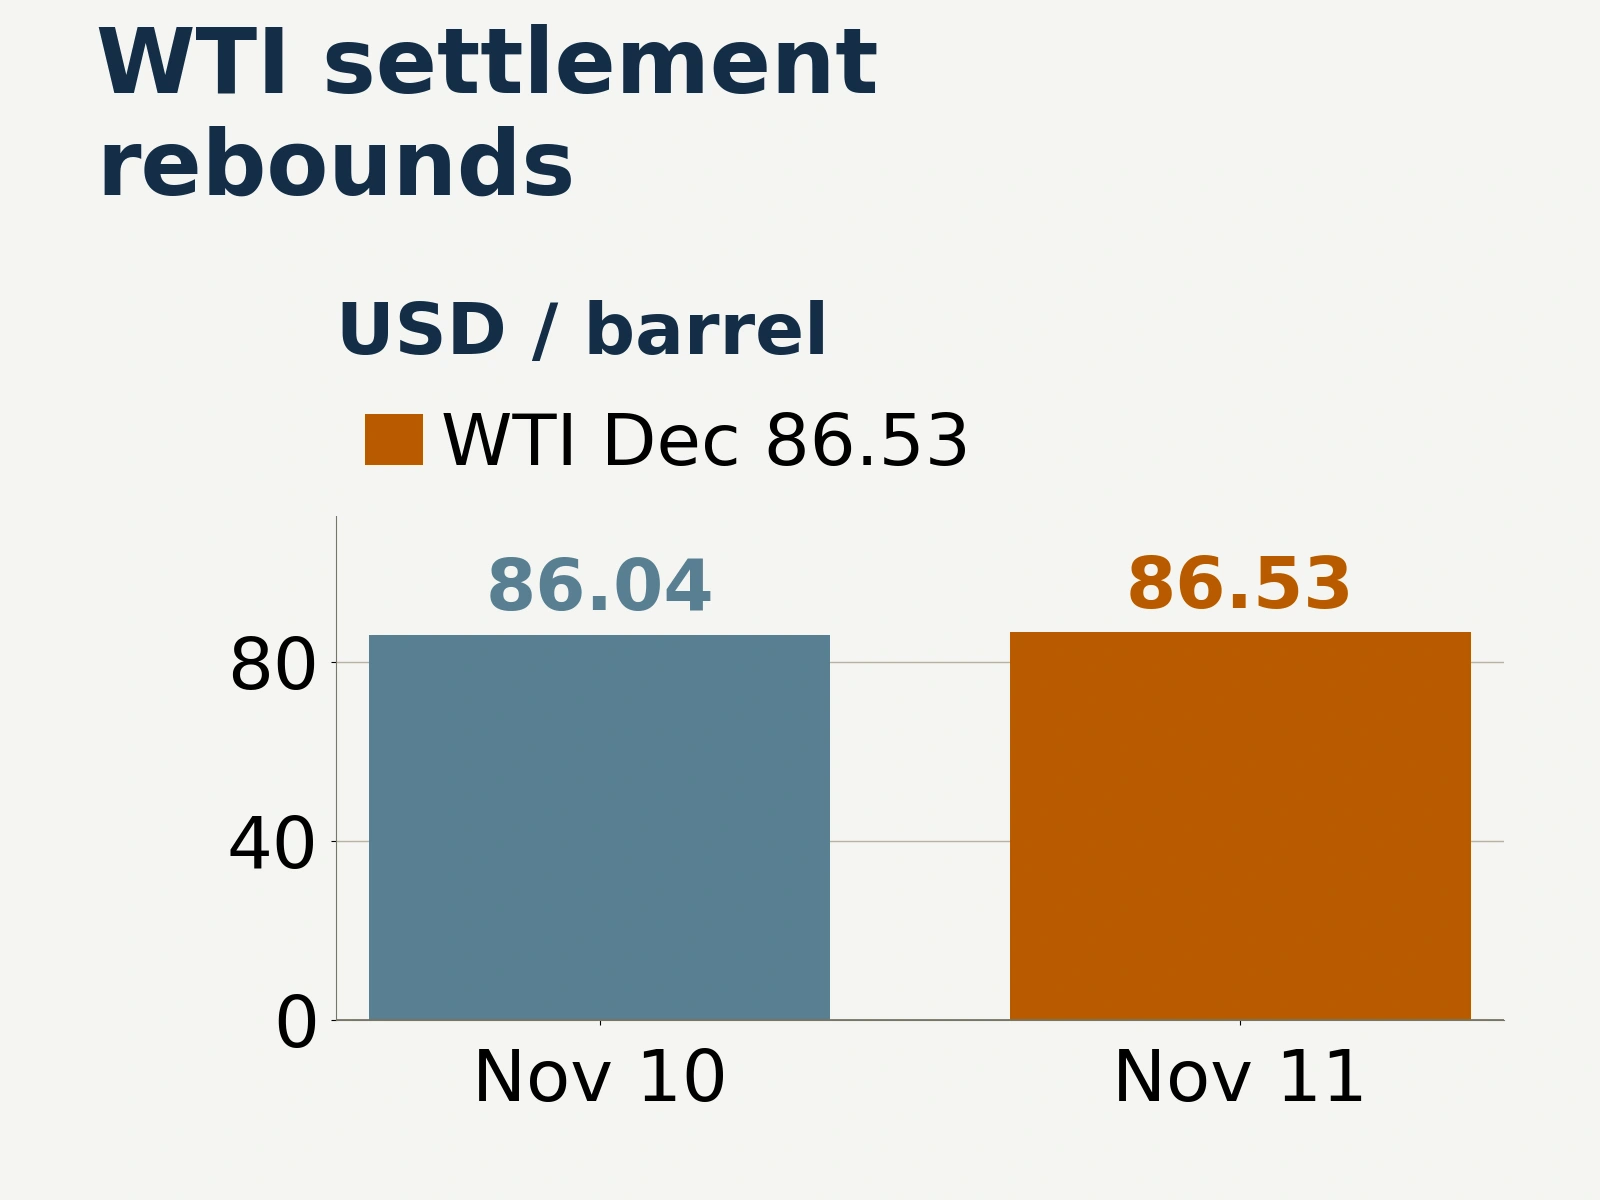
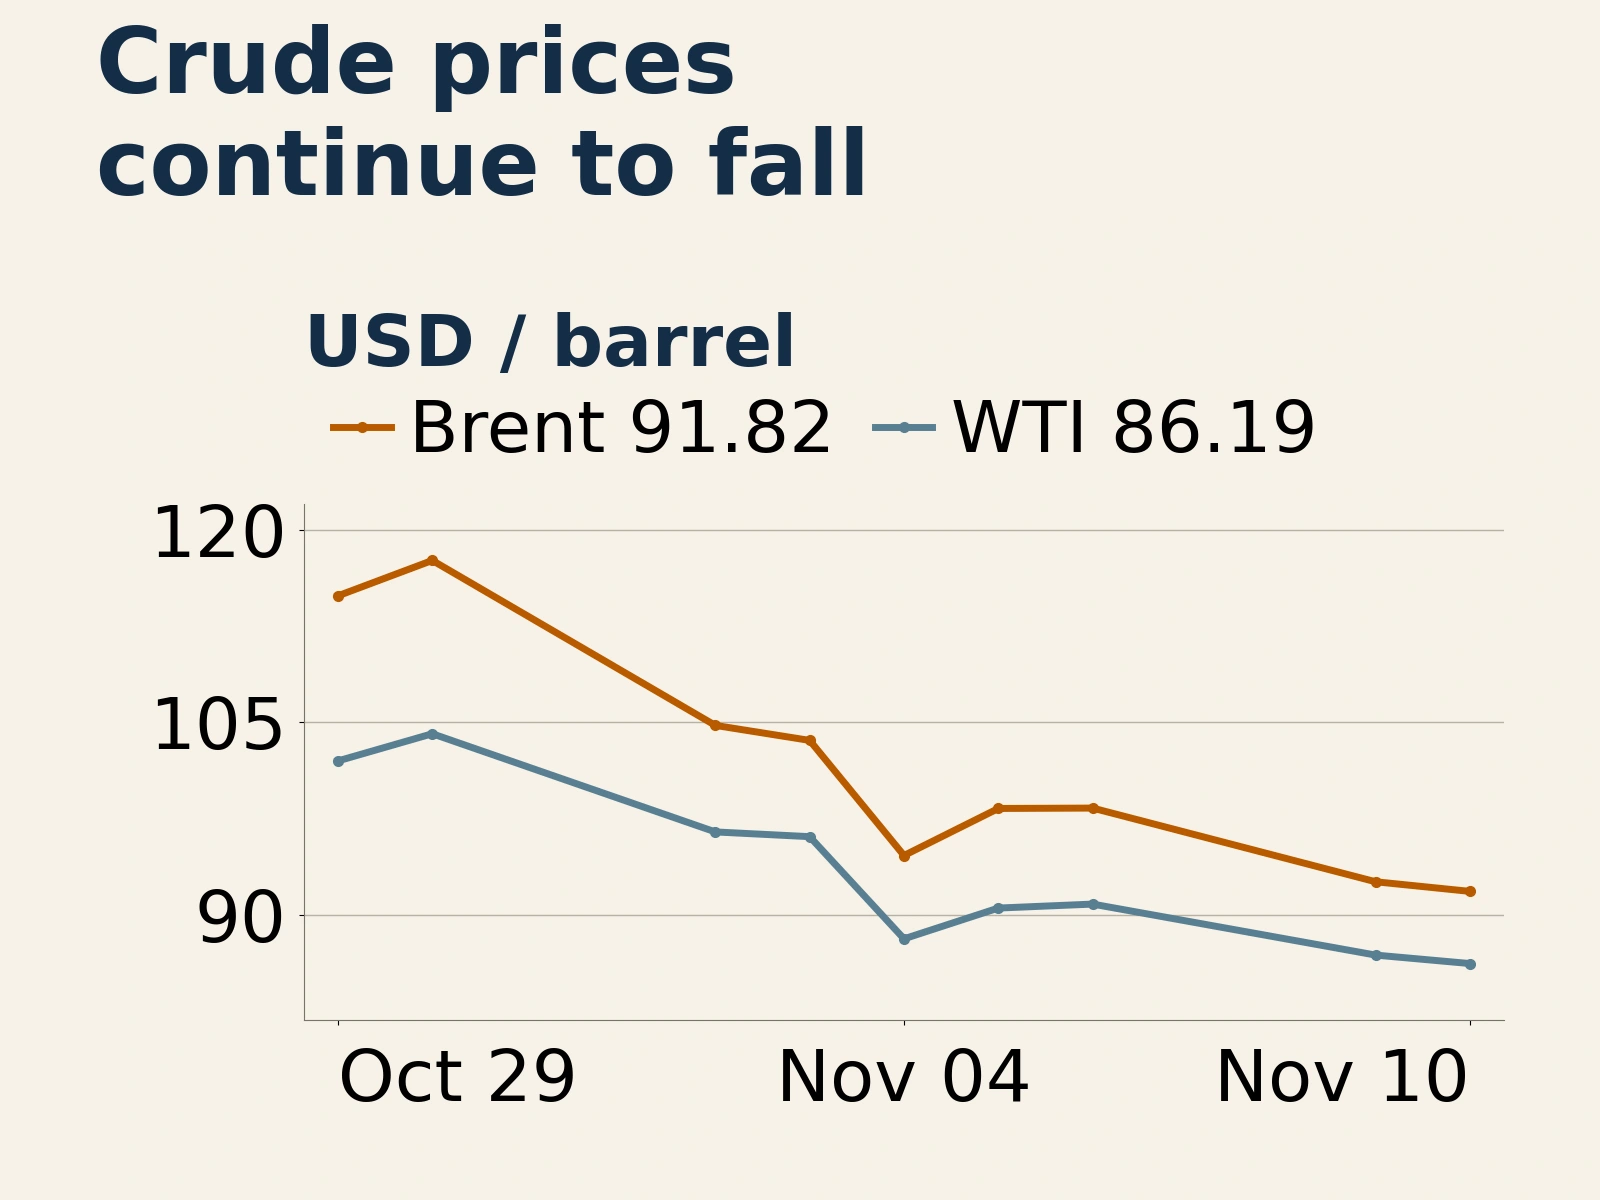
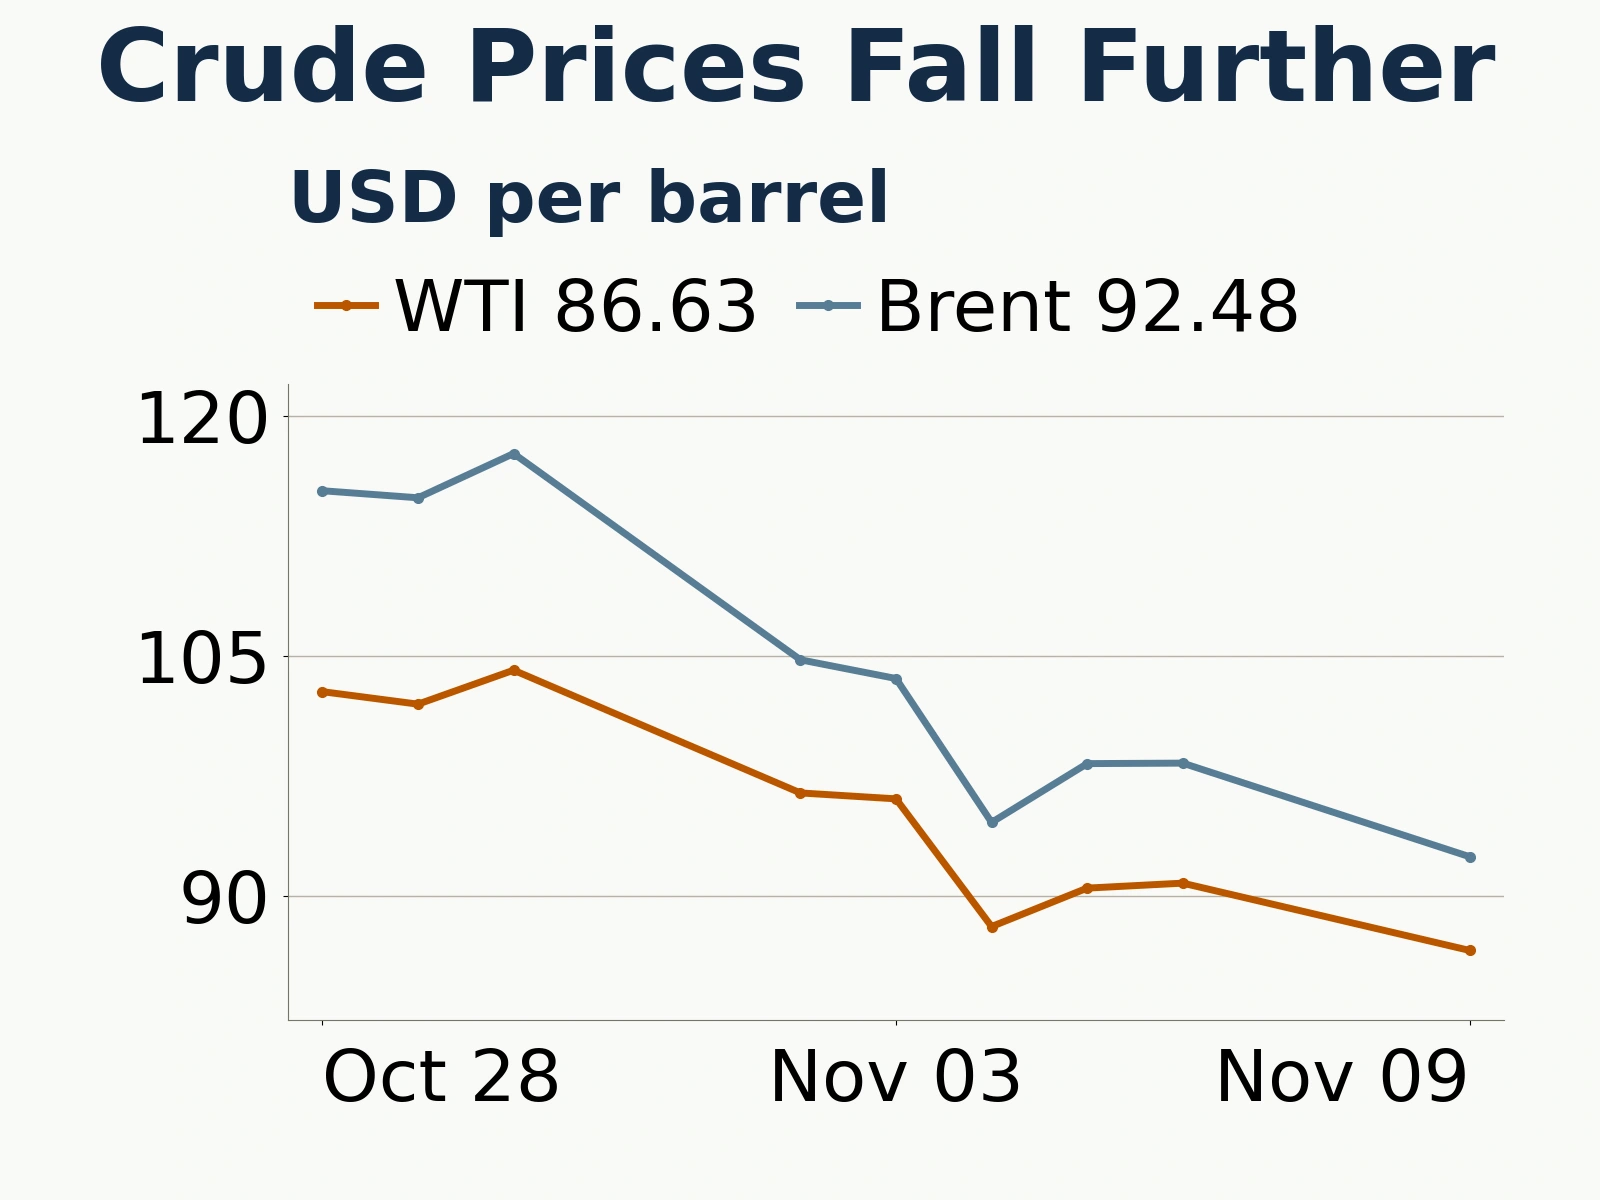
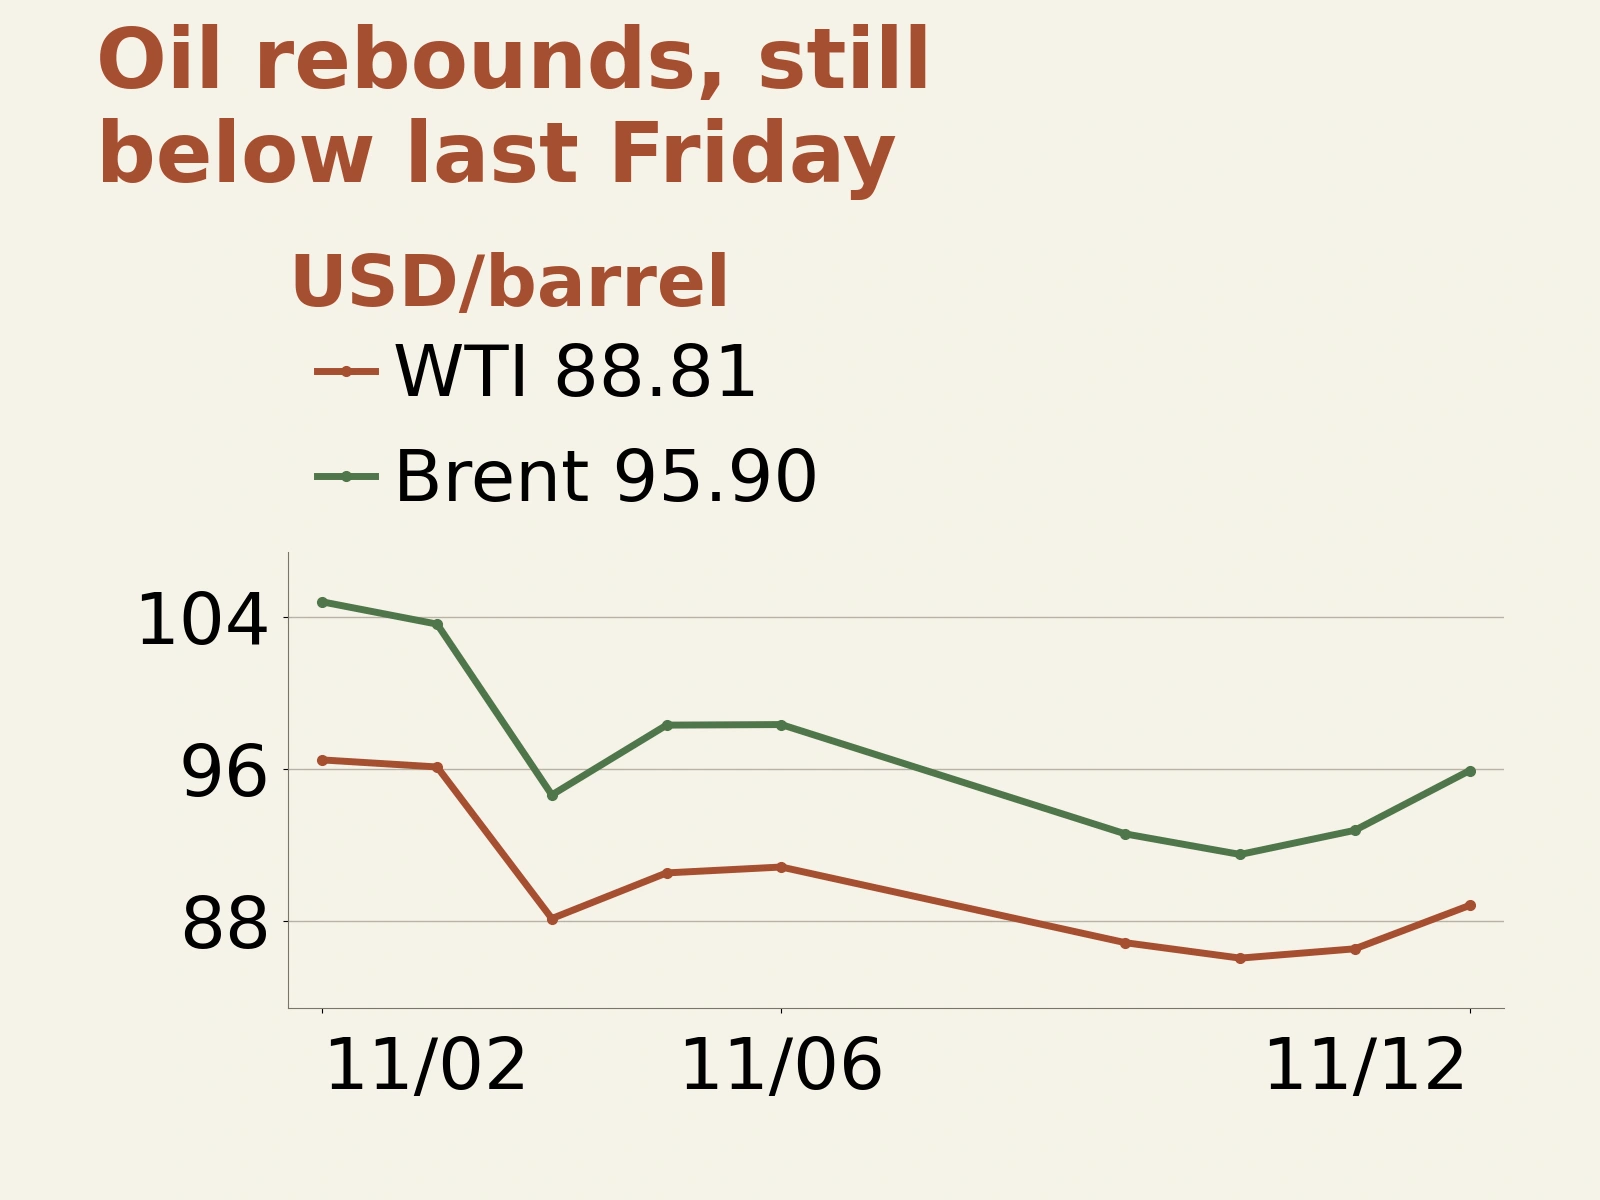
On November 12, 2026, international oil prices reversed early losses in Asian trading to finish higher. Reports of attacks on Saudi energy facilities and shipping risks in the Strait of Hormuz again outweighed pressure from recovering supply and rising U.S. inventories. On Yahoo’s daily closing-price basis for continuous futures, Brent stood at $95.90 a barrel, up 3.39% from the previous trading day, while WTI was $88.81 a barrel, up 2.63%. The futures settlement prices reported by Reuters for the day were $95.82 and $88.74 a barrel, respectively, close to those closing prices.
Export-chain risks intensify: Saudi Arabia’s bypass pipeline and the Strait of Hormuz face attack threats
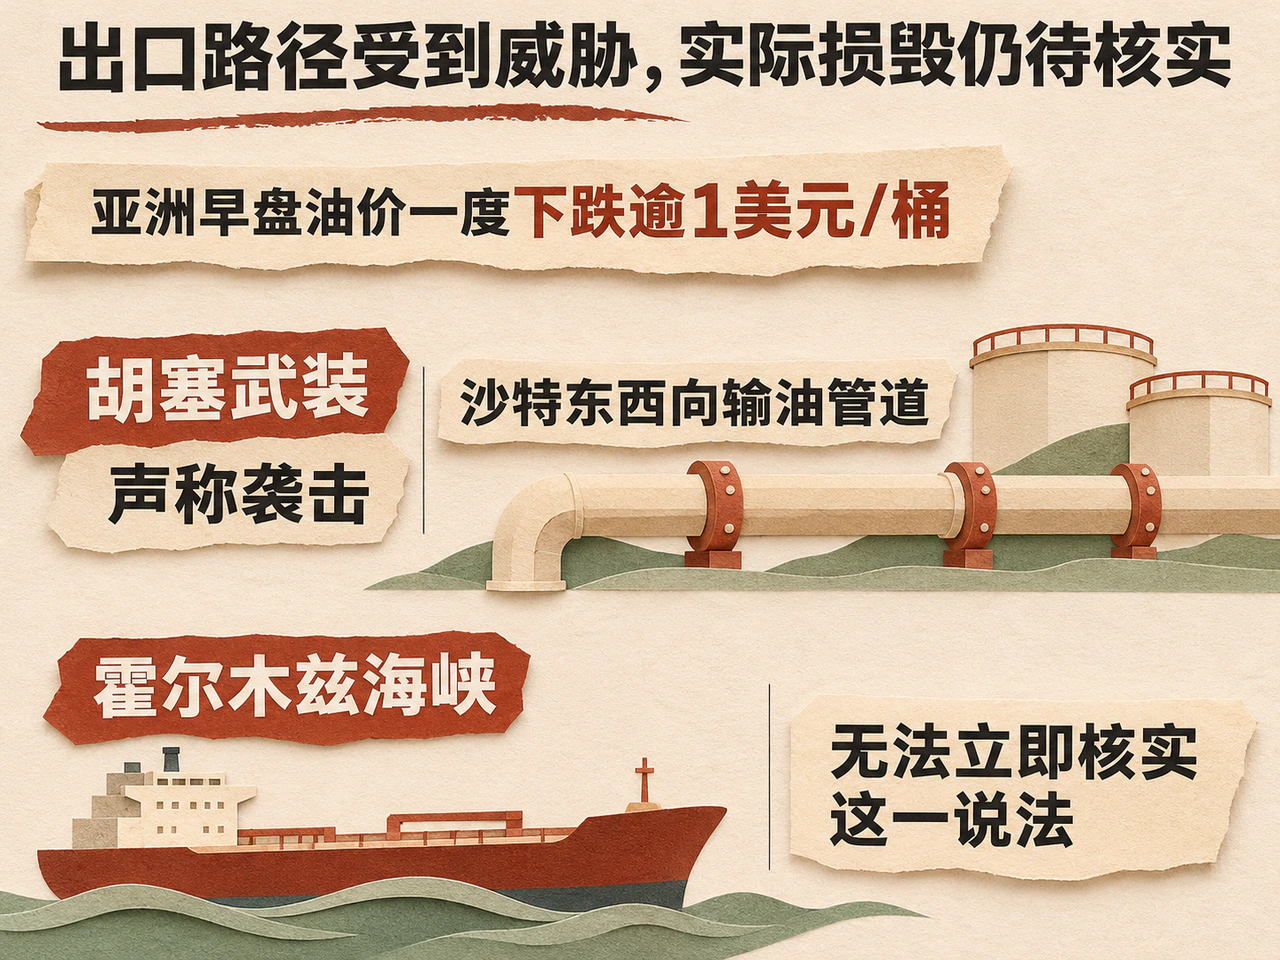
Reuters reported that oil prices fell by more than $1 a barrel at one point in early Asian trading. The market was then focused on the possibility that diplomatic progress in the Middle East and between Russia and Ukraine could ease supply risks, alongside increased output by oil-producing countries and a recovery in U.S. inventories. Subsequently, the Houthis claimed to have attacked a pumping station on Saudi Arabia’s East–West pipeline, oil facilities at Yanbu and a Saudi Aramco building in Riyadh. The Saudi-led coalition said it intercepted two drones. Separately, Iran’s military said four tankers had been hit by explosions in the Strait of Hormuz after ignoring warnings; Reuters said it could not immediately verify the claim. Ukraine also said its drones struck Russia’s Ust-Luga port area, causing a fire and damaging some oil-storage facilities.
Most of these reports concerned routes carrying crude from producing regions to refineries. Saudi Arabia’s East–West pipeline is particularly significant because it enables exports through the Red Sea, bypassing the Strait of Hormuz. In its outlook published on November 10, the U.S. Energy Information Administration (EIA) said the pipeline’s restart and ship-to-ship transfers off Oman had supported a recovery in Middle Eastern exports in October. With both bypass infrastructure and the strait’s shipping routes now at risk, the market needs to reassess whether recovering supplies can be delivered smoothly. For oil prices, the location of the threat within the supply chain does more to explain the reaction than the number of attacks.
U.S. crude inventories rebuild by 4.657 million barrels, with physical evidence of a supply recovery still intact
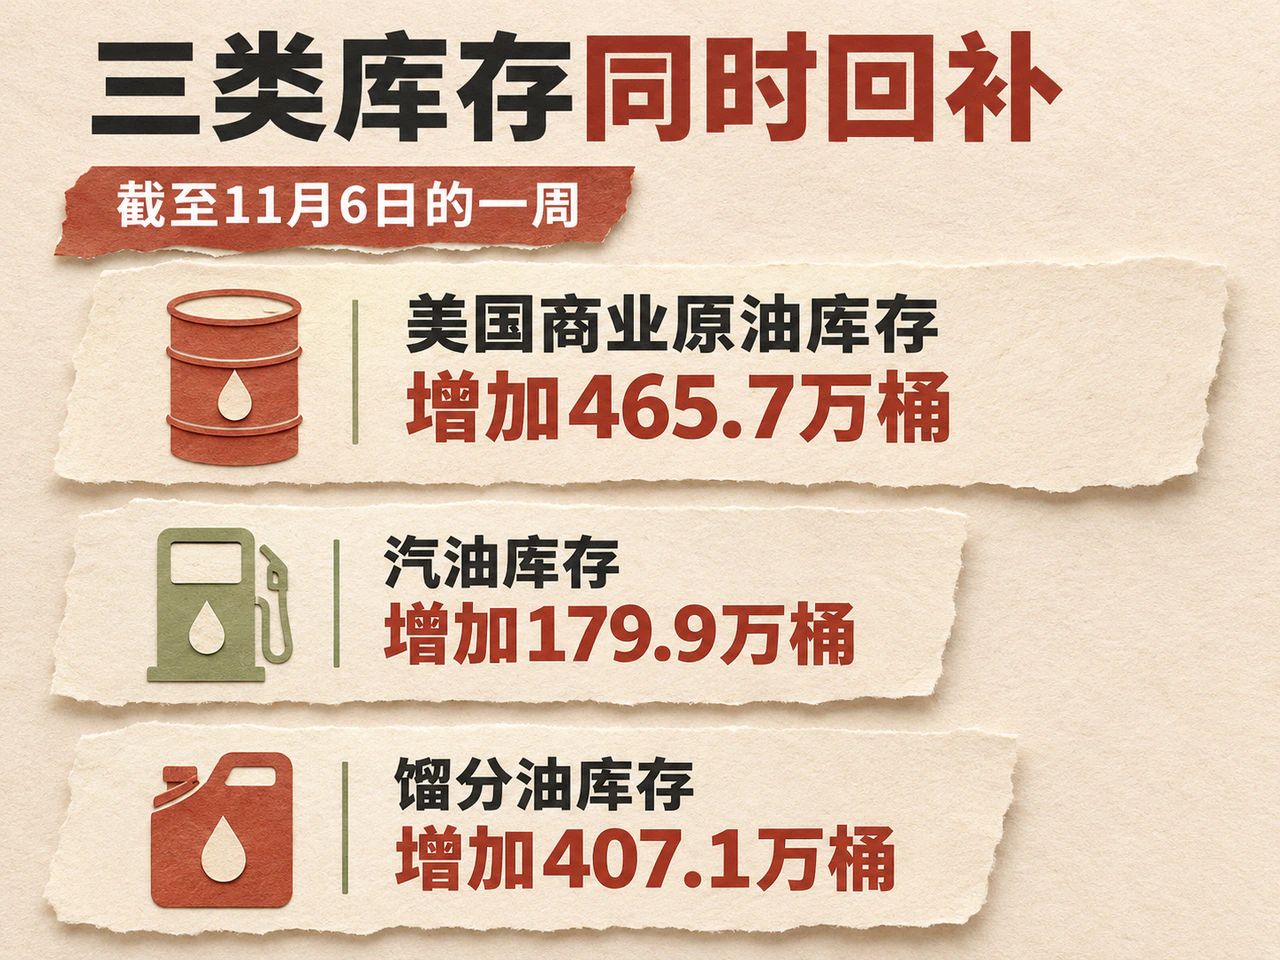
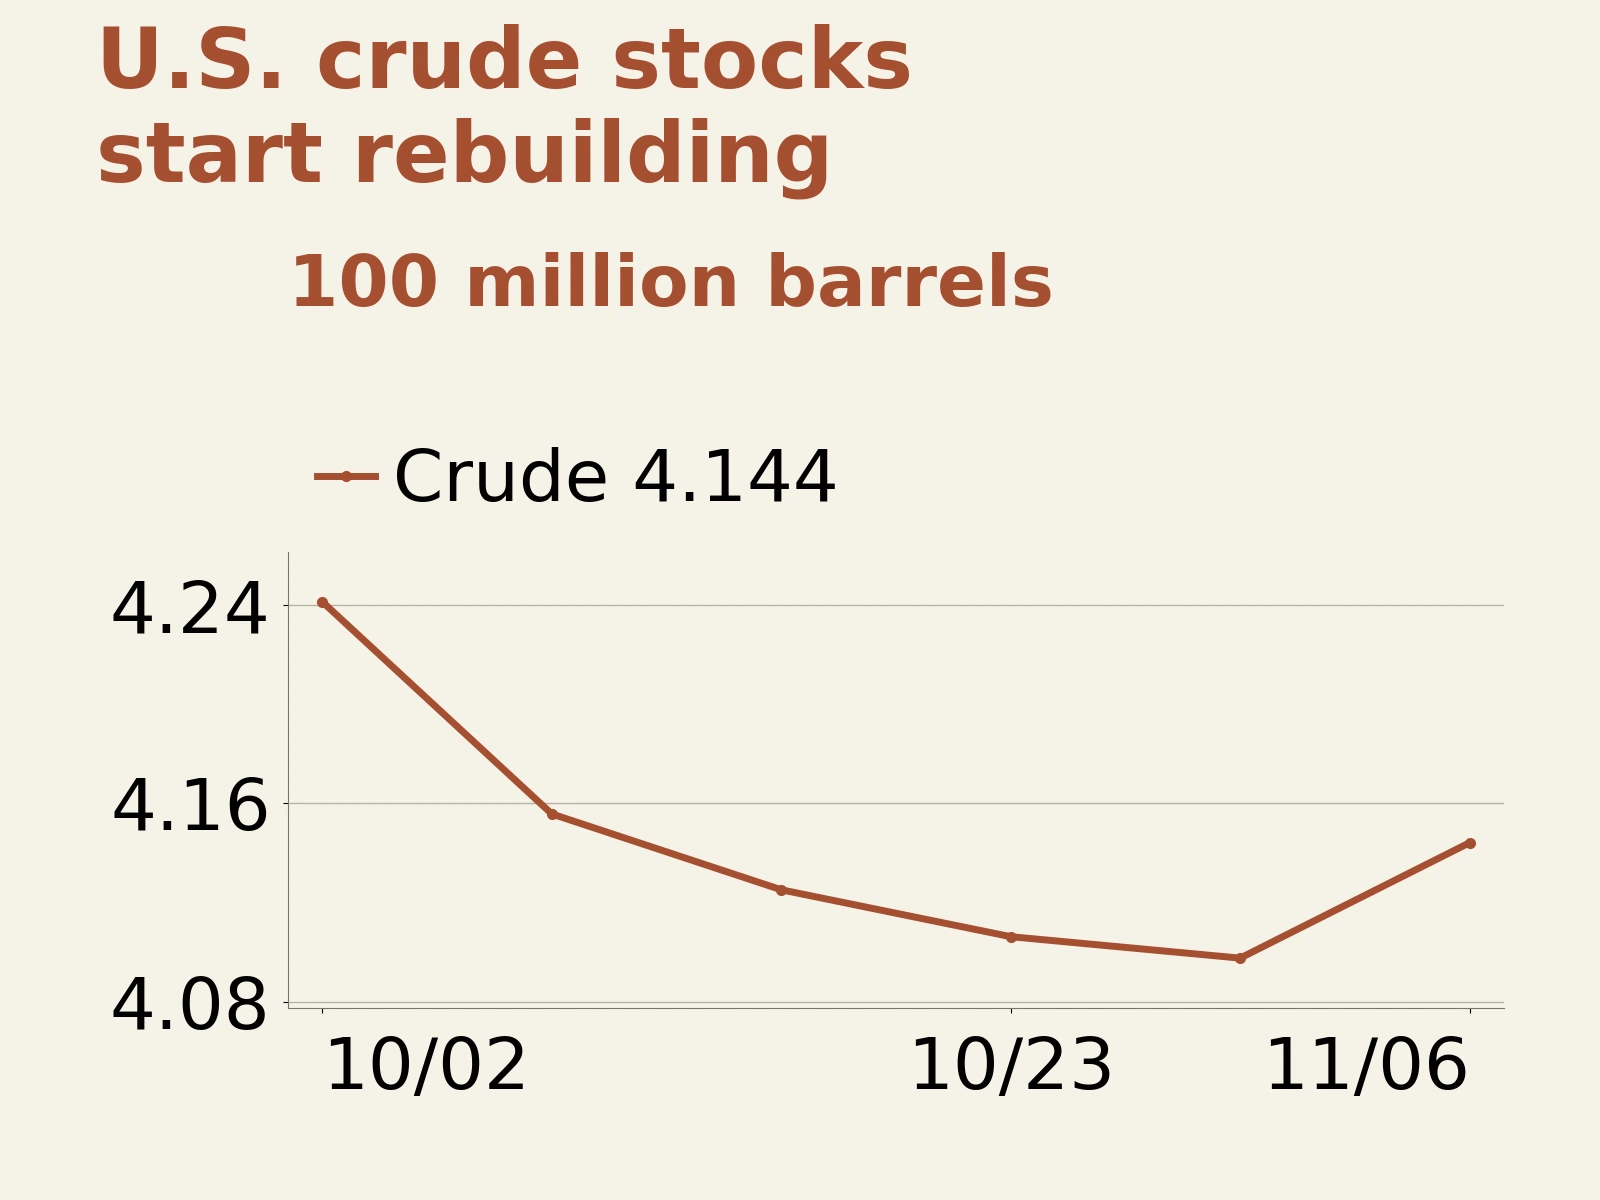
The EIA’s weekly data released on November 12 cover the week ended November 6. U.S. commercial crude inventories rose by 4.657 million barrels to 414.4 million barrels; gasoline inventories increased by 1.799 million barrels and distillate inventories by 4.071 million barrels. Crude stocks rebuilt markedly this week after falling steadily from 424.1 million barrels on October 2 to 409.8 million barrels on October 30.
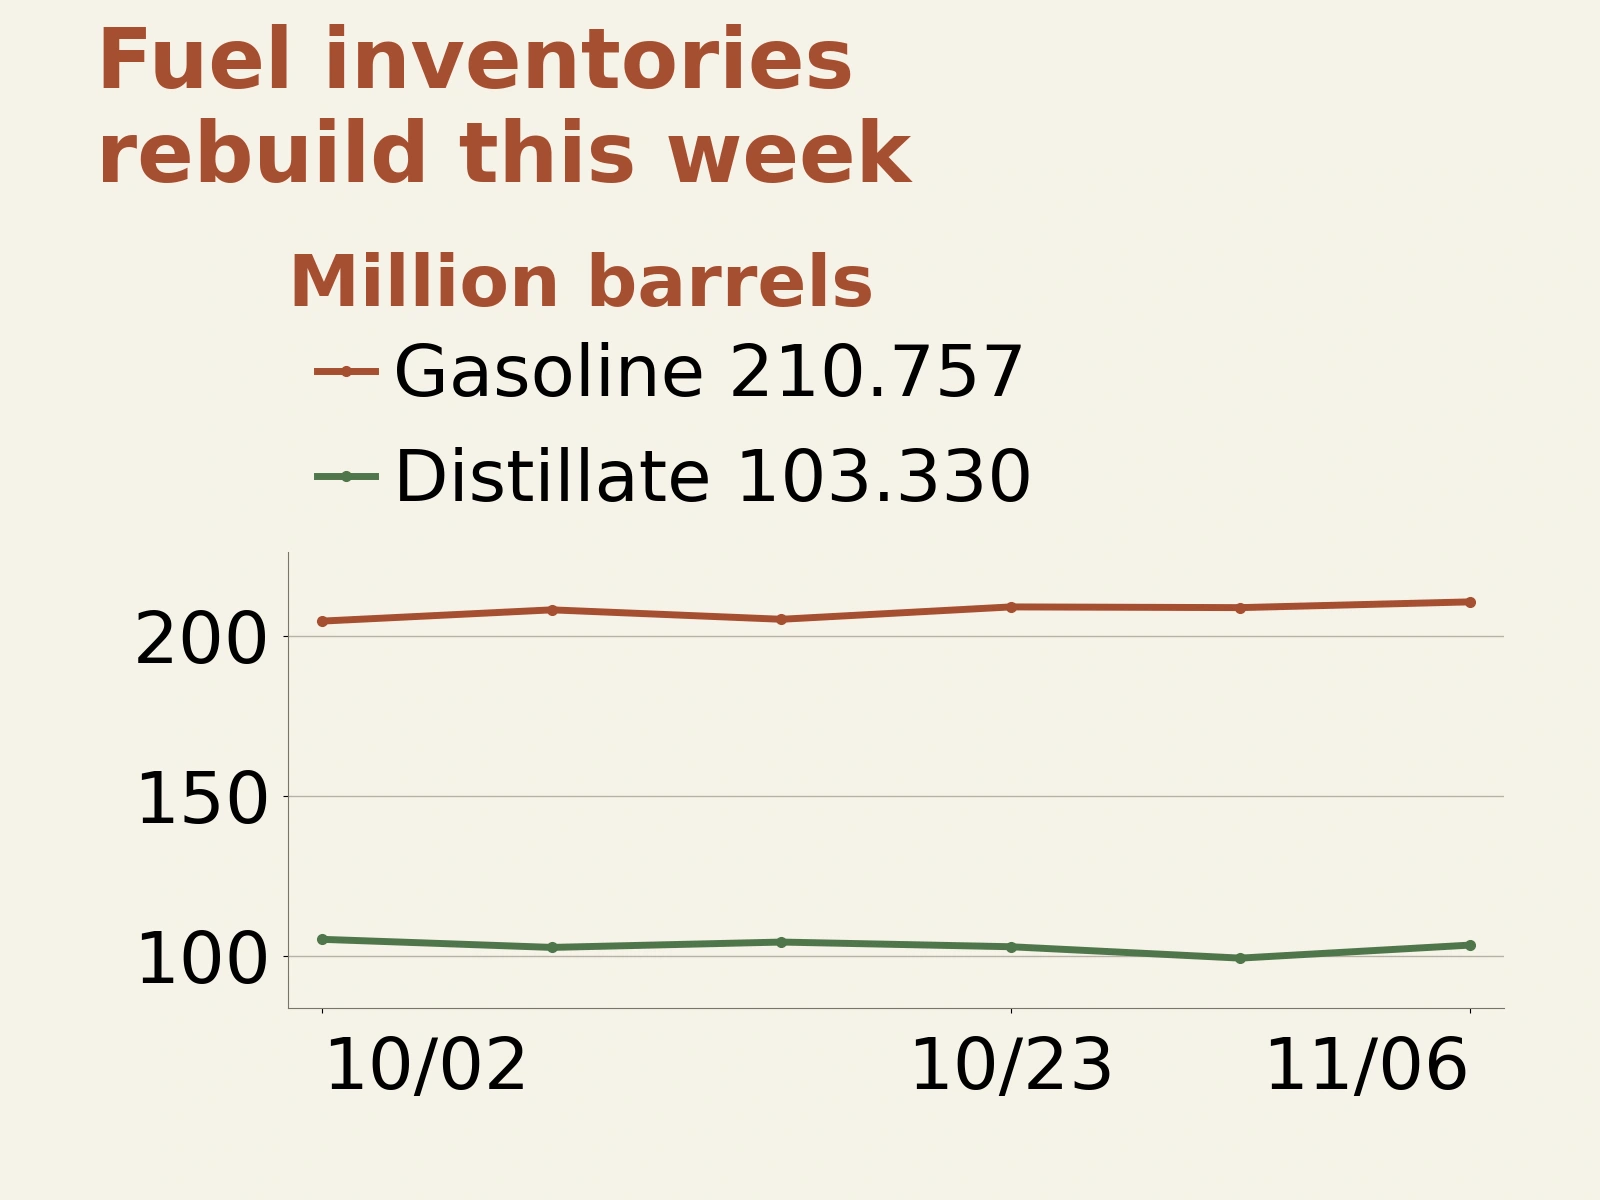
Reuters reported that refinery crude runs increased by 322,000 barrels a day during the week, refinery utilization rose by 0.7 percentage points and net crude imports increased by 544,000 barrels a day. The simultaneous increases in refinery runs and net imports indicate that higher crude inflows contributed to this week’s inventory build; the change in crude stocks alone is insufficient to conclude that end-user consumption fell abruptly. The simultaneous builds in gasoline and distillate stocks provide further evidence of improved refined-product supply.
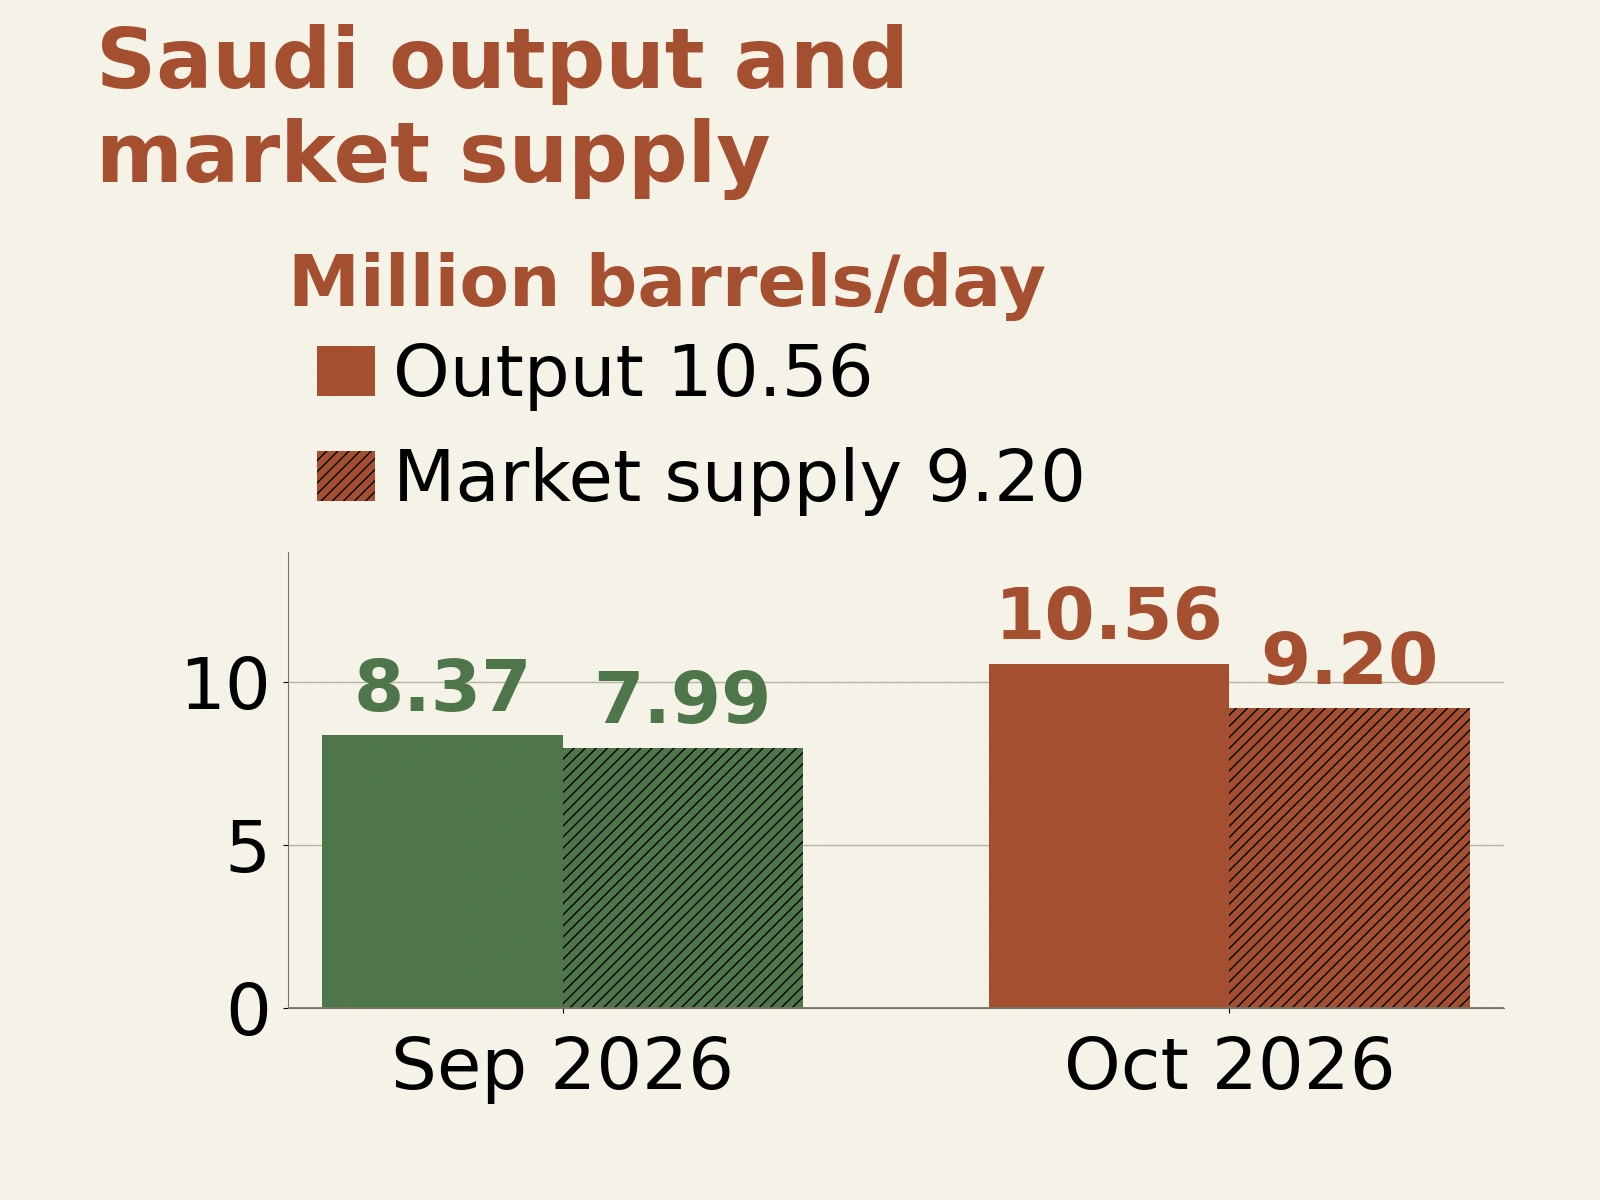
On the production side, India’s ANI news agency, citing OPEC’s November monthly report, said crude output by countries participating in the Declaration of Cooperation rose by about 2.04 million barrels a day month on month in October to 41.23 million barrels a day, on a secondary-source basis. Saudi Arabia accounted for about 9.19 million barrels a day. Saudi Arabia directly reported production of 10.56 million barrels a day and supply to the market of about 9.20 million barrels a day. These differences in reporting measures show why the recovery in wellhead production and the available supply reaching the market need to be tracked separately.
Brent remains 2.46% below November 6; the risk premium hinges on actual deliveries
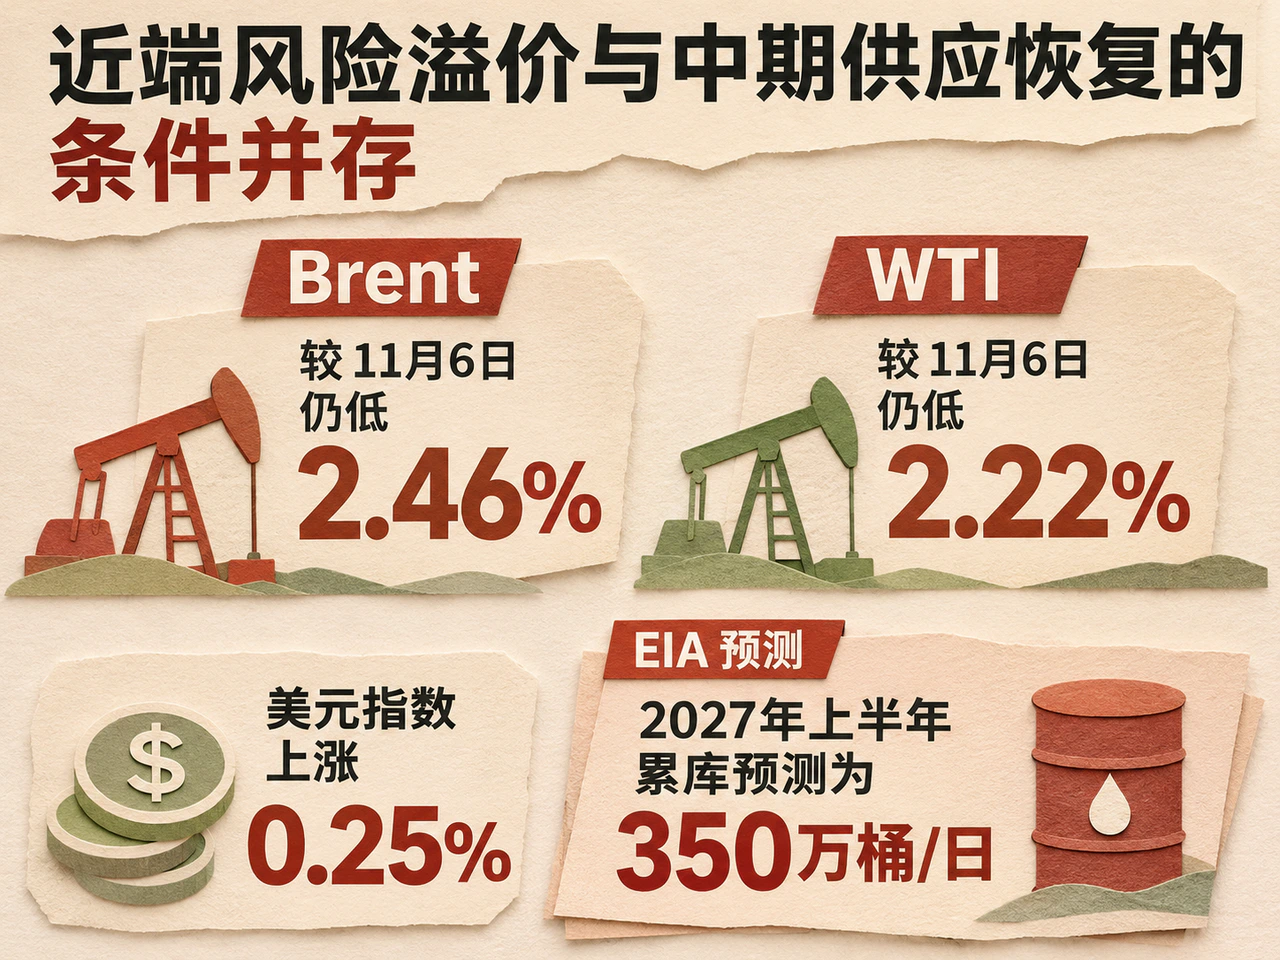
The November 12 increase is more consistent with a renewed premium for transport and delivery risks than with proof that the supply recovery has reversed. On the same Yahoo daily closing-price basis for continuous futures, Brent and WTI remained about 2.46% and 2.22% below November 6, respectively. The day’s rebound had yet to recoup the losses earlier in the week.
Financial conditions did not provide uniform support for crude either. The dollar index rose 0.25% over the same period; a stronger dollar generally raises oil-purchasing costs for buyers using other currencies. The substantial rebound in oil prices despite this suggests that risks specific to crude supply played a greater role in this round of trading.
The longer-term supply-and-demand outlook still points toward recovery. In its November outlook, the EIA forecast that global oil inventories would shift to a build in the fourth quarter after an average draw of 1.2 million barrels a day in the third quarter. It projected inventory builds of 3.5 million barrels a day in the first half of 2027, conditional on continued improvements in the capacity to reroute Middle Eastern exports and a gradual decline in shut-in production. Near-term delivery concerns can coexist with a medium-term supply recovery; prolonged transport disruptions could delay the rebuilding of inventories.
Three developments warrant attention: first, operating and repair updates for Saudi Arabia’s East–West pipeline and Yanbu facilities, including whether there are quantifiable export losses; second, actual traffic through the Strait of Hormuz, insurance and freight rates, and whether attack claims translate into higher transport costs; and third, the EIA’s next crude and refined-product inventory release, to see whether builds continue following the rise in net imports. If transport recovers and inventories continue to rebuild, the risk premium will face pressure to fade. If damage to export routes persistently reduces deliverable volumes, a single weekly build in U.S. inventories will exert less downward pressure on oil prices.