On November 13, 2026, the IEA forecast in its latest monthly report that the global oil market would move into a supply surplus in the fourth quarter. Gulf exports are recovering faster than demand, easing the shortages caused by the war; continuing attacks on merchant vessels and energy facilities are also disrupting that recovery. Brent crude has consequently been trading around $96 a barrel as the market prices in both recovering supply and interruptions to transport.
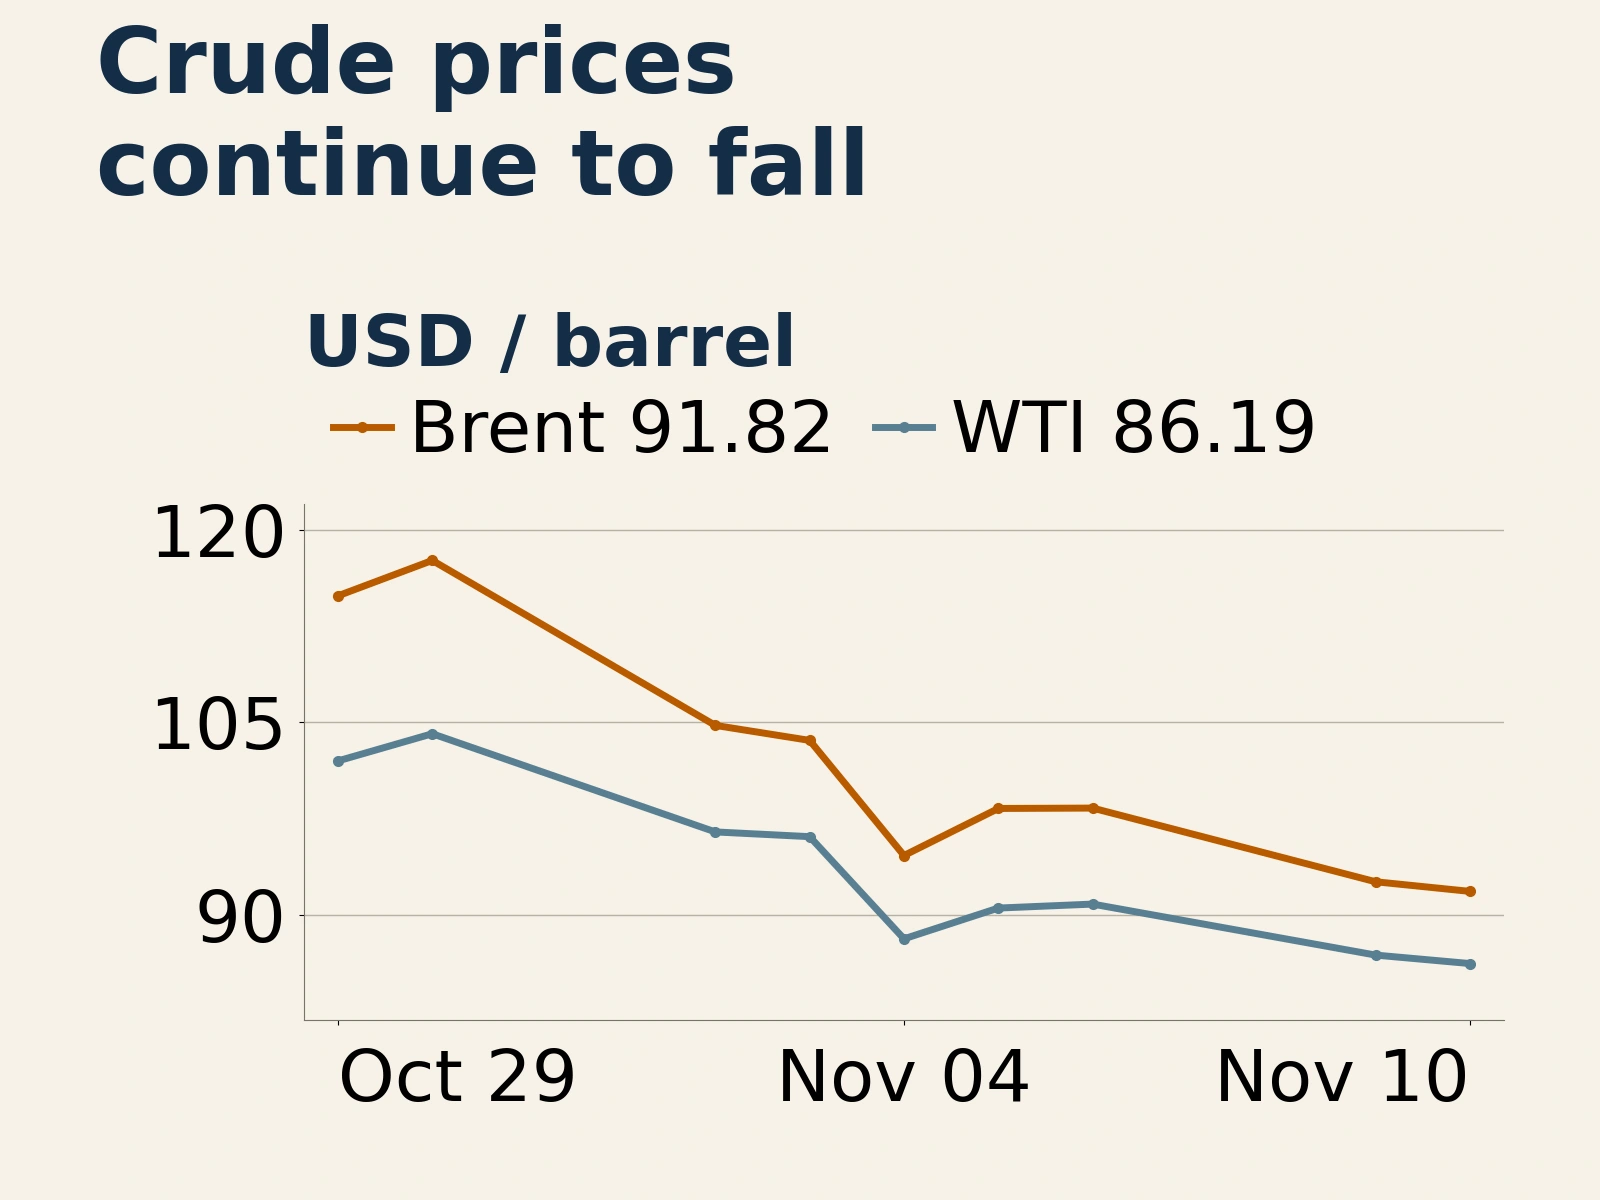
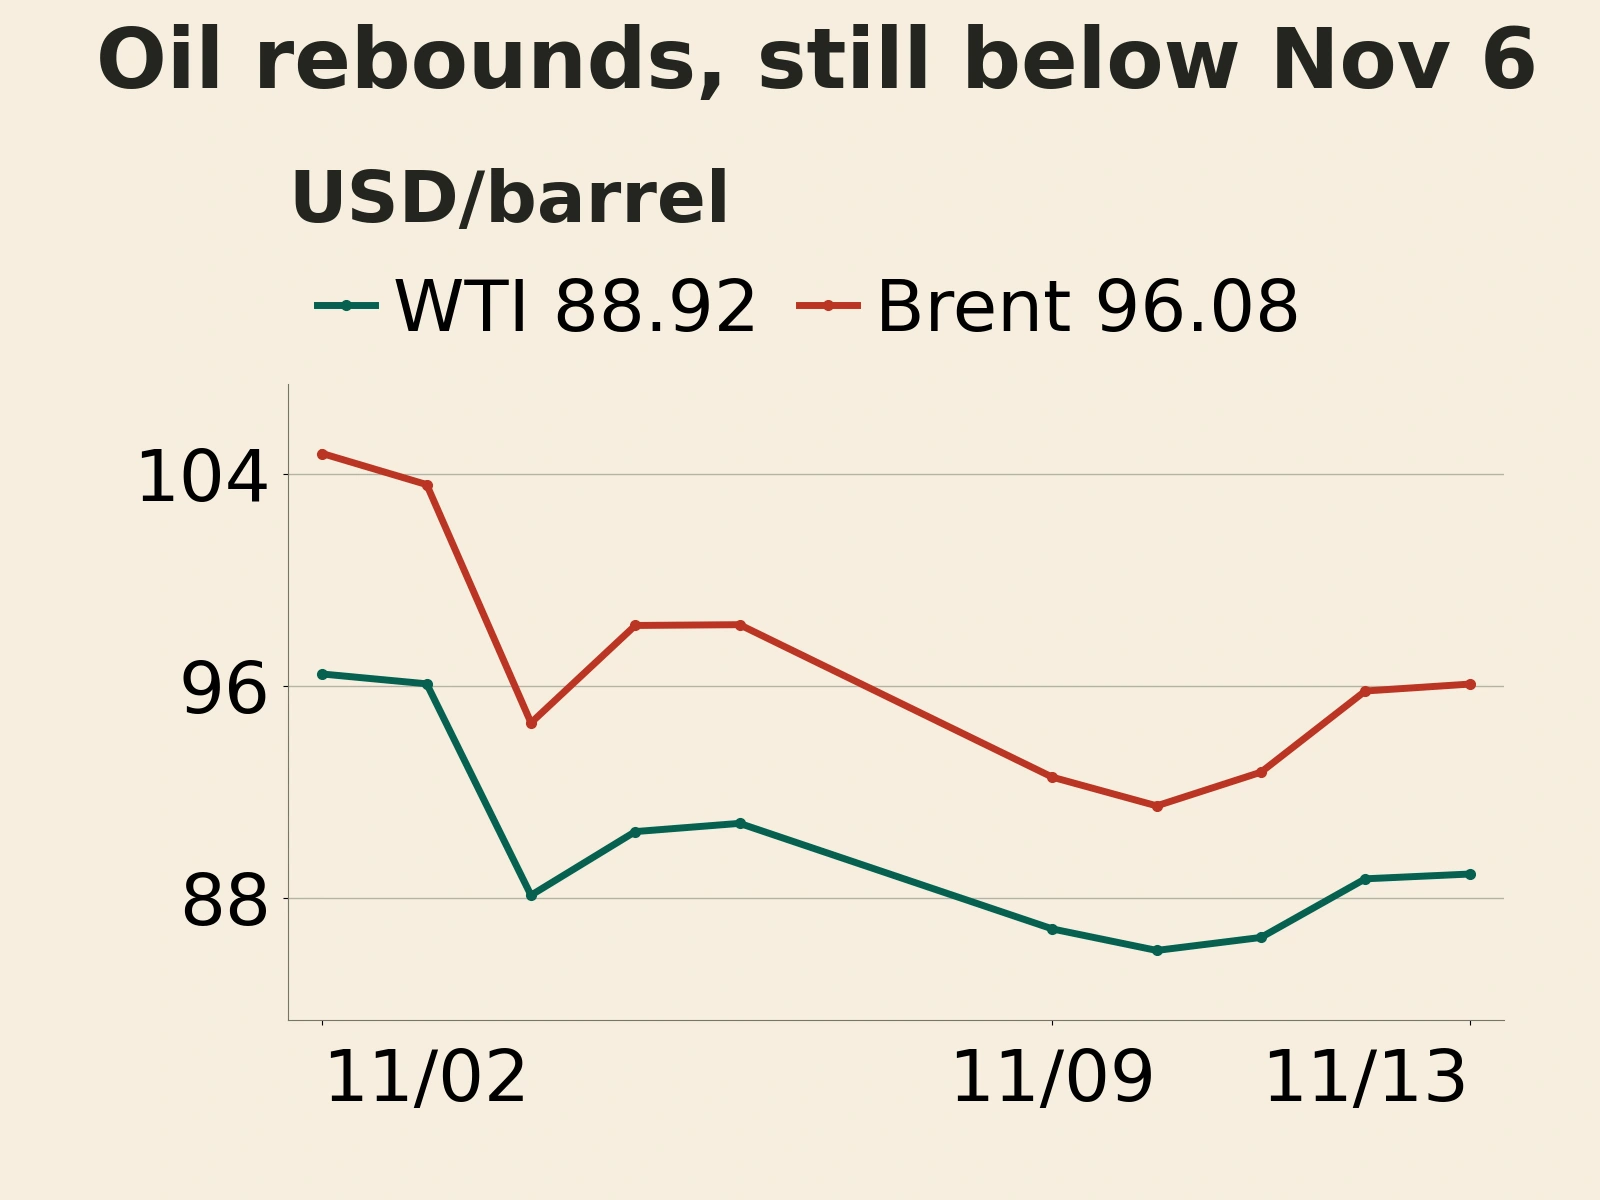
On the Yahoo continuous-contract daily closing-price basis frozen for this edition, Brent ended November 13 at $96.08 a barrel, up $0.26, or 0.27%, from the previous trading day; WTI closed at $88.92, up $0.18, or 0.20%. Both have recovered from their lows for the week on November 10, but remain below their November 6 closes of $98.32 for Brent and $90.83 for WTI. The rebound has yet to recoup the earlier losses.
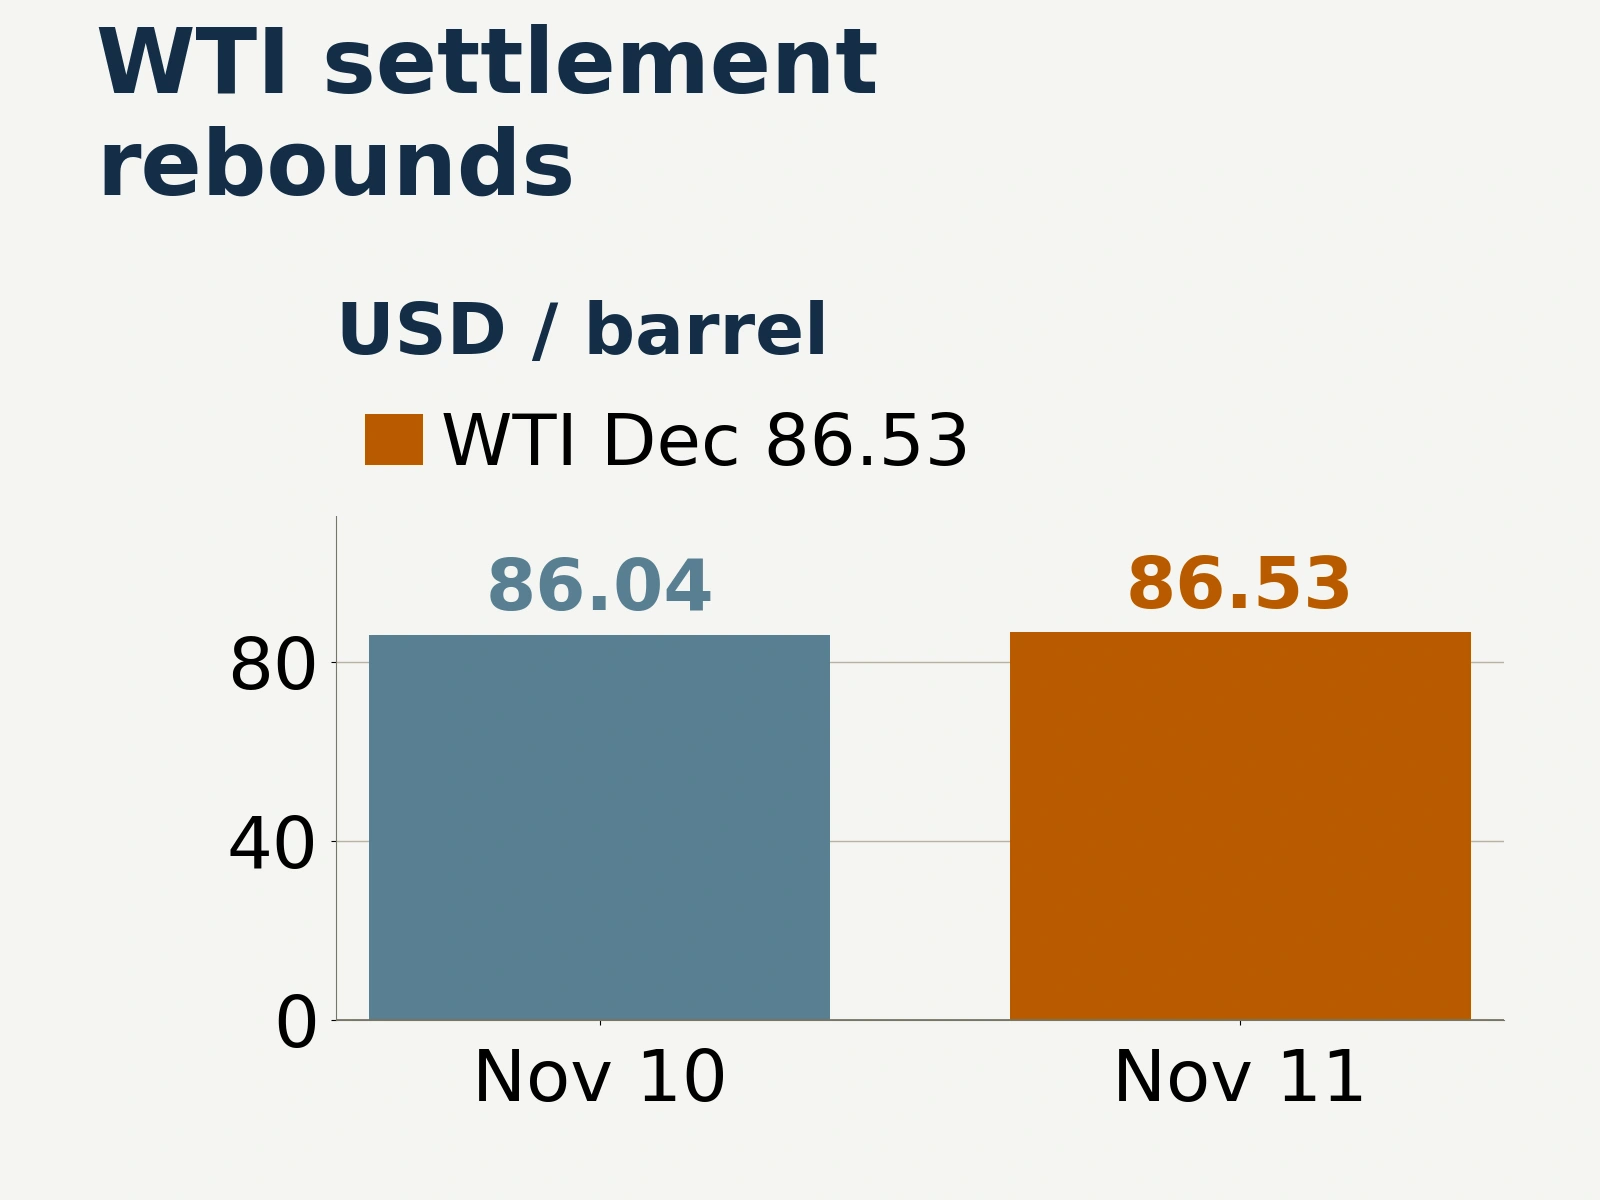
Settlement prices for specific contract months were nearly flat. Bloomberg reported that January 2027 Brent settled at $95.84, up 2 cents, while December 2026 WTI settled at $88.56, down 0.2%. The vendor daily close and the contract settlement are observed at different times and represent different price records within the same market. Brent traded through a range of roughly $2 that day, without establishing a decisive breakout near the close.
October supply rose 2.3 million barrels a day; IEA raises fourth-quarter forecast by 3.3 million
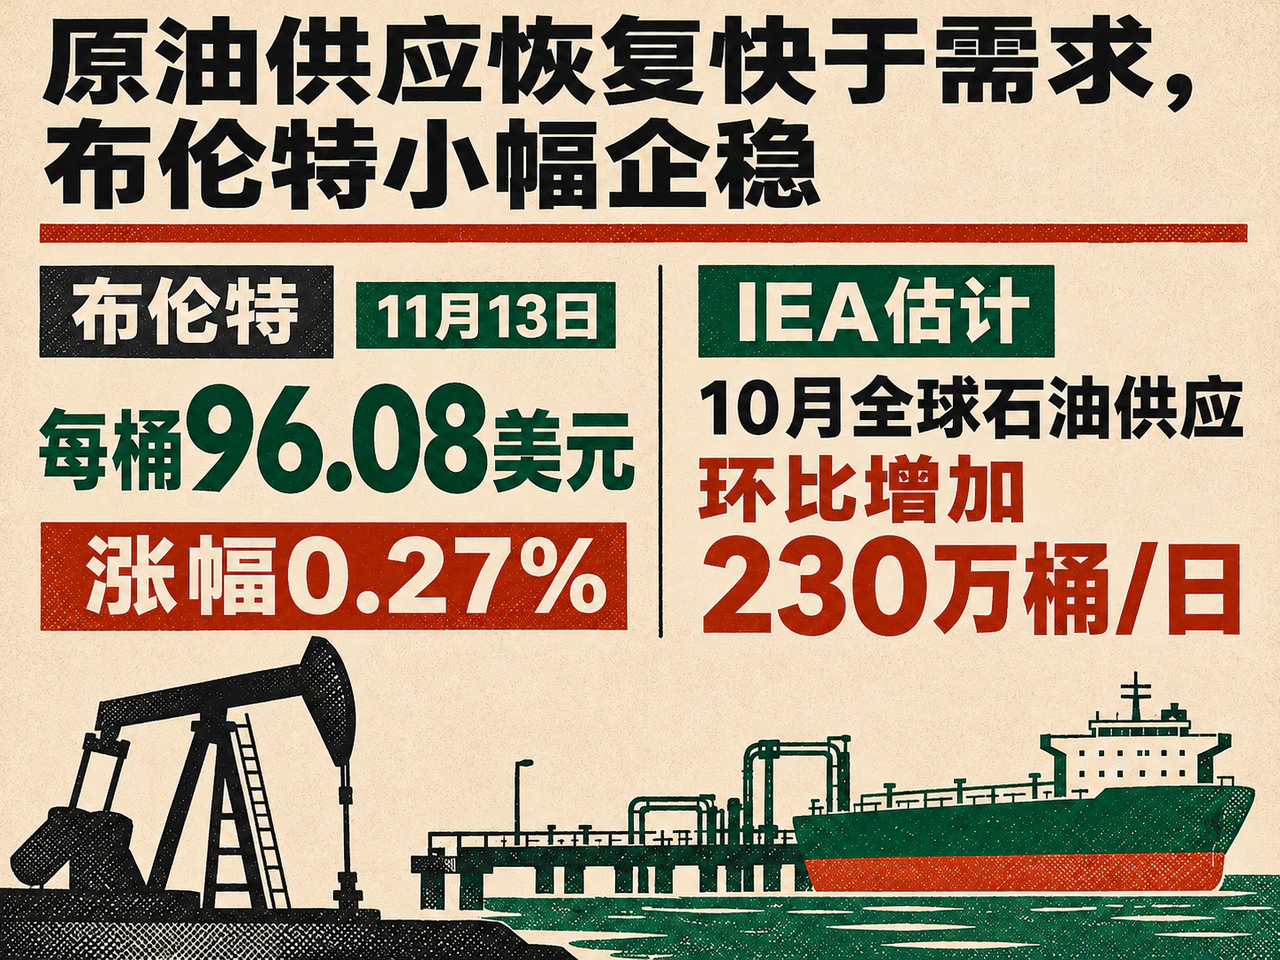
The IEA estimates that global oil supply rose by 2.3 million barrels a day in October to 105.4 million barrels a day, a cumulative increase of 5.3 million since August. Oil exports from Gulf countries excluding Oman climbed to 18.4 million barrels a day, still 26% below prewar levels; crude exports recovered to 15 million barrels a day, equivalent to 82% of their prewar level. The pace of the export recovery prompted the IEA to raise its fourth-quarter global supply forecast by 3.3 million barrels a day.
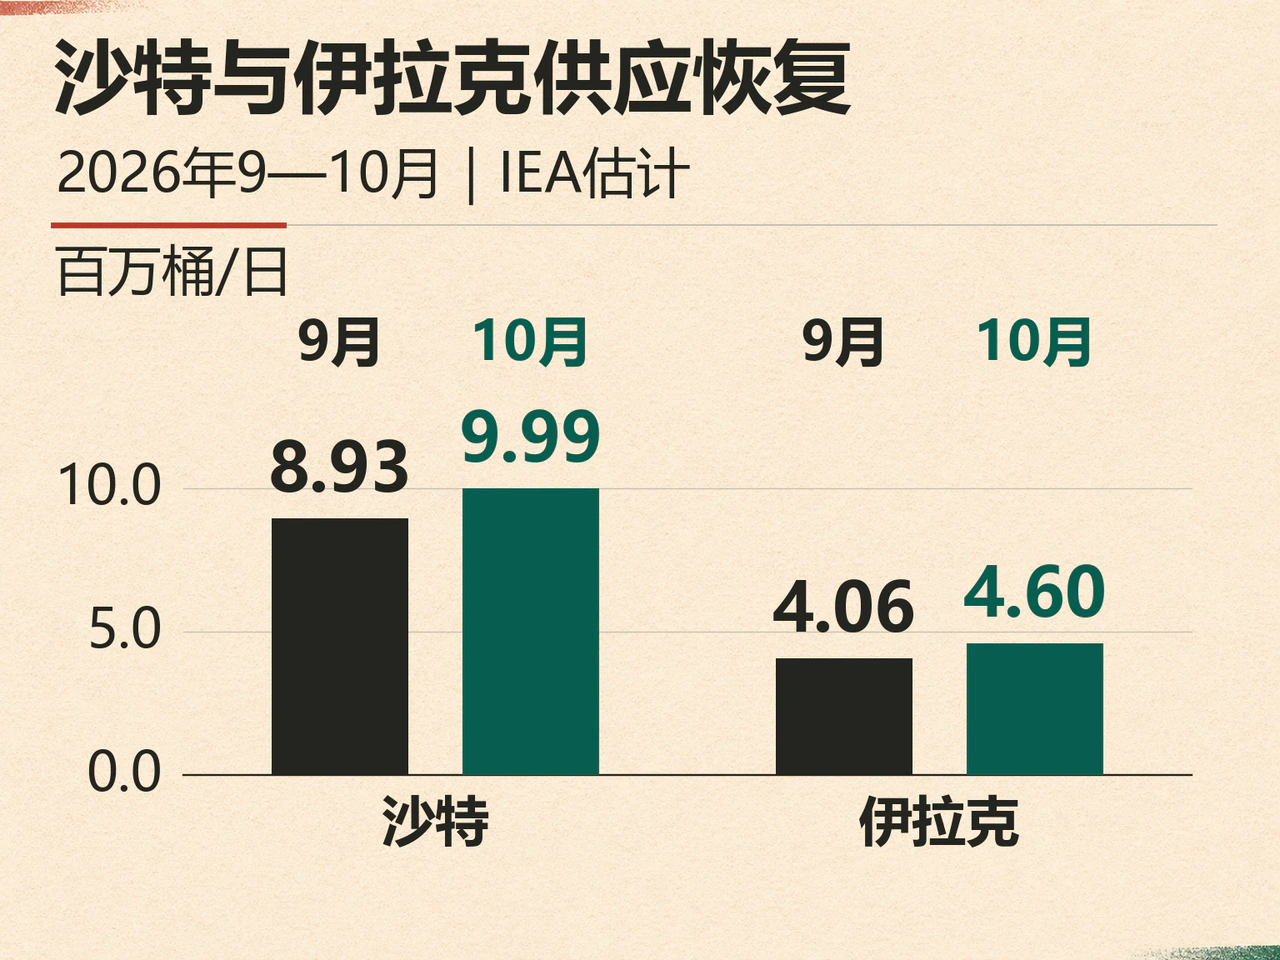
The increase has come mainly from the restoration of disrupted capacity. The IEA estimates that Saudi crude supply rose from 8.93 million barrels a day in September to 9.99 million in October, while Iraqi supply increased from 4.06 million to 4.60 million. On November 1, seven OPEC+ countries decided to maintain the production levels prescribed in September through December; their next meeting is scheduled for November 29. With quotas unchanged but actual supply rising, the immediate question for the market is whether oil already being produced can continue to be loaded onto ships and delivered to refineries.
Demand outlook remains weak: global consumption to fall by 2.7 million barrels a day in 2026
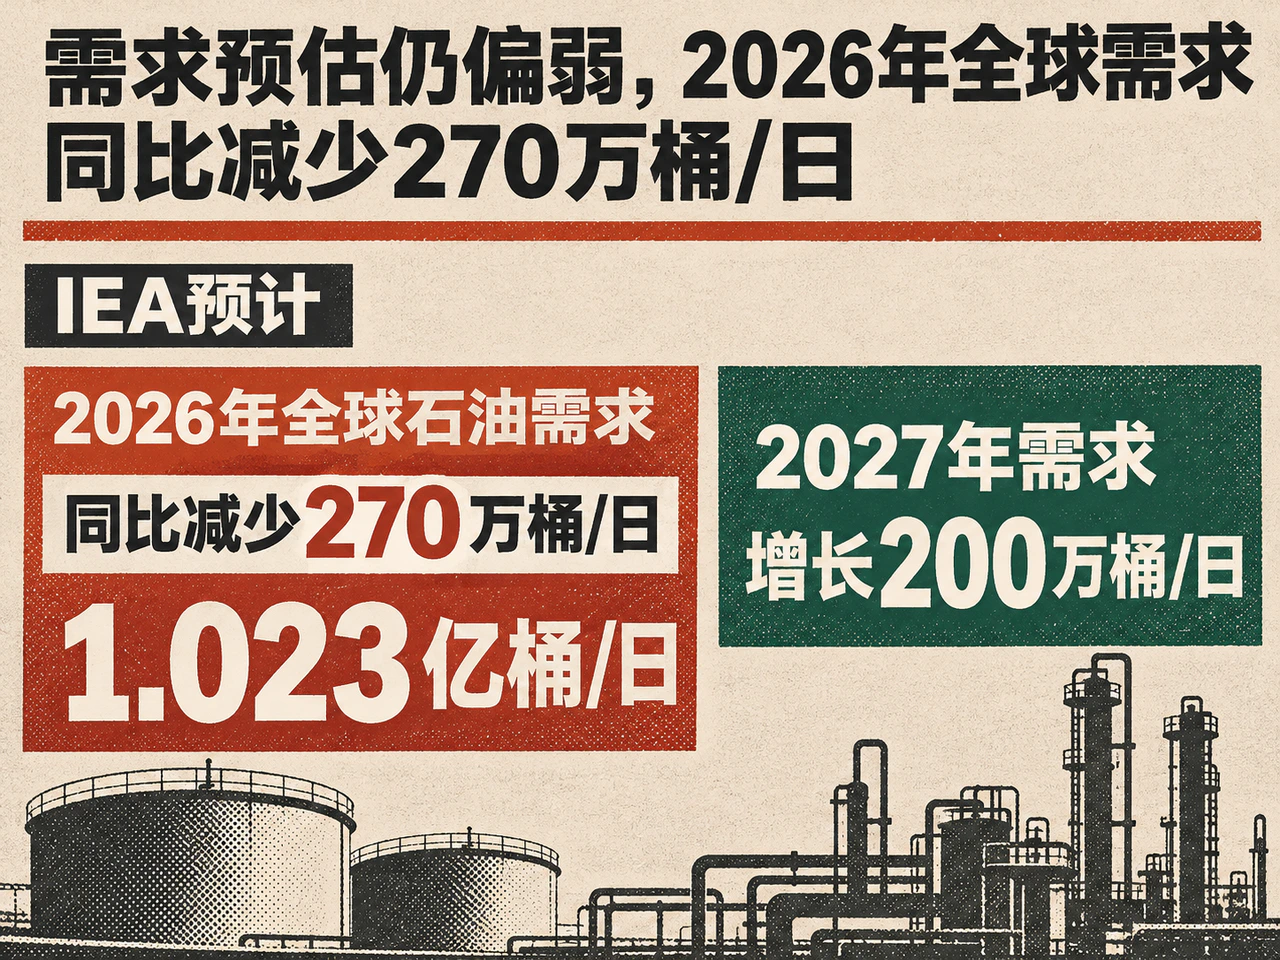
Demand is recovering more slowly than supply. The IEA expects global oil demand to fall by 2.7 million barrels a day year on year in 2026 to 102.3 million barrels a day. It forecasts growth of 2 million barrels a day in 2027, roughly 80% of it from petrochemical feedstocks such as liquefied petroleum gas, ethane and naphtha, with only modest growth in transport fuels. High oil prices, efficiency gains and electrification are jointly restraining road-fuel consumption. The rapid return of supply and slower recovery in demand underpin expectations of a fourth-quarter surplus.
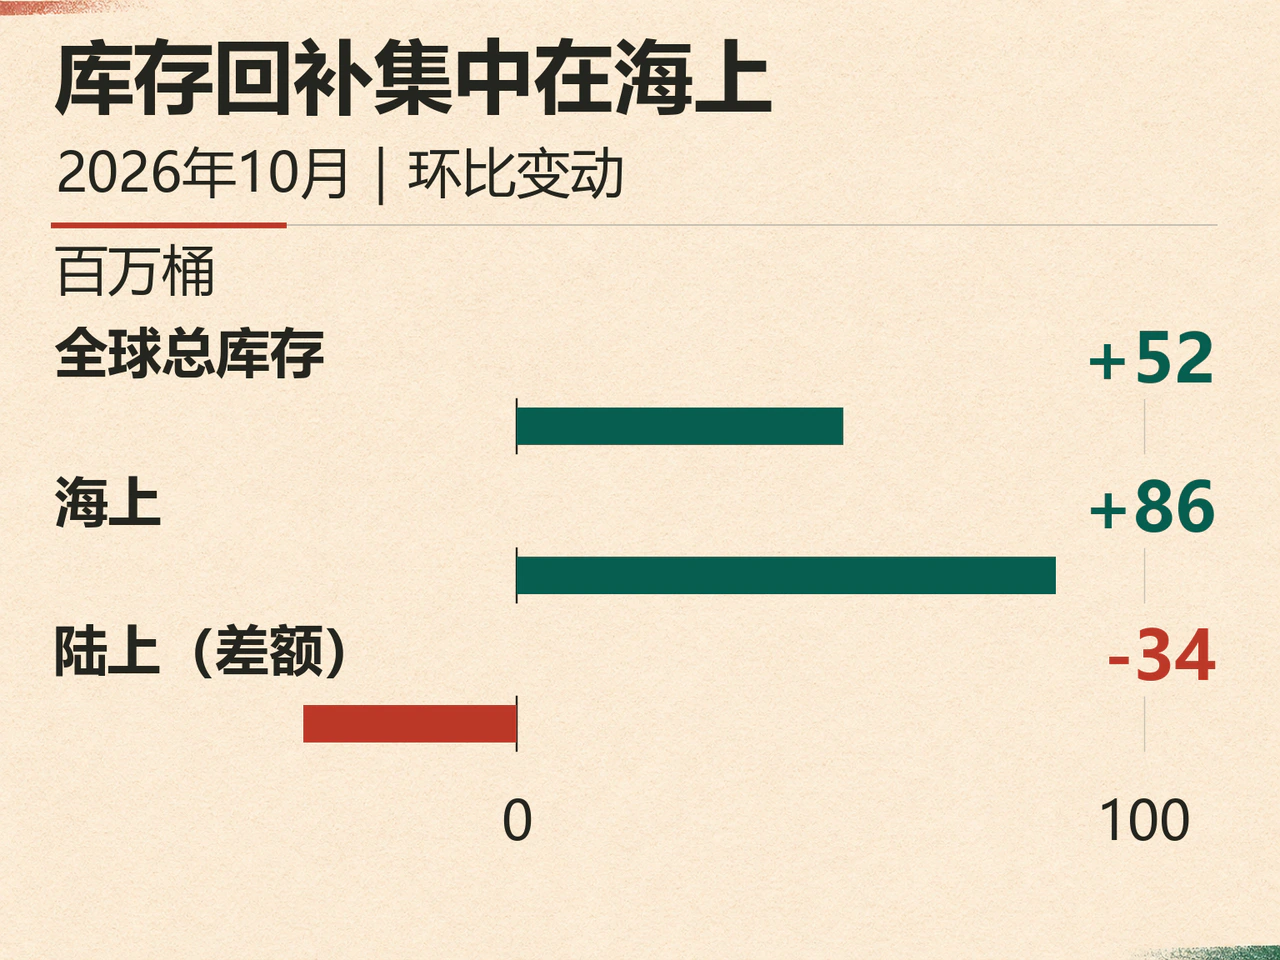
October inventories rose 52 million barrels, building at sea while onshore stocks remained low
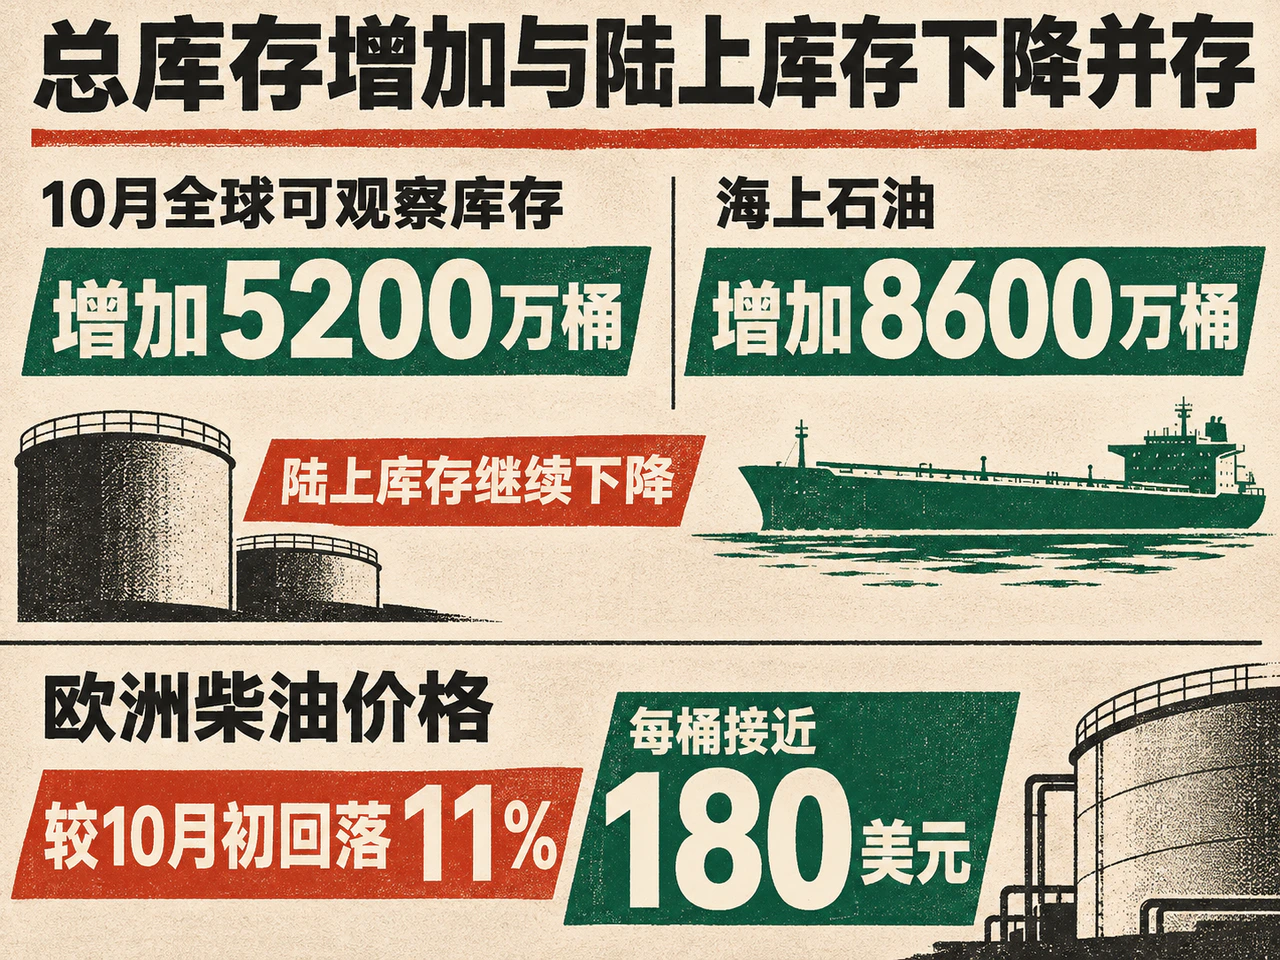
Global observed inventories increased by 52 million barrels in October, their first rise since June. Oil on water increased by 86 million barrels over the same period, while onshore stocks continued to decline and remained at their lowest levels since at least 2016. Higher exports initially appear as cargoes in transit and have yet to fully replenish inventories available to end users. Aggregate crude availability is improving, but the delivery system still has limited buffers.
The recovery in refined products is also lagging crude. The IEA notes that Gulf exports of refined products and liquefied petroleum gas remain at roughly half their prewar levels. European diesel prices have fallen 11% from early October to nearly $180 a barrel, but remain 77% above prewar levels; crude freight rates from the Middle East to Asia remain close to record highs. More crude supply can depress crude prices, while diesel shortages and expensive freight raise the final cost of refined products. Crude prices and the costs paid by refined-product end users may therefore diverge.
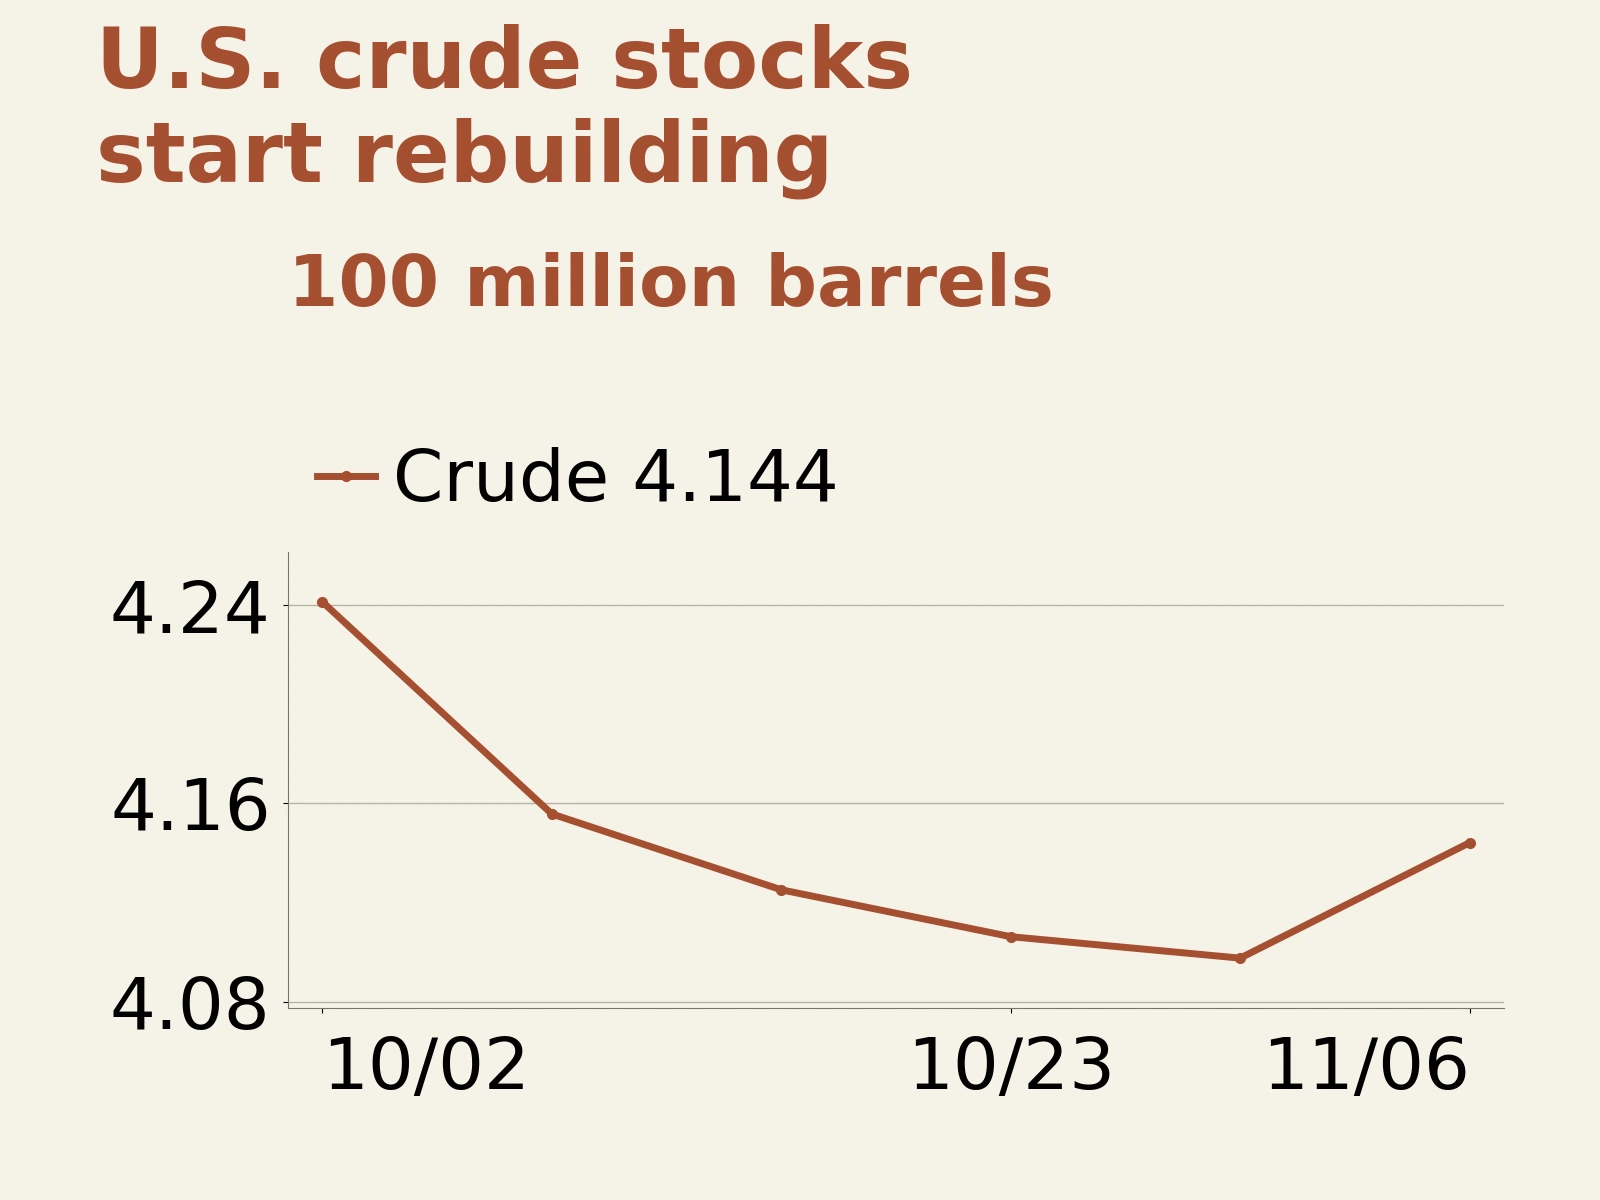
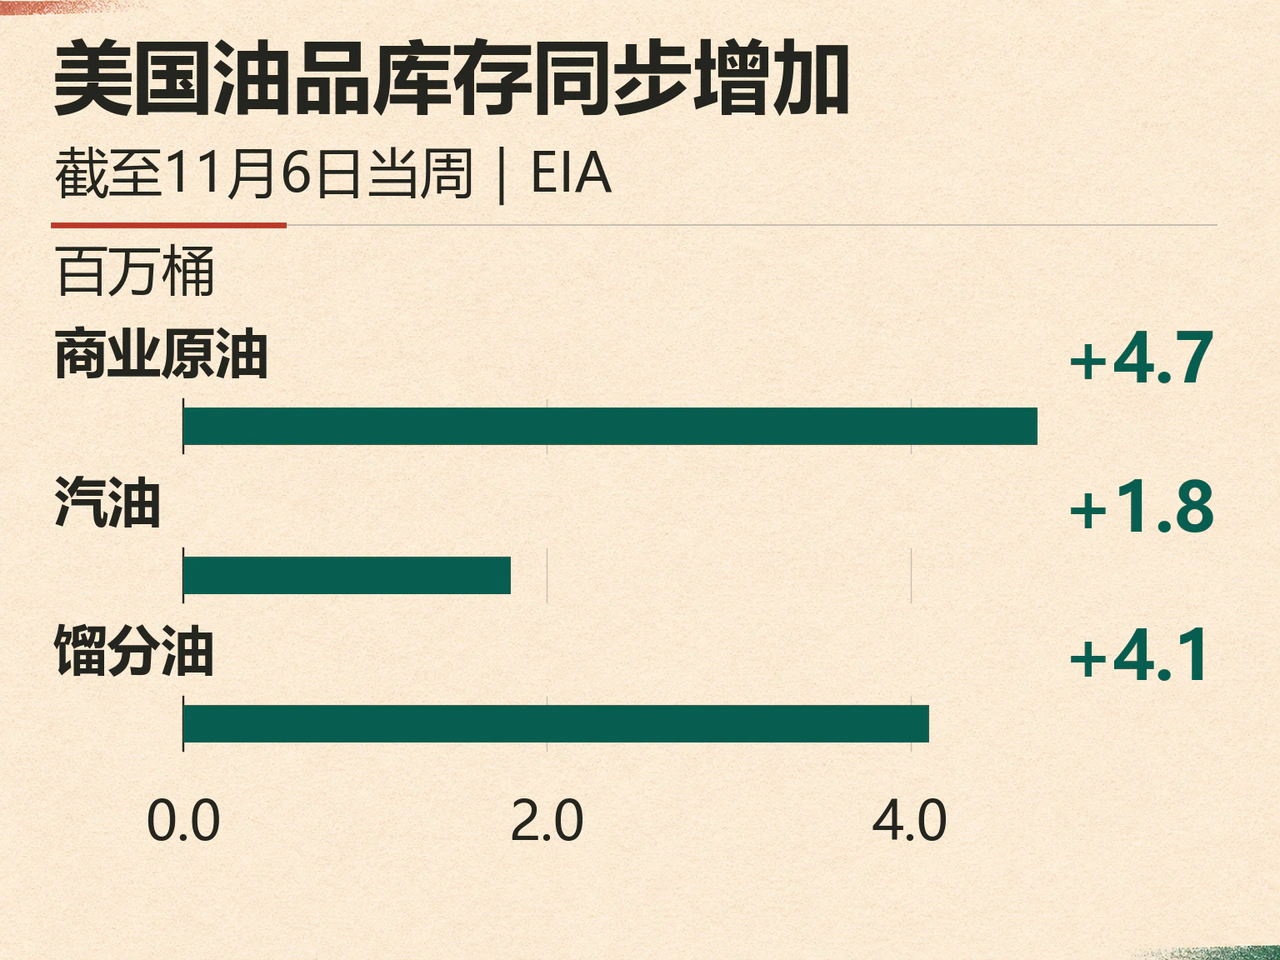
US inventory data also point to looser supply. EIA figures released on November 12 for the week ended November 6 showed commercial crude stocks rising by about 4.7 million barrels to 414.4 million barrels; gasoline stocks increased by 1.8 million barrels and distillates by 4.1 million. Refinery crude runs also rose by 322,000 barrels a day. Net crude imports increased by 544,000 barrels a day, so the inventory build also reflected changes in imports and supply flows.
October saw 36 attacks on merchant vessels, keeping transport risks elevated

An uncertain diplomatic outlook makes it difficult for the risk premium to disappear entirely. Bloomberg reported that Trump asked Vice President Vance to shift his focus to domestic affairs, weakening market expectations of a near-term agreement with Iran. Verisk Maplecroft recorded 36 attacks on merchant vessels in the Persian Gulf, the Strait of Hormuz and the Gulf of Oman in October, the highest monthly total since the war began. Their direct effect on oil prices depends on whether they cause additional loading suspensions, diversions and an actual decline in exports.
A stronger dollar and higher Treasury yields also offered little clear support for oil. On the vendor daily closing-price basis, the dollar index rose 0.23% over the reporting period; the official US 10-year Treasury yield rose to 5.15%, up 5 basis points from the previous day. A stronger dollar increases purchasing costs for buyers using other currencies, while higher financing costs raise the burden of holding inventories. Nevertheless, physical supply and transport remained the main forces in the market that day.
Watch exports, onshore inventory builds and lower freight rates
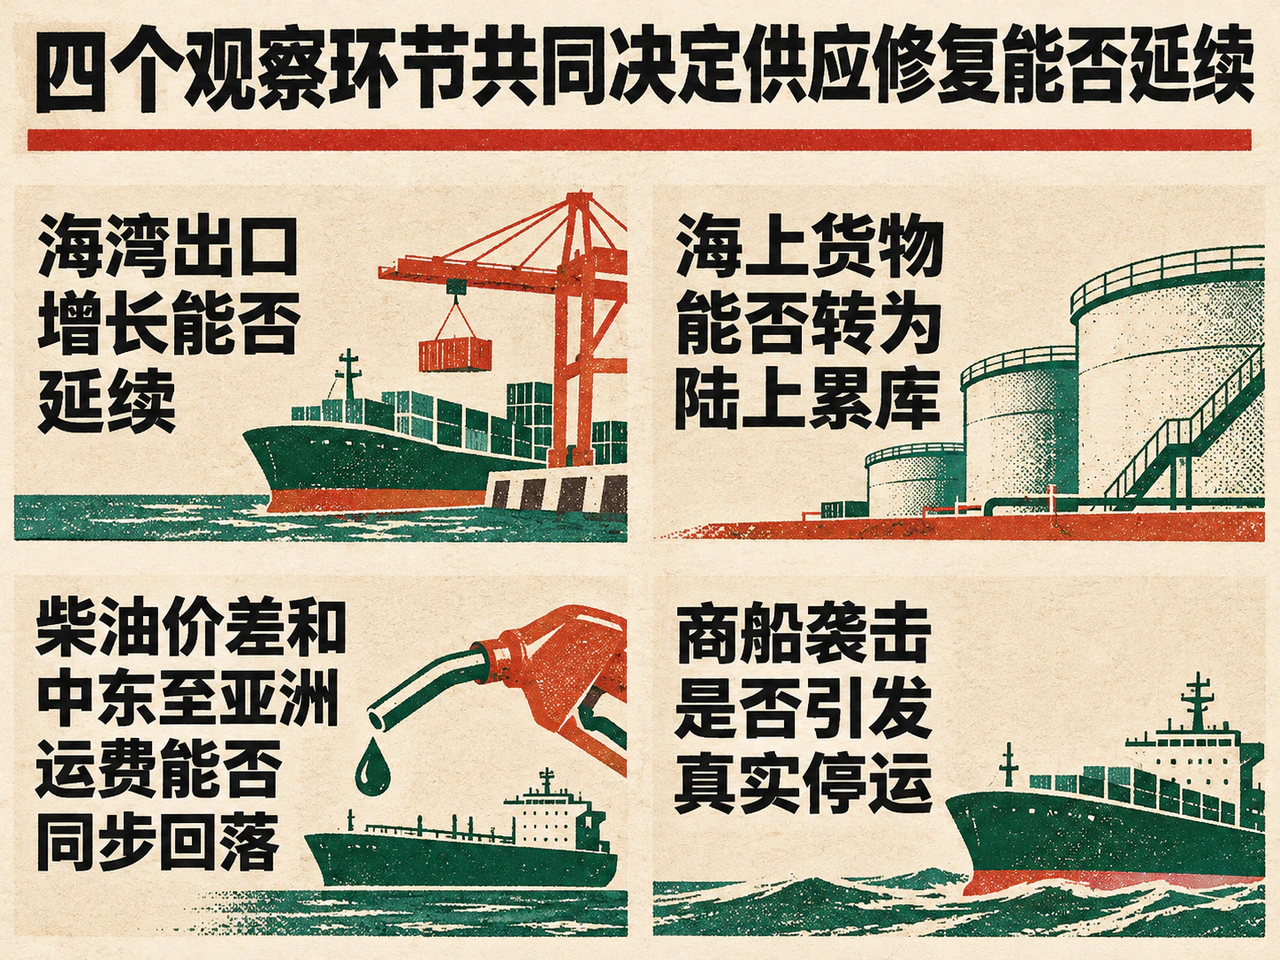
Four developments merit attention: whether Gulf export growth persists, confirming the supply recovery; whether cargoes at sea translate into onshore inventory builds, showing that the recovery is reaching consuming regions; whether diesel spreads and Middle East-to-Asia freight rates decline together, indicating that bottlenecks are easing; and whether attacks on merchant vessels cause actual transport stoppages, requiring a renewed increase in the risk premium. Current evidence points more strongly toward a gradual easing in the crude supply-demand balance. Supply chains have yet to return to normal, however, and prices will remain sensitive to actual transport losses.